Support the Arctic Sea Ice Forum and Blog

Author Topic: 2015 sea ice area and extent data  (Read 703908 times)

Bob Wallace

  • Young ice
  • Posts: 3855
    • View Profile
  • Liked: 41
  • Likes Given: 5
Re: 2015 sea ice area and extent data
« Reply #100 on: March 05, 2015, 07:01:12 PM »
Throw into the mix of accelerating forces the condition of the ice.

We no longer have massively thick sheet of solid ice but more "slush".  Those smaller pieces are going to be more easily transported out where they will quickly melt.

I'm betting 2015 will be the 'Year of the Big Flush'.  All we need is some wind to make it happen.

jdallen

  • Young ice
  • Posts: 3412
    • View Profile
  • Liked: 651
  • Likes Given: 244
Re: 2015 sea ice area and extent data
« Reply #101 on: March 05, 2015, 07:21:51 PM »
Meirion - temp in this case is an effect not a cause.  The key is insolation. heat in the atmosphere actually transfers very little energy to the ice, and exposed sea water would tend to keep temperatures down, in part due to evaporation.

Again, the threat this summer and my concern is tied to *many* factors, current temperatures being just one.
This space for Rent.

jdallen

  • Young ice
  • Posts: 3412
    • View Profile
  • Liked: 651
  • Likes Given: 244
Re: 2015 sea ice area and extent data
« Reply #102 on: March 05, 2015, 07:35:25 PM »
Keeping in mind that springtime performance is in no way a reliable indicator of the summer minimum, it's still startling to see that, as of today, extent is more than one million square kilometers lower than it was on this same date in 2012. That's nearly the size of California and Texas combined:

04 March 2012: 14,699,717 km2
04 March 2015: 13,688,997 km2

It's important to remember that even 2014 experienced a number of record daily lows in February and March, and that most of the daily record lows for April and May are still held by 2006. 2012--the Arctic sea ice's annus horribilis--didn't move into record territory for good until June, so any predictions made now should be taken with a huge grain of salt.

But, still; a million km2. Yikes...
I get your skepticism based on the behavior of 2006 and 2012.  I'll point out that (1) the ice is much different and (2) the amount of heat generally in the arctic has continued  rise.  Weather and feedbacks will undoubtedly come more into play in spring, as paradoxically, the same moisture retaining heat now will start to buffer incoming heat.  But yah, yikes! 1 million KM2 lower will make protection of the remaining extent much harder, much earlier.  More open water will make up for some of the recent lack of melt ponds.

Personally, I think it's going to be a crazy season.
This space for Rent.

viddaloo

  • Nilas ice
  • Posts: 1302
  • Hardanger Sometimes
    • View Profile
  • Liked: 1
  • Likes Given: 0
Re: 2015 sea ice area and extent data
« Reply #103 on: March 05, 2015, 07:47:16 PM »
Soot from wildfires landing on snow–free tundra will be *below* the new snow that falls in autumn, and thus won't contribute to increased melting. On the contrary, the smoke will save thousands of cubic kilometers of sea ice from midsummer melt, in turn causing higher albedo in the CAB.
[]

LRC1962

  • Frazil ice
  • Posts: 447
    • View Profile
  • Liked: 11
  • Likes Given: 3
Re: 2015 sea ice area and extent data
« Reply #104 on: March 05, 2015, 10:28:24 PM »
Soot from wildfires landing on snow–free tundra will be *below* the new snow that falls in autumn, and thus won't contribute to increased melting. On the contrary, the smoke will save thousands of cubic kilometers of sea ice from midsummer melt, in turn causing higher albedo in the CAB.
I have lived in a snow country most of my life, Canada, Although I have not made a study of it, I have never witnessed that behavior myself. One part is that of increased albedo with new snow. It seems you are presuming no new fires. Fire season all over the Arctic region is  getting longer and starting earlier. More fires more soot. Also the soot coming from China is getting more and more dense and can easily be seen from space stretching farther and farther from China. I suspect you will find some of landing on that fresh snow and mixed in it as it falls, making it dirty snow. As for the fresh snow not getting impacted by a lower layer of soot? If any melt occurs all I have seen is that very quickly the lower dirty snow gets mixed in with the new snow very quickly.
Another issue that is getting into play more and more is that you have very little ice left that is saline free. 10 years ago old MYI would have been. Now most ice that is labeled MYI is in fact ridged ice that has been compacted together all of which has a fair amount of saline in it still.
Any study I have seen about saline ice is that air, water and particulates travel freely up and down its depth until the salt has been pressed out of it, and that does not happen until 3+ yr old ice. As I stated before, we have very little of true MYI left.
Jason Box is seeing the same thing on the Greenland ice sheets. old soot is getting added to new soot and that is why the sheets are getting darker and darker.
"All truth passes through three stages: First, it is ridiculed; Second,  it is violently opposed; and Third, it is accepted as self-evident."
       - Arthur Schopenhauer

DavidR

  • Grease ice
  • Posts: 740
    • View Profile
  • Liked: 36
  • Likes Given: 3
Re: 2015 sea ice area and extent data
« Reply #105 on: March 05, 2015, 10:31:28 PM »
Since 2007 the increase to date from Feb 1st looks like this: (1000 km^2)
   Max: 1221
   Ave:   675
   Min:    455
   2015: 121

We need rises above 265 to not be at record lows for the next three days and above 190 to not be at record lows for the next six.

The one positive thing in this gloomy outlook is that although the ice may  not have been extending it may  have been consolidating, so the melt  may be slowed. However with the winds and warmth we have seen over the past month even that may not have occurred.  Certainly the thickness estimates are looking appalling low.

I expect the PIOMAS figures for February  will give us a good indicator of where we are going.

« Last Edit: March 06, 2015, 12:38:58 AM by DavidR »
Toto, I've a feeling we're not in Kansas anymore

viddaloo

  • Nilas ice
  • Posts: 1302
  • Hardanger Sometimes
    • View Profile
  • Liked: 1
  • Likes Given: 0
Re: 2015 sea ice area and extent data
« Reply #106 on: March 05, 2015, 10:57:37 PM »
As for the fresh snow not getting impacted by a lower layer of soot? If any melt occurs all I have seen is that very quickly the lower dirty snow gets mixed in with the new snow very quickly.

Seriously, if you get a meter or two of snow on top of some ash and soot that is on the bare tundra ground underneath all that snow, that is not going to affect the albedo or melting of that snow. The meters of snow melt from the top down, not the other way around. When melt gets down to the soot there is no more snow to melt. That's why I say soot on the bare tundra does not increase snow melt. The soot is under the snow and the sun does not know about it until it's too late to melt already melted snow.
[]

LRC1962

  • Frazil ice
  • Posts: 447
    • View Profile
  • Liked: 11
  • Likes Given: 3
Re: 2015 sea ice area and extent data
« Reply #107 on: March 05, 2015, 11:21:04 PM »
Sorry about missing the point of you talking about tundra. Point of fact there is virtually no more year round snow left in the tundra anywhere. Granted this year there was quite a bit of snow fall but I can not see it sticking around for long as the ground is no longer frozen until you get deeper down. The soot I was thinking about was on the ice itself. Another point is that in isolated spots you may get meters of snow on a bad snow winter, but for the most part you measure tundra snow by the cm. reason is the wind may blow the snow around so much you can not see but accumulations in an Arctic blizzard normally are in the 2-4 cm range. Only in the lower latitudes such as the US-Canadian border do you get blizzards that bring in accumulations of 60cm+.
"All truth passes through three stages: First, it is ridiculed; Second,  it is violently opposed; and Third, it is accepted as self-evident."
       - Arthur Schopenhauer

viddaloo

  • Nilas ice
  • Posts: 1302
  • Hardanger Sometimes
    • View Profile
  • Liked: 1
  • Likes Given: 0
Re: 2015 sea ice area and extent data
« Reply #108 on: March 05, 2015, 11:31:13 PM »
Yup, I sort of figured there had to be some major misunderstanding there! :D

Pardon me, I'm from the West of Norway. I've just been a week literally digging our cottage out of 3 or 4 meters of snow. Not foot or feed or yards or inches. Meters. The landscape is 'alpine tundra' but the precipitation is just absurdly high.

I do admit I'm uncertain about the particle size and flight ability of 'soot', 'black carbon' and the like. But I'm pretty sure smoke stays longer in the air than bigger particles. And I know frost fog forms more easily around smoke particles, so that may be key to slow summer melt in the Arctic.
[]

OldLeatherneck

  • Grease ice
  • Posts: 554
    • View Profile
  • Liked: 2
  • Likes Given: 0
Re: 2015 sea ice area and extent data
« Reply #109 on: March 06, 2015, 12:00:42 AM »


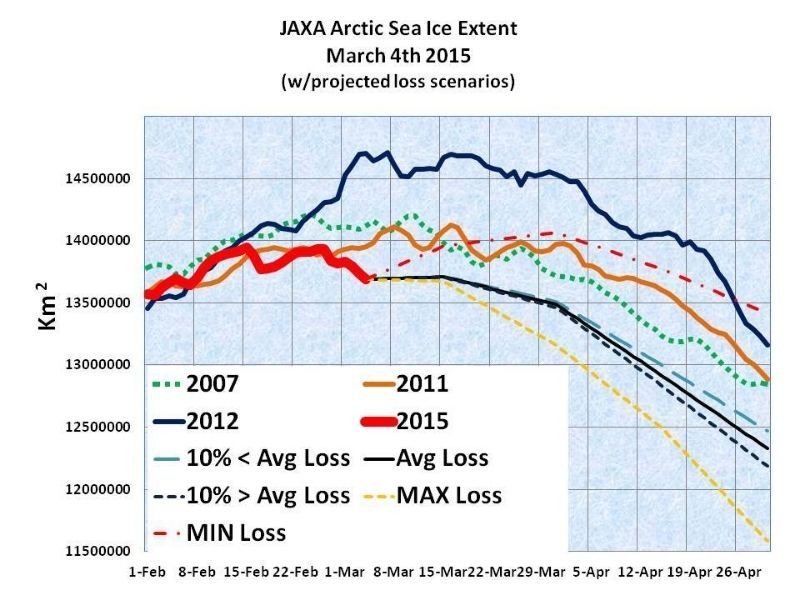
Just to have some fun, I thought I'd run some projections, thru April based prior years data.  I used all years from 2003 - 2014, looking at gains/losses for 4 time frames; the first 15 days of March, the last 16 days of March, the first 15 days of April and the last 15 days of April.  What somewhat surprised me was that during  the first half of March there was an average daily gain of almost 1,900 Km2 followed in the second half of March with an average daily loss of almost 6,900 Km2.  I was equally surprised to see how linear the average daily losses were in April with the first half losing just over 38,000 Km2 during the first half and just over 39,000 during the second half of the month.

Using the average gain/loss for each of the 4 time frames I plotted 3 projected scenarios; 1 using 10% less than the average, 1 using the average and 1 using 10% more than the average for each day.  To plot the extreme MIN and MAX scenarios, for each time frame, I selected data from the year having the Best Case and the year having the Worst Case data. For Example:

1.  For the first half of March, 2013 had an average daily gain of only 1,601 Km2 and 2014 had an average daily loss of 24,216 Km2.
2. For the last half  of April, 2007 had an average daily loss of 23,872 Km2 and 2012 had an average daily loss of 60,507 Km2.

What I am most concerned about right now is what will happen in the next 10-12 days.  In reading comments on this and other threads, it appears that this ice is thinner this year, the Arctic temps will remain high for the next week and there may be a cyclone on the way.  This it makes it unlikely that there will be in net Extent gain between now and the middle of March. If it turns out that there are significant Extent losses in the next few weeks almost any scenario will keep 2015 in close contention with 2007, 2011 and 2015.

We may be entering uncharted waters (without the ice!!)
"Share Your Knowledge.  It's a Way to Achieve Immortality."  ......the Dalai Lama

viddaloo

  • Nilas ice
  • Posts: 1302
  • Hardanger Sometimes
    • View Profile
  • Liked: 1
  • Likes Given: 0
Re: 2015 sea ice area and extent data
« Reply #110 on: March 06, 2015, 12:53:28 AM »
We may be entering uncharted waters (without the ice!!)

Not if we can all just agree to use NSIDC extent and forget about JAXA:

- NSIDC uses a 25km grid. Jaxa probably used a 12.5 km grid, an since AMSR2 10km;

Most of the differences in extent are probably explained by the last point: extent increases with a courser grid and gives more false ice due to the land spillover effect.

Through our choice of the NSIDC metrics we can artificially add about 0.7 million km2 of 'ghost ice' or only–in–a–computer ice. Where is this seemingly bountiful and free extra ice? Only on computer hard–drives. But if we all *believe* that ice to be real, our common faith energy may just make it so.
[]

jdallen

  • Young ice
  • Posts: 3412
    • View Profile
  • Liked: 651
  • Likes Given: 244
Re: 2015 sea ice area and extent data
« Reply #111 on: March 06, 2015, 01:40:11 AM »

Just to have some fun, I thought I'd run some projections, thru April based prior years data.

<snippage>

1.  For the first half of March, 2013 had an average daily gain of only 1,601 Km2 and 2014 had an average daily loss of 24,216 Km2.
2. For the last half  of April, 2007 had an average daily loss of 23,872 Km2 and 2012 had an average daily loss of 60,507 Km2.

What I am most concerned about right now is what will happen in the next 10-12 days. 

<snippage>

We may be entering uncharted waters (without the ice!!)

Interesting modeling, Old Leatherneck.

In a word, YES.

Much less the last few years, I don't think there's been weather and ice conditions like this in the Arctic for centuries, probably hundreds of millennia.

We are definitely in uncharted waters.
This space for Rent.

OldLeatherneck

  • Grease ice
  • Posts: 554
    • View Profile
  • Liked: 2
  • Likes Given: 0
Re: 2015 sea ice area and extent data
« Reply #112 on: March 06, 2015, 11:55:48 AM »
JAXA Extent March 5th - 13,664,797 Km2 - Down 24,200 Km2

Down 153,520 Km2 in the first 5 days of March for an average loss of   30,704 Km2 per day.

The typical March has Extent undulating up and down, with the first half of the month slightly gaining Extent and the last half  of the month beginning to trend downwards. 
"Share Your Knowledge.  It's a Way to Achieve Immortality."  ......the Dalai Lama

OldLeatherneck

  • Grease ice
  • Posts: 554
    • View Profile
  • Liked: 2
  • Likes Given: 0
Re: 2015 sea ice area and extent data
« Reply #113 on: March 06, 2015, 01:26:17 PM »
Average JAXA Extent (2003-2014)
12-Apr      13,760,053
13-Apr      13,714,346
14-Apr    13,679,265      5 March 2015   13,664,797
15-Apr      13,638,698
16-Apr      13,593,635


It would appear that we are about 5 weeks ahead of where we should be!!
"Share Your Knowledge.  It's a Way to Achieve Immortality."  ......the Dalai Lama

Jim Hunt

  • First-year ice
  • Posts: 6270
  • Don't Vote NatC or PopCon, Save Lives!
    • View Profile
    • The Arctic sea ice Great White Con
  • Liked: 894
  • Likes Given: 87
Re: 2015 sea ice area and extent data
« Reply #114 on: March 06, 2015, 01:58:33 PM »
It would appear that we are about 5 weeks ahead of where we should be!!

Don't forget that I was ultimately forced to eat lots of crow stew around this time last year!

http://forum.arctic-sea-ice.net/index.php/topic,778.msg21702.html#msg21702
"The most revolutionary thing one can do always is to proclaim loudly what is happening" - Rosa Luxemburg

Shared Humanity

  • Guest
Re: 2015 sea ice area and extent data
« Reply #115 on: March 06, 2015, 02:11:45 PM »
In terms of the minimum this is the only graph that matters in the short term IMHO. The number of days over 271 Kelvin North of 80 North gives pretty good prediction. Last two years despite high temps in winter short cold high Arctic summer led to increases in ice volume despite fragile state of Arctic. I think we've had a couple of freak years weather wise and if we're above 271 much earlier than day 150 this year it will be interesting. If 2015 is repeat of 2013 & 2014 the possibility of an unknown negative feedback loop becomes stronger.


http://ocean.dmi.dk/arctic/meant80n.uk.php

I would not be surprised if this pattern of warmer Arctic winters and cooler Arctic summers persist and I think that both are related to the same shifts in climate we are seeing. We are having more and more frequent incursions of mid latitude systems into the polar north. In the winter this brings warmth and moisture. In the summer, we are seeing dramatically increasing moisture and cloud cover which reduces the impact of the sun on ice  melt.

viddaloo

  • Nilas ice
  • Posts: 1302
  • Hardanger Sometimes
    • View Profile
  • Liked: 1
  • Likes Given: 0
Re: 2015 sea ice area and extent data
« Reply #116 on: March 06, 2015, 02:25:18 PM »
Average JAXA Extent (2003-2014)
12-Apr      13,760,053
13-Apr      13,714,346
14-Apr    13,679,265      5 March 2015   13,664,797
15-Apr      13,638,698
16-Apr      13,593,635

It would appear that we are about 5 weeks ahead of where we should be!!

That truly is amazing, OldLeatherneck. Also, if you look more narrowly at the present champion 2012, we appear to be about 7 ½ weeks ahead (Apr 25 – 13560700 km2).
[]

Siffy

  • Frazil ice
  • Posts: 179
    • View Profile
  • Liked: 0
  • Likes Given: 0
Re: 2015 sea ice area and extent data
« Reply #117 on: March 06, 2015, 03:42:32 PM »
It would appear that we are about 5 weeks ahead of where we should be!!

Don't forget that I was ultimately forced to eat lots of crow stew around this time last year!

http://forum.arctic-sea-ice.net/index.php/topic,778.msg21702.html#msg21702

Well, I won't say it's impossible but I find it highly unlikely we will see a large enough upswing later to see a new maximum emerge.

oren

  • Moderator
  • First-year ice
  • Posts: 9817
    • View Profile
  • Liked: 3589
  • Likes Given: 3942
Re: 2015 sea ice area and extent data
« Reply #118 on: March 06, 2015, 04:04:26 PM »
The story goes beyond just the total extent number. Looking at the different regions, most of the missing extent is in Bering and Okhotsk, basically the Pacific is too warm for proper ice formation. This is a significant change from previous years, as far as I can tell by layman methods. What effect will this have on the rest of the ice pack?
As the Pacific area melts earlier in the season, this could simply mean less melt later, resulting in a normal melt year.
On the other hand, large quantities of warm water entering through Bering Strait could cause havoc for the rest of the pack, especially in the ESS which is a swing area between high melt and low melt years.
Any thoughts?

deep octopus

  • Grease ice
  • Posts: 559
    • View Profile
  • Liked: 6
  • Likes Given: 17
Re: 2015 sea ice area and extent data
« Reply #119 on: March 06, 2015, 04:15:41 PM »
Nearly 110,000 km2 loss on NSIDC extent overnight. Although we have seen this story before (as with last year) of a slow March start and a sudden surge to a new maximum later in the month, with each passing day, the chance for the Arctic to finish its freeze season in the best of conditions possible is escaping. From the AMSR2 graphics, the largest change I'm noticing this month is the retreat of ice in Barents, whereas Bering and Okhotsk are generally holding their ground for now. However, I think those fringe Pacific regions will not matter as much, as what little ice exists there will be the among the first to vanish anyway come April and May, particularly under a warm PDO regime where I suspect losses on the Pacific side will be more advanced, all things being equal, with the advection of warm water. Early losses in Barents is what I would find more disturbing. Seeing what the next few weeks bring us... We're already well below 2011 on NSIDC.

OldLeatherneck

  • Grease ice
  • Posts: 554
    • View Profile
  • Liked: 2
  • Likes Given: 0
Re: 2015 sea ice area and extent data
« Reply #120 on: March 06, 2015, 04:37:15 PM »
It would appear that we are about 5 weeks ahead of where we should be!!

Don't forget that I was ultimately forced to eat lots of crow stew around this time last year!

http://forum.arctic-sea-ice.net/index.php/topic,778.msg21702.html#msg21702

Jim,

I've eaten a lot of decaying crows in my lifetime.  However, knowing how fickle the Arctic can be I will only produce projections that go out 6-8 weeks in advance and I will not claim them to be robust scientific models,,,,just a toy I'll play with from time to time.
« Last Edit: March 06, 2015, 05:06:26 PM by OldLeatherneck »
"Share Your Knowledge.  It's a Way to Achieve Immortality."  ......the Dalai Lama

crandles

  • Young ice
  • Posts: 3379
    • View Profile
  • Liked: 239
  • Likes Given: 81
Re: 2015 sea ice area and extent data
« Reply #121 on: March 06, 2015, 05:00:08 PM »
Of last 27 years only one, 1997 gains enough to get NSIDC extent above 14.539 reached on 22 Feb. Following that year's movements would reach 14.58 still 90k below record low maximum of 14.67
« Last Edit: March 06, 2015, 05:16:36 PM by crandles »

jdallen

  • Young ice
  • Posts: 3412
    • View Profile
  • Liked: 651
  • Likes Given: 244
Re: 2015 sea ice area and extent data
« Reply #122 on: March 06, 2015, 05:49:14 PM »
Of last 27 years only one, 1997 gains enough to get NSIDC extent above 14.539 reached on 22 Feb. Following that year's movements would reach 14.58 still 90k below record low maximum of 14.67
The probability of us reaching 14, much less the old record, is decreasing rapidly. Meanwhile, the weather looks increasingly unfavorable.

Five weeks ahead sounds about right.  The key is timing; we are running into increasing insolation with that running start, which has the potential to massively increase heat uptake in the region regardless of cloud cover. Keep in mind we are looking at nearly a million KM2 where the albedo has been cut from about .85 down to about .15; that's a rather large shift in energy budget, even on the periphery.  Even with and utterly favorable year with only about 10 million KM2 of melt (in line with 13/14), we are still looking at a minimum well under last year, and possibly under 4 million KM2 extent at minimum.

To stay above that would require a two sigma shift in weather behavior against trend.  I don't see how that can happen. We could pray for another Pinatubo, I suppose....

Even an average year (~10.5 million km2 melt) takes us close to 2012 territory.

The clear danger is, we stand to be in "normal" minimum territory next summer by the middle of August, with five weeks of insolation left to drive the ice down further. I find the potential for that quite alarming.

Yes, we have all eaten crow, but again, I think last time, we were just looking at the ice, not the timing, nor the heat budget.  Things are rather different now.

That's what I think the five week running start portends....
This space for Rent.

Jim Pettit

  • Nilas ice
  • Posts: 1175
    • View Profile
  • Liked: 41
  • Likes Given: 11
Re: 2015 sea ice area and extent data
« Reply #123 on: March 07, 2015, 01:35:33 PM »
IJIS Extent:
13,660,208 km2 (06 March)
Down 281,852 km2 (2.02%) from 2015 maximum-to-date of 13,942,060 km2 on 15 February.
10,482,753 km2 above record minimum extent of 3,177,455 km2 (16 September 2012).
Down 4,589 km2 from previous day.
Down 175,350 km2 over past seven days (daily average: -25,050 km2).
Down 158,109 km2 for the month of March (daily average: -26,352 km2).
1,008,374 km2 below 2000s average for this date.
602,359 km2 below 2010s average for this date.
594,932 km2 below 2014 value for this date.
1,004,739 km2 below 2012 value for this date.
Lowest March to-date average.
Lowest value for the date.
11 days this year (16.92% year-to-date) have recorded the lowest daily extent.
11 days (16.92%) have recorded the second lowest.
17 days (26.15%) have recorded the third lowest.
39 days (60%) in total have been among the three lowest on record.


CT Area:
13,028,595 km2 (06 March [Day 0.1753])
Down 245,960 km2 (1.85%) from 2015 maximum-to-date of 13,274,555 km2 on 17 February [Day 0.1288].
10,794,586 km2 above record minimum area of 2,234,010 km2 (14 September 2012).
Down 62,573 km2 from previous day.
Down 63,911 km2 over past seven days (daily average: -9,130 km2).
Down 50,516 km2 for the month of March (daily average: -8,419 km2).
685,771 km2 below 2000s average for this date.
288,603 km2 below 2010s average for this date.
16,443 km2 above 2014 value for this date.
651,877 km2 below 2012 value for this date.
4th lowest March to-date average.
4th lowest value for the date.
0 days this year (0% year-to-date) have recorded the lowest daily area.
1 day (1.54%) has recorded the second lowest.
5 days (7.69%) have recorded the third lowest.
6 days in total (9.23%) have been among the lowest three on record.

« Last Edit: March 07, 2015, 05:47:28 PM by Jim Pettit »

crandles

  • Young ice
  • Posts: 3379
    • View Profile
  • Liked: 239
  • Likes Given: 81
Re: 2015 sea ice area and extent data
« Reply #124 on: March 07, 2015, 03:09:56 PM »

That's what I think the five week running start portends....

A five week running start as of now taking us just past day 100 where temperatures are 15C below freezing


is nowhere near the same as a 5 week running start as at day 140

Revillo

  • New ice
  • Posts: 27
    • View Profile
  • Liked: 1
  • Likes Given: 0
Re: 2015 sea ice area and extent data
« Reply #125 on: March 07, 2015, 04:13:25 PM »
Forgive me if I'm way off the mark, but I haven't seen this trend explicitly mentioned and I'm wondering if others think it holds any weight.

It would seem that there is a tight relationship between el niño events and arc sea ice extent response. The first year following an el niño, we tend to see very low winter maximums (2006, 2011), followed by a significant but unexceptional melt season. Two years after, we see an increase in maximum (2007, 2012) followed by a summer blowout with catastrophic melting. I'm guessing this would be due to predictable circulation of ocean currents transporting warm water from the Pacific into the Arctic.

While 2014 was not officially an el niño year, there was an enormous swath of positive temp anomalies throughout the Pacific that could very well lead to the same results with regards to the Arctic, and so I believe 2015 can be compared to the 2006 / 2011 seasons, and therefore I do not predict a  major blowout to come until next summer. 

Interestingly, the PDO activity happening now looks like a different beast than other recent el niños in that, while not exceptionally pronounced, is steadier and longer lasting. Others have suggested a phase change has occurred in the PDO towards sustained release of heat for the next decade or two.
If the heat keeps up, we could see seasons both with record low maximums and minimums starting as early as next year and continuing for quite some time...

seaicesailor

  • Guest
Re: 2015 sea ice area and extent data
« Reply #126 on: March 07, 2015, 04:22:32 PM »
Interesting. I wouldnt call 2011 melt season unexceptional though.

Wipneus

  • Citizen scientist
  • Young ice
  • Posts: 4220
    • View Profile
    • Arctische Pinguin
  • Liked: 1025
  • Likes Given: 0
Re: 2015 sea ice area and extent data
« Reply #127 on: March 07, 2015, 05:34:30 PM »
I was asked about my estimated CT area changes for the next few days. Here we go:

From area calculated from NSIDC sea ice concentration I expect the following changes of  CT-area:

Sun: -13k
Mon: +18k


viddaloo

  • Nilas ice
  • Posts: 1302
  • Hardanger Sometimes
    • View Profile
  • Liked: 1
  • Likes Given: 0
Re: 2015 sea ice area and extent data
« Reply #128 on: March 07, 2015, 05:43:54 PM »
Interesting. I wouldnt call 2011 melt season unexceptional though.

I may have to eat crow–tartar because of this early call:

2011 of course is tough competition — the toughest, in fact, in terms of average extent drop during the year — so it's really no surprise 2015 cannot keep up the fight.

but in any case, the gist of it was that 2011 loses more km² in annual average extent during the year than any other in the IJIS time series. 2011 was quite exceptional in that sense, and lost a lot of ice all through the year, preparing the ground for the 2012 record(s).

(I can hear crows now.)
[]

crandles

  • Young ice
  • Posts: 3379
    • View Profile
  • Liked: 239
  • Likes Given: 81
Re: 2015 sea ice area and extent data
« Reply #129 on: March 07, 2015, 05:46:02 PM »
I was asked about my estimated CT area changes for the next few days. Here we go:

From area calculated from NSIDC sea ice concentration I expect the following changes of  CT-area:

Sun: -13k
Mon: +18k

With those two taking us to 13.034, 27 out of 36 years movements fail to reach a new maximum above 13.275

jdallen

  • Young ice
  • Posts: 3412
    • View Profile
  • Liked: 651
  • Likes Given: 244
Re: 2015 sea ice area and extent data
« Reply #130 on: March 07, 2015, 06:19:04 PM »

That's what I think the five week running start portends....

A five week running start as of now taking us just past day 100 where temperatures are 15C below freezing


is nowhere near the same as a 5 week running start as at day 140
That's north of 80, yes? But yes, and I do not expect it to start melt *now*. Most of the extent loss is south of that, and unlike the CAB, is now starting to see sunlight. 

However, I *am* worried the five week lead now WILL translate into a five week running start at day 140.

As I see it, the problem now isn't one of melt starting early, but one of ice failing to freeze late.

I hope that clarifies my concern.
This space for Rent.

jdallen

  • Young ice
  • Posts: 3412
    • View Profile
  • Liked: 651
  • Likes Given: 244
Re: 2015 sea ice area and extent data
« Reply #131 on: March 07, 2015, 06:50:29 PM »
Interesting. I wouldnt call 2011 melt season unexceptional though.
Quite so; there was some debate that 2011 actually passed 2007 iirc.  That was proven not true, but definitely a serious melt.
This space for Rent.

OldLeatherneck

  • Grease ice
  • Posts: 554
    • View Profile
  • Liked: 2
  • Likes Given: 0
Re: 2015 sea ice area and extent data
« Reply #132 on: March 07, 2015, 08:31:16 PM »
How safe is the current 1M Km2lead over 2012??

Not as safe as many of us may think. I just posted the following on Neven's ASIB.  I'll have further comments following the quote.

Quote
"March MAX Madness"

I can appreciate Neven's reticence in calling the IJIS Extent maximum for 2015. Although many of us, me included, have gotten excited over being 1M Km2 below 2012 at this time, the big question remains as to whether that lead can be maintained until the end of April when insolation becomes a serious player.

While developing my homemade model of sea ice extent decline I've had a chance to seriously look at the detailed IJIS/JAXA data in past years performance. March is one month filled with surprises, with significant up/down fluctuations. This makes predicting the ice extent at the end of April about as foolish as predicting where a hurricane will strike the Atlantic coast the minute a tropical system leave the coast of Africa. Three recent years, 2010, 2012 and 2014 all had extent gains greater than 300K Km2 during the first half of March. In the the last half of March only 2010 had a net gain (139K Km2).

The next week or so will be very interesting to watch!!!

The one nice thing about being retired is that if at any point I am forced to eat crow stew, it won't affect my paycheck. I'll still dabble with projections and occasional prognostication, but I'll save that for the Forum discussions.

Here's my rationale for urging caution at this time.  I spent the most of my career designing experiments, conducting tests, collecting the data, reducing the data, analyzing the data, publishing and at times presenting the results.  To give you some indication of my age, I spent over a dozen years doing these things when all data was collected and plotted using a pencil and a piece of paper.  Imagine how thrilled I was when had access to a Compaq 286 desktop computer and the earliest versions of Lotus 1-2-3.  Now with our access to high speed computers and gigabytes of data automatically processed, we've somehow forgotten to look at what is happening to the raw data. I've had to learn, over the years, not to let my intuitive beforehand knowledge bias how I conduct a test and consequently present the results.

Now getting back the subject at hand.  How safe is the current IJIS Extent 1M Km2 over 2012.  It entirely dependent on what happens during the final weeks of March.  My simplistic  model still shows one scenario that allows 2015's  extent to approach 14M Km2 in late March followed by a gentle decline till ending April above 2012.  The problem with my modelling approach doesn't work well for months like March when the extent can rapidly fluctuate up or down in 100k increments.  If the extent can stay essentially flat-lined for the next two weeks there is a reasonable chance that extent will still be below 2012 at the end of April, however, may not be 1M lower.

Another thing to remember in  the competition to close any year below is how consistently dramatic the monthly losses were during 2012.  After big losses in early March and slightly below average losses in the  last half of march and the first half of April, 2012 went on a rampage.  I'm using semi-monthly bins of data to look at net gains/losses.  From the last half of April through the first half of September, 2012 had record losses 5 times by significant amounts and generally maintained above average losses during most of the other periods.

For the fans of American football, here are my analogies:

1.  A 1M lead in early March is the equivalent of getting a touchdown on the kick-off.....doesn't imply that you will win the game.
2.  A 1M lead in late April is the equivalent of a 2 touchdown lead in the  middle of the 2nd quarter.  You'd be crazy to get too comfrotable about winning.
3.  A 1M lead in mid June is the equivalent of a 3 touchdown lead at the beginning of the 2nd half.  It's getting more possible that you will win....however, it's not so sure that you can get a  second mortgage on your home just to place a large wager on the outcome!!

"Share Your Knowledge.  It's a Way to Achieve Immortality."  ......the Dalai Lama

jdallen

  • Young ice
  • Posts: 3412
    • View Profile
  • Liked: 651
  • Likes Given: 244
Re: 2015 sea ice area and extent data
« Reply #133 on: March 07, 2015, 09:00:45 PM »
How safe is the current 1M Km2lead over 2012??

Not as safe as many of us may think. I just posted the following on Neven's ASIB.

<snippage>

For the fans of American football, here are my analogies:

1.  A 1M lead in early March is the equivalent of getting a touchdown on the kick-off...
2.  A 1M lead in late April is the equivalent of a 2 touchdown lead ...
3.  A 1M lead in mid June is the equivalent of a 3 touchdown lead ...

Nice Analogy, OLN, and good leavening to our thinking.  I tinkered up numbers, and put together a graph with potential extent based on the current extent, modified by the average 2006-2014 day over day decline.  If born out, it would suggest about a 12-14 day lead in extent loss, once we get to day 140.

For additional contemplation, I found a little insolation calculator (specifically for determining possible utility for PV applications, but works..) and captured raw available KWH/day at specific latitudes over the season. 

The calculator is here: http://pveducation.org/pvcdrom/properties-of-sunlight/calculation-of-solar-insolation

Images below.

The two week shift could massively increase the energy picked up by the system, by way of reduced albedo.  Now, this will be mostly outside of the central basin - South of 80 - but in normal years, that extra ice would provide a buffer for conditions further north.  We may not have that this year, and by extension, much different and possibly much more unfavorable weather - e.g. more rainfall rather than snowfall over the pack.

More open water also means more heat in that water later in the season when the ice is mobile.  I'd look for anything exported to get more promptly reduced as a result.

[Edit: Michael Hauber correctly points out most of the additional open extent is in the Bering and Okhotsk; that reduces the potential effect on the central basin.  It would be far more worrisome were it on the Atlantic side - where 2015 still lags behind 2012.]
« Last Edit: March 07, 2015, 09:12:18 PM by jdallen »
This space for Rent.

viddaloo

  • Nilas ice
  • Posts: 1302
  • Hardanger Sometimes
    • View Profile
  • Liked: 1
  • Likes Given: 0
Re: 2015 sea ice area and extent data
« Reply #134 on: March 07, 2015, 09:58:13 PM »
From the last half of April through the first half of September, 2012 had record losses 5 times by significant amounts and generally maintained above average losses during most of the other periods.

For real, 2012 had a total number of 40 'centuries', ie >100,000 km²/day losses. One of them a 'double century', so you could arguably say it had 41. The interesting thing is that 2007 had 27 centuries, which is 2nd highest, and so for these two years, at least, there is a 100% inverse correlation between A) high number of centuries and B) low September minimum.

The other 'forgotten' 2015 fact when people are now virtually queuing up to say a million short is healthy for the pack, is that we had a century loss on Feb 17. Compared to 2007 & 2012 this is one century versus their zero. And although it says nothing about how many we'll have by the end of March, April etc, it is statistically a 'good' sign (if going low is good): 2007 had no century before June, and 2012 had its first on March 8th. If we can keep up with 2012 for the next couple of weeks, it will be very interesting to see, for instance whether a 2015 century number between 27 (2007) and 40 (2012) will land 2015 2nd lowest in September, or at least among the bottom 3.
[]

andy_t_roo

  • New ice
  • Posts: 61
    • View Profile
  • Liked: 1
  • Likes Given: 0
Re: 2015 sea ice area and extent data
« Reply #135 on: March 07, 2015, 11:18:38 PM »
The interesting thing is that 2007 had 27 centuries, which is 2nd highest, and so for these two years, at least, there is a 100% inverse correlation between A) high number of centuries and B) low September minimum.
100% (inverse) correlation implies that all of the change in one of the values predicts all of the change in the other. While correlated, the relationship between count of century drops and overall magnitude of minimum isn't close to '100% inverse'.

Do you know how well this relationship works if extended to the top 10 years in rank?
« Last Edit: March 08, 2015, 12:03:42 AM by andy_t_roo »

Jim Hunt

  • First-year ice
  • Posts: 6270
  • Don't Vote NatC or PopCon, Save Lives!
    • View Profile
    • The Arctic sea ice Great White Con
  • Liked: 894
  • Likes Given: 87
Re: 2015 sea ice area and extent data
« Reply #136 on: March 08, 2015, 12:02:59 AM »
From area calculated from NSIDC sea ice concentration I expect the following changes of  CT-area:

Sun: -13k
Mon: +18k

Which according to my spreadsheet means that CT area will join the ranks of metrics reading lowest for the date since records began.
"The most revolutionary thing one can do always is to proclaim loudly what is happening" - Rosa Luxemburg

viddaloo

  • Nilas ice
  • Posts: 1302
  • Hardanger Sometimes
    • View Profile
  • Liked: 1
  • Likes Given: 0
Re: 2015 sea ice area and extent data
« Reply #137 on: March 08, 2015, 12:13:10 AM »
Code: [Select]
Chart for most centuries:
#1: 2012 (40)
#2: 2007 (27)

Code: [Select]
Chart for lowest yearly minimum:
#1: 2012 (3177455 km²)
#2: 2007 (4065739 km²)

Get it? If you want to split hairs, try finding 3rd and 4th etc years that either fit or don't fit with this 'rule'.

My guess is that if we can get eg:
Code: [Select]
Chart for most centuries:
#1: 2012 (40)
#2: 2015 (32)
#3: 2007 (27)

then we'll also see:

Code: [Select]
Chart for lowest yearly minimum:
#1: 2012 (3177455 km²)
#2: 2015 (something km²)
#3: 2007 (4065739 km²)
[]

OldLeatherneck

  • Grease ice
  • Posts: 554
    • View Profile
  • Liked: 2
  • Likes Given: 0
Re: 2015 sea ice area and extent data
« Reply #138 on: March 08, 2015, 01:47:21 PM »
Those Pesky, Pesky Details in the Data

While we keep chattering about how unlikely the Feb 15th Max to be exceeded later this month, I decided to look for the Peak Gains between March 7th and March 31st.  When the largest gain in recent history was a gain of over 240K in 2014, I decided to look the details. Last year march 8th & 9th had massive losses which was then followed by a more massive gain of over 432K, peaking on March 20th.

The  remainder of March is bound to have some ups and downs.  If 2015 is going to have a repeat performance of last year, it needs to start soon because after the equinox gains are fewer and much smaller.


For the record, here are the only recent years that had gains over 100K between March 7th and March 31st:

Year       Peak Date   Max  Gain
2014       20-Mar           244,288   NOTE: march 9-20 Gain was over 432K
2003       21-Mar           193,833
2013       14-Mar           165,935
2006       10-Mar           138,986
2007       10-Mar           130,667
2004       10-Mar           101,243
"Share Your Knowledge.  It's a Way to Achieve Immortality."  ......the Dalai Lama

Jim Hunt

  • First-year ice
  • Posts: 6270
  • Don't Vote NatC or PopCon, Save Lives!
    • View Profile
    • The Arctic sea ice Great White Con
  • Liked: 894
  • Likes Given: 87
Re: 2015 sea ice area and extent data
« Reply #139 on: March 08, 2015, 02:33:24 PM »
I went surfing again yesterday. In not unrelated news this morning:

Arctic Sea Ice Area Lowest Ever (For the Date!)
"The most revolutionary thing one can do always is to proclaim loudly what is happening" - Rosa Luxemburg

DavidR

  • Grease ice
  • Posts: 740
    • View Profile
  • Liked: 36
  • Likes Given: 3
Re: 2015 sea ice area and extent data
« Reply #140 on: March 08, 2015, 03:16:11 PM »
I went surfing again yesterday. In not unrelated news this morning:

Arctic Sea Ice Area Lowest Ever (For the Date!)
Not an iceberg in sight! 
Toto, I've a feeling we're not in Kansas anymore

Jim Hunt

  • First-year ice
  • Posts: 6270
  • Don't Vote NatC or PopCon, Save Lives!
    • View Profile
    • The Arctic sea ice Great White Con
  • Liked: 894
  • Likes Given: 87
Re: 2015 sea ice area and extent data
« Reply #141 on: March 08, 2015, 03:37:58 PM »
I went surfing again yesterday. In not unrelated news this morning:

Arctic Sea Ice Area Lowest Ever (For the Date!)
Not an iceberg in sight!

Consequently I was "Toasty in Tiki"!

https://twitter.com/jim_hunt/status/574529991616131072

In not unrelated news, Wipneus' earlier prediction has indeed come to pass:

"The most revolutionary thing one can do always is to proclaim loudly what is happening" - Rosa Luxemburg

Jim Pettit

  • Nilas ice
  • Posts: 1175
    • View Profile
  • Liked: 41
  • Likes Given: 11
Re: 2015 sea ice area and extent data
« Reply #142 on: March 08, 2015, 04:26:59 PM »
From area calculated from NSIDC sea ice concentration I expect the following changes of  CT-area:

Sun: -13k
Mon: +18k

Which according to my spreadsheet means that CT area will join the ranks of metrics reading lowest for the date since records began.

Indeed:


CT Area:
13,008,040 km2 (07 March [Day 0.1781])
Down 266,515 km2 (2.01%) from 2015 maximum-to-date of 13,274,555 km2 on 17 February [Day 0.1288].
10,774,031 km2 above record minimum area of 2,234,010 km2 (14 September 2012).
Down 20,555 km2 from previous day.
Down 71,071 km2 over past seven days (daily average: -10,153 km2).
Down 71,071 km2 for the month of March (daily average: -10,153 km2).
710,697 km2 below 2000s average for this date.
346,627 km2 below 2010s average for this date.
49,641 km2 below 2014 value for this date.
657,078 km2 below 2012 value for this date.
4th lowest March to-date average.
Lowest value for the date.
1 day this year (1.52% year-to-date) has recorded the lowest daily area.
1 day (1.52%) has recorded the second lowest.
5 days (7.58%) have recorded the third lowest.
7 days in total (10.61%) have been among the lowest three on record.


BornFromTheVoid

  • Nilas ice
  • Posts: 1339
    • View Profile
  • Liked: 679
  • Likes Given: 299
Re: 2015 sea ice area and extent data
« Reply #143 on: March 08, 2015, 05:24:30 PM »
Update for the week to March 7th

The current 5 day mean is on 14,315,200km2 while the 1 day extent is at 14,256,200km2.
The daily anomaly (compared to 81-10) is at -1,134,130km2, an increase from -1,023,690km2 last week. The anomaly compared to the 07, 11 and 12 average is at -487,120km2, an increase from -215,650km2 last week. We're currently lowest on record, up from 2nd lowest last week.


The average daily change over the last 7 days was -15.3k/day, compared to the long term average of +0.4k/day, and the 07, 11 and 12 average of +20.6k/day.
The average long term change over the next week is +0.7k/day, with the 07, 11, and 12 average being -4.0k/day.


The change so far this March is the 7th most negative on record. To achieve the largest recorded monthly increase, a daily gain of over +22.3k/day is required, while the largest loss requires a loss of at least 25.0k/day and an average requires a loss of -3.6k/day.

I recently joined the twitter thing, where I post more analysis, pics and animations: @Icy_Samuel

Wipneus

  • Citizen scientist
  • Young ice
  • Posts: 4220
    • View Profile
    • Arctische Pinguin
  • Liked: 1025
  • Likes Given: 0
Re: 2015 sea ice area and extent data
« Reply #144 on: March 08, 2015, 05:54:33 PM »
From area calculated from NSIDC sea ice concentration I expect the following changes of  CT-area:

Mon: +18k
Tue: -82k

crandles

  • Young ice
  • Posts: 3379
    • View Profile
  • Liked: 239
  • Likes Given: 81
Re: 2015 sea ice area and extent data
« Reply #145 on: March 08, 2015, 06:09:37 PM »
From area calculated from NSIDC sea ice concentration I expect the following changes of  CT-area:

Mon: +18k
Tue: -82k

Taking us to in the region of 12.944 lower than last 24 or maybe only 23 days. 330k below peak so far.

31 of last 36 year's movements would not reach a new max.

crandles

  • Young ice
  • Posts: 3379
    • View Profile
  • Liked: 239
  • Likes Given: 81
Re: 2015 sea ice area and extent data
« Reply #146 on: March 09, 2015, 03:08:31 PM »
NSIDC extent 14.18379 lower than all dates in Feb and March so far!

Of last 27 year's movements, only 1 year 2014 results in a new peak at 14.617 which is still a record low.

26/27 is more than 95% but recent years might be more representative, or maybe for such a low point we should look at movements from low points? Therefore not quite ready to say 95% sure we are past peak for NSIDC extent.

95% sure of a record low maximum? Yes I think I will go with that.

Wipneus

  • Citizen scientist
  • Young ice
  • Posts: 4220
    • View Profile
    • Arctische Pinguin
  • Liked: 1025
  • Likes Given: 0
Re: 2015 sea ice area and extent data
« Reply #147 on: March 09, 2015, 04:01:17 PM »
From area calculated from NSIDC sea ice concentration I expect the following changes of  CT-area:

Tue: -82k
Wed: +7k

Jim Pettit

  • Nilas ice
  • Posts: 1175
    • View Profile
  • Liked: 41
  • Likes Given: 11
Re: 2015 sea ice area and extent data
« Reply #148 on: March 10, 2015, 11:59:53 AM »
IJIS Extent:
13,629,197 km2 (09 March)
Down 312,863 km2 (2.24%) from 2015 maximum-to-date of 13,942,060 km2 on 15 February.
(NOTE: 2014 increased 432k km2 between this date and its maximum.)
10,451,742 km2 above record minimum extent of 3,177,455 km2 (16 September 2012).
Down 20,672 km2 from previous day.
Down 168,952 km2 over past seven days (daily average: -24,136 km2).
Down 189,120 km2 for the month of March (daily average: -21,013 km2).
1,031,766 km2 below 2000s average for this date.
588,813 km2 below 2010s average for this date.
386,729 km2 below 2014 value for this date.
888,364 km2 below 2012 value for this date.
Lowest March to-date average.
Lowest value for the date.
14 days this year (20.59% year-to-date) have recorded the lowest daily extent.
11 days (16.18%) have recorded the second lowest.
17 days (25%) have recorded the third lowest.
42 days (61.76%) in total have been among the three lowest on record.


CT Area:
12,968,001 km2 (09 March [Day 0.1836])
Down 306,554 km2 (2.31%) from 2015 maximum-to-date of 13,274,555 km2 on 17 February [Day 0.1288].
(NOTE: 2014 increased 531k km2 between this date and its maximum.)
10,733,992 km2 above record minimum area of 2,234,010 km2 (14 September 2012).
Down 68,486 km2 from previous day.
Down 169,022 km2 over past seven days (daily average: -24,146 km2).
Down 111,110 km2 for the month of March (daily average: -12,346 km2).
745,241 km2 below 2000s average for this date.
377,680 km2 below 2010s average for this date.
11,345 km2 above 2014 value for this date.
641,418 km2 below 2012 value for this date.
4th lowest March to-date average.
2nd lowest value for the date.
2 days this year (2.94% year-to-date) have recorded the lowest daily area.
2 days (2.94%) have recorded the second lowest.
5 days (7.35%) have recorded the third lowest.
9 days in total (13.24%) have been among the lowest three on record.
« Last Edit: March 10, 2015, 12:27:39 PM by Jim Pettit »

iceman

  • Frazil ice
  • Posts: 285
    • View Profile
  • Liked: 7
  • Likes Given: 19
Re: 2015 sea ice area and extent data
« Reply #149 on: March 10, 2015, 03:25:29 PM »
  ....
26/27 is more than 95% but recent years might be more representative, or maybe for such a low point we should look at movements from low points? Therefore not quite ready to say 95% sure we are past peak for NSIDC extent.
  ....

Agreed that movements from low points (local minima) would have more predictive value.  I'd still place the odds of a later maximum at close to 50%.  That's not statistically based, though, just from eyeballing the forecasts for the coming week.