Support the Arctic Sea Ice Forum and Blog

Author Topic: Daily SMOS Ice Thickness available: season 2015/2016  (Read 72677 times)

Wipneus

  • Citizen scientist
  • Young ice
  • Posts: 4220
    • View Profile
    • Arctische Pinguin
  • Liked: 1025
  • Likes Given: 0
Re: Daily SMOS Ice Thickness available: season 2015/2016
« Reply #100 on: October 24, 2015, 12:49:30 PM »
And here are comparative images of the SMOS thickness of the last 6 years for the 22nd of Oktober.

The state of the icepack looks to me most similar to 2013 and 2014, but less ice in the Beafort/Chukchi/ESS region, the Kara Sea and the northern part of the CAA.

(click for a larger image)

Neven

  • Administrator
  • First-year ice
  • Posts: 9517
    • View Profile
    • Arctic Sea Ice Blog
  • Liked: 1337
  • Likes Given: 618
Re: Daily SMOS Ice Thickness available: season 2015/2016
« Reply #101 on: October 24, 2015, 05:43:58 PM »
Great stuff, thanks a lot, Wip. Looking forward to your updates.
The enemy is within
Don't confuse me with him

E. Smith

seaicesailor

  • Guest
Re: Daily SMOS Ice Thickness available: season 2015/2016
« Reply #102 on: October 24, 2015, 07:40:26 PM »
Yes it is, thank you. This thickness is directly inferred from measurements, so it is very valuable.

Intriguing that from the movie it seems that much --if not most-- of the Central Arctic ice that was already there on Oct 1 has seen increased its thickness by 20-40 cm, ...in 20 days of October? Reviewing buoy data here
http://imb.erdc.dren.mil/buoysum.htm

that rate of increase is not observed until Nov or even December, typically.

Anyway, eventually CMOS is even able to estimate thickness of snow alone and discern it from ice thickness.

seaicesailor

  • Guest
Re: Daily SMOS Ice Thickness available: season 2015/2016
« Reply #103 on: November 08, 2015, 02:12:29 PM »

Interesting comments about SMOS thickness here
http://nsidc.org/arcticseaicenews/


Neven

  • Administrator
  • First-year ice
  • Posts: 9517
    • View Profile
    • Arctic Sea Ice Blog
  • Liked: 1337
  • Likes Given: 618
Re: Daily SMOS Ice Thickness available: season 2015/2016
« Reply #104 on: April 09, 2016, 11:00:47 PM »
I noticed the SMOS thickness distribution map today and saw some irregularities in the Beaufort and Chukchi. CryoSat also shows patches of <1m ice in those regions, but much smaller. Is SMOS in error because the freezing season is over?
The enemy is within
Don't confuse me with him

E. Smith

seaicesailor

  • Guest
Re: Daily SMOS Ice Thickness available: season 2015/2016
« Reply #105 on: April 13, 2016, 03:27:09 PM »
I noticed the SMOS thickness distribution map today and saw some irregularities in the Beaufort and Chukchi. CryoSat also shows patches of <1m ice in those regions, but much smaller. Is SMOS in error because the freezing season is over?

I find in these IR images (april 1 and 12) that these patches may coincide with a "cold" (blue) region which is quite strange (I admit not to understand these IR images well).

Can it be snow cover insulating the not-so-thick ice, and fooling SMOS?
The gif needs a click.


Peter Ellis

  • Grease ice
  • Posts: 619
    • View Profile
  • Liked: 33
  • Likes Given: 14
Re: Daily SMOS Ice Thickness available: season 2015/2016
« Reply #106 on: April 13, 2016, 04:59:45 PM »
I think it's scattered older ice.  I've noticed on the NIPR thickness product that the old ice advected into the Beaufort sometimes seems to show up as thinner than the surrounding ice.  No idea why, I presume the surface characteristics affect the microwave emissivity.  Maybe something analogous affects the Cryosat radar (e.g. older ice being rougher and causing more problems in measuring the thickness?)

Neven

  • Administrator
  • First-year ice
  • Posts: 9517
    • View Profile
    • Arctic Sea Ice Blog
  • Liked: 1337
  • Likes Given: 618
Re: Daily SMOS Ice Thickness available: season 2015/2016
« Reply #107 on: April 13, 2016, 05:21:32 PM »
I ran into this SMOS map published by Uni Bremen (unfortunately no live image) in which the allegedly thinner zones are less pronounced:
The enemy is within
Don't confuse me with him

E. Smith

Lord M Vader

  • Nilas ice
  • Posts: 1406
    • View Profile
  • Liked: 60
  • Likes Given: 39
Re: Daily SMOS Ice Thickness available: season 2015/2016
« Reply #108 on: April 13, 2016, 06:39:26 PM »
Yes, it should be thick and old ice in Beaufort. Look at NSIDC pcture of the ice age from week 11!! It certainly coincides with the ice thickness map.

Andreas T

  • Nilas ice
  • Posts: 1149
    • View Profile
  • Liked: 18
  • Likes Given: 4
Re: Daily SMOS Ice Thickness available: season 2015/2016
« Reply #109 on: April 13, 2016, 07:25:35 PM »
Where do you find that ice age map? the link on the graph page seems to be broken.

crandles

  • Young ice
  • Posts: 3379
    • View Profile
  • Liked: 239
  • Likes Given: 81

seaicesailor

  • Guest
Re: Daily SMOS Ice Thickness available: season 2015/2016
« Reply #111 on: April 14, 2016, 12:48:09 AM »


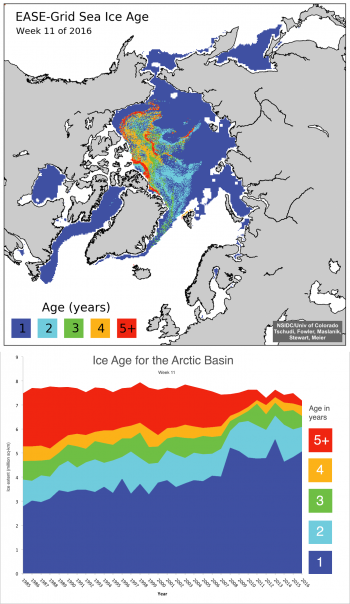
According to that map and current events, now in the Arctic there is creation of FYI in Beaufort, Chuckhi, and Laptev, and in turn a race toward Fram and Barents of second year ice, and melting of third year ice at Greenland Ice. Fifth year ice has reached the "killing fields" of Beaufort as C. Reynolds calls it. The ESS ice has been thickening by cold temperatures and accumulation toward the coast, seems well protected, but note it is FYI.
This is all short-term, but definitely MYI is not in good location to survive in case a very low extent is reached (it is not accumulated mostly North of CAA and Greenland)
« Last Edit: April 14, 2016, 12:55:18 AM by seaicesailor »

Andreas T

  • Nilas ice
  • Posts: 1149
    • View Profile
  • Liked: 18
  • Likes Given: 4
Re: Daily SMOS Ice Thickness available: season 2015/2016
« Reply #112 on: April 14, 2016, 09:12:07 AM »
I noticed the SMOS thickness distribution map today and saw some irregularities in the Beaufort and Chukchi. CryoSat also shows patches of <1m ice in those regions, but much smaller. Is SMOS in error because the freezing season is over?

I find in these IR images (april 1 and 12) that these patches may coincide with a "cold" (blue) region which is quite strange (I admit not to understand these IR images well).

Can it be snow cover insulating the not-so-thick ice, and fooling SMOS?
The gif needs a click.
The interpretation of these AMSR2 images is something I find difficult too and hope to learn more about.
 But I should point out that they are not IR images like the band 31 images of terra and aqua satellites. The come from a microwave sensor which picks up a longer  microwave radiation. Both band 31 (10 micrometer) and the 89GHz AMSR2 (340 micrometer) come from thermal emission from the surface (and clouds) which is why they are called brightness temperature. The difference is that the microwave emissivity of ice and water is different whereas the IR emissivity is much less different so microwave can distinguish ice from water. IR can only do that when the ice is colder than water and shows up by its colder surface.
edit: and the microwave is less affected by clouds so that there is visibility of ice through clouds but how the ice "looks" is modified by the clouds

seaice.de

  • Frazil ice
  • Posts: 130
    • View Profile
  • Liked: 86
  • Likes Given: 21
Re: Daily SMOS Ice Thickness available: season 2015/2016
« Reply #113 on: April 14, 2016, 02:12:06 PM »
I noticed the SMOS thickness distribution map today and saw some irregularities in the Beaufort and Chukchi. CryoSat also shows patches of <1m ice in those regions, but much smaller. Is SMOS in error because the freezing season is over?

Neven, mid to late April is already difficult for the SMOS sea ice thickness retrieval. We need cold temperatures and rely on the assumption of nearly 100% ice coverage. Thus, we can expect underestimation of the SMOS thickness when leads occur. This is not yet corrected for.

By the way, the most recent SMOS sea ice paper can be found here
http://seaice.de/Kaleschke_2016.pdf

Watch out for the upcoming SMOS/CryoSat2 product which will eliminate some of the difficulties
http://seaice.de/IGARSS_SMOS_Seaice_2015.pdf

Neven

  • Administrator
  • First-year ice
  • Posts: 9517
    • View Profile
    • Arctic Sea Ice Blog
  • Liked: 1337
  • Likes Given: 618
Re: Daily SMOS Ice Thickness available: season 2015/2016
« Reply #114 on: April 14, 2016, 03:20:28 PM »
I noticed the SMOS thickness distribution map today and saw some irregularities in the Beaufort and Chukchi. CryoSat also shows patches of <1m ice in those regions, but much smaller. Is SMOS in error because the freezing season is over?

Neven, mid to late April is already difficult for the SMOS sea ice thickness retrieval. We need cold temperatures and rely on the assumption of nearly 100% ice coverage. Thus, we can expect underestimation of the SMOS thickness when leads occur. This is not yet corrected for.

By the way, the most recent SMOS sea ice paper can be found here
http://seaice.de/Kaleschke_2016.pdf

Watch out for the upcoming SMOS/CryoSat2 product which will eliminate some of the difficulties
http://seaice.de/IGARSS_SMOS_Seaice_2015.pdf

Thanks for that. There will also be a presentation at EGU2016 coming Monday called Recent Improvements in the U.S. Navy’s Ice Modeling Using Merged CryoSat-2/SMOS Ice Thickness, which unfortunately I won't be able to attend (I'm going on Thursday when most of the Arctic sea ice-related stuff is happening).
The enemy is within
Don't confuse me with him

E. Smith

Lord M Vader

  • Nilas ice
  • Posts: 1406
    • View Profile
  • Liked: 60
  • Likes Given: 39
Re: Daily SMOS Ice Thickness available: season 2015/2016
« Reply #115 on: April 15, 2016, 10:36:07 PM »
If one is to believe in the DMI thickness/volume picture it seems quite likely that the volume have reached its annual maximum. From now and onwards we'll only see losses... Of course, there is a large uncertainity.

See and judge for yourself:

http://ocean.dmi.dk/arctic/icethickness/images/FullSize_CICE_combine_thick_SM_EN_20160414.png

DavidR

  • Grease ice
  • Posts: 740
    • View Profile
  • Liked: 36
  • Likes Given: 3
Re: Daily SMOS Ice Thickness available: season 2015/2016
« Reply #116 on: April 16, 2016, 01:01:32 AM »
If one is to believe in the DMI thickness/volume picture it seems quite likely that the volume have reached its annual maximum. From now and onwards we'll only see losses... Of course, there is a large uncertainity.

See and judge for yourself:

http://ocean.dmi.dk/arctic/icethickness/images/FullSize_CICE_combine_thick_SM_EN_20160414.png
The last reliable data we had put area and extent nearly 1 Mkm^2 lower than 2012 With volume now nearly equivalent  that suggests the current ice is about 8% thicker than 2012. I expect the increase in insolation on the open water, particularly as so much of the extra open water is in the Atlantic / Canadian area, will be sufficient to see us melt out to at least 2012 levels this year.

Toto, I've a feeling we're not in Kansas anymore

Juan C. García

  • Young ice
  • Posts: 3359
    • View Profile
  • Liked: 1279
  • Likes Given: 1127
Re: Daily SMOS Ice Thickness available: season 2015/2016
« Reply #117 on: April 16, 2016, 01:49:12 AM »

Interesting comments about SMOS thickness here
http://nsidc.org/arcticseaicenews/

Just to add the link with the month included:

http://nsidc.org/arcticseaicenews/2015/11/
Which is the best answer to Sep-2012 ASI lost (compared to 1979-2000)?
50% [NSIDC Extent] or
73% [PIOMAS Volume]

Volume is harder to measure than extent, but 3-dimensional space is real, 2D's hide ~50% thickness gone.
-> IPCC/NSIDC trends [based on extent] underestimate the real speed of ASI lost.