Support the Arctic Sea Ice Forum and Blog

Author Topic: Mysterious May–June Development  (Read 28612 times)

viddaloo

  • Nilas ice
  • Posts: 1302
  • Hardanger Sometimes
    • View Profile
  • Liked: 1
  • Likes Given: 0
Mysterious May–June Development
« on: August 29, 2014, 05:02:12 PM »
[Posted as comment earlier, but I want a dedicated discussion of this graph and the development it reveals.]

Another Google Graph. Shows May & June increasingly important for the total melt, overtaking August & July, respectively.

Interpretation: While we see other months also increasing due to the overall increase in meltout, ie because of the melting effect of a warmer ocean, May and June increase way faster and in an accelerating manner. This may be due to the known feedback mechanisms that are most prevalent when the Sun is strongest/longest lasting (albedo, meltponds, methane heat trapping).

What are your explanations for this difference in the 2 pre–solstice months?

What are your explanations for this difference in the 2 pre–solstice months?

Very interesting graph (and question) indeed. My first thought is that an ever increasing factor of the ice still left to melt after solstice is "hard to melt ice" stacked up north of CAA. Perhaps it is further proof that there is an Gompertz tail in the making.

Thanks, Rubikscube. I think so, too [very interesting]. We also have to remember that the ocean is warmest after the Summer Solstice, so June melting more ice than July, and May melting more than August, gets even stranger that way.

I also find it hard to comprehend that July doesn't get as much Sun related warming as June, when Sun warming up to Solstice equals the cooling after Solstice (equivalent for May & August). Maybe the remaining ice is harder to melt, as you suggest? But with as much warmth from the Sun, and with a much warmer ocean, it seems mysterious. Anyone?

Applications for modelling & prediction, plus a new thought: What if based on this graph/data we can agree that May + June are melting at an (degree 3 or above) exponential rate, while the other melt months are still in the 2nd degree melt, due to different feedbacks or melt causes being at work? Wouldn't this mean that May + June account for nearly all of the exponential growth in melt rate we see during the latest melt seasons? And thus maybe we could make pretty accurate predictions for Ice Minimum based on May and/or June melt?
[]

crandles

  • Young ice
  • Posts: 3379
    • View Profile
  • Liked: 240
  • Likes Given: 81
Re: Mysterious May–June Development
« Reply #1 on: August 29, 2014, 06:36:54 PM »


My first thought is that an ever increasing factor of the ice still left to melt after solstice is "hard to melt ice" stacked up north of CAA. Perhaps it is further proof that there is an Gompertz tail in the making.

There are a few things all wrapped up in "still left to melt after solstice is "hard to melt ice" stacked up north of CAA."

1. Because earlier months are melting more ice, there is less ice area to work on.
2. MYI is less salty and harder to melt. Are we arriving at point where more MYI has to be melted earlier in the season?
3. Stacked up: is it denser due to crushing? Does this make it harder to melt per Kg or just harder to melt per volume?
4. The areas we melt out are generally areas that have net movement out particularly Trans-Arctic Drift. Perhaps that helps build larger areas of open water and hence albedo feedback? Whereas near CAA larger holes tend to get filled in by net ice movement towards CAA.

Are all of these involved? Are there other effects? Which are most important?

gideonlow

  • New ice
  • Posts: 33
  • Fast Data/Big Data Systems Architect
    • View Profile
    • Pivotal Initiative -- Next Generation Data Technology
  • Liked: 0
  • Likes Given: 1
Re: Mysterious May–June Development
« Reply #2 on: August 29, 2014, 07:30:24 PM »
I think that a regional break-down of the same graphs might be revealing.  How much of the increase in May/June melt is due to earlier melt-out of the more Southern regions like Hudson and Bering?  It seems to me that the drive towards an ice free arctic will soon be dominated by how the Arctic Basin (and perhaps northern CAA) melt plays-out—as we enter a state where all other regions melt-out completely (or close to it) every year.  Mixing together data for all the regions is probably mixing various (negative and positive) feedbacks that play-out quite differently in the different regions, with different latitudes, bathymetry, weather & current influences, etc.  Thus, mixing them all together (and trying to draw conclusions from this) just introduces confusion.

viddaloo

  • Nilas ice
  • Posts: 1302
  • Hardanger Sometimes
    • View Profile
  • Liked: 1
  • Likes Given: 0
Re: Mysterious May–June Development
« Reply #3 on: August 29, 2014, 08:46:37 PM »
For what it's worth, it seems fair to say that

  • inspiring new and probably revealing regional breakdowns of the rapidly increasing May & June melt share
  • inviting explanations that much of the increase in May/June melt is due to melt-outs further south
  • getting answers that July/August have less ice area to work on than May/June

is constructive work that enhances progression of the understanding of May/June melt in the Arctic area, and perhaps not as confusing as some may claim. In any case, I thank @crandles and @gideonlow for these excellent interpretations. The way I see this, as a total amateur, having just a brief summer job as a student of information and library sciences at the Norwegian Polar Institute in Oslo on my Arctic CV, the data for the whole Arctic area is a great place to find potentially interesting and enlightening trends and anomalies, that can then in turn be split up and scrutinised further by the real expert, on this board and beyond. If I can inspire you to look further into the regional volume data, and find great discoveries there, then nothing is better than that.

My working hypothesis would be that both of you are correct that «easy to melt» Southern areas contribute strongly to the exponential increase in the melt share for May/June, in turn making it harder for July/August to keep up, with a smaller melt area to work on further North, but that the May/June exponential trend in time will propagate further North due to the same logic, and because the Southern Arctic will melt out earlier in the season in a steadily warmer Arctic.
[]

viddaloo

  • Nilas ice
  • Posts: 1302
  • Hardanger Sometimes
    • View Profile
  • Liked: 1
  • Likes Given: 0
Re: Mysterious May–June Development
« Reply #4 on: August 29, 2014, 09:05:21 PM »
I have to add that according to this graph, a hypothetical total meltdown of all the sea ice in the Arctic in 2022 would have ~56% of the melt work done by May/June alone, whilst in the record year of 2012, these two months «only» took care of 46%. In other words, for the first time in modern history, more than half the melt work will likely be done Winter maximum volume will likely be melted away by May/June alone, already at the next Summer all time low.
« Last Edit: August 30, 2014, 07:56:44 PM by viddaloo »
[]

ChrisReynolds

  • Nilas ice
  • Posts: 1764
    • View Profile
    • Dosbat
  • Liked: 20
  • Likes Given: 9
Re: Mysterious May–June Development
« Reply #5 on: August 30, 2014, 08:03:36 AM »
I think that a regional break-down of the same graphs might be revealing.  How much of the increase in May/June melt is due to earlier melt-out of the more Southern regions like Hudson and Bering?  It seems to me that the drive towards an ice free arctic will soon be dominated by how the Arctic Basin (and perhaps northern CAA) melt plays-out—as we enter a state where all other regions melt-out completely (or close to it) every year.  Mixing together data for all the regions is probably mixing various (negative and positive) feedbacks that play-out quite differently in the different regions, with different latitudes, bathymetry, weather & current influences, etc.  Thus, mixing them all together (and trying to draw conclusions from this) just introduces confusion.

Done previously (Feb 2014).
http://dosbat.blogspot.co.uk/2014/02/the-piomas-spring-volume-loss.html

The biggest single factor is the Central Arctic, and this is due to thinner ice following the 2010 volume loss event.

viddaloo

  • Nilas ice
  • Posts: 1302
  • Hardanger Sometimes
    • View Profile
  • Liked: 1
  • Likes Given: 0
Re: Mysterious May–June Development
« Reply #6 on: August 30, 2014, 07:48:56 PM »
Done previously (Feb 2014).
http://dosbat.blogspot.co.uk/2014/02/the-piomas-spring-volume-loss.html

The biggest single factor is the Central Arctic, and this is due to thinner ice following the 2010 volume loss event.

Great work, ChrisReynolds!

So then it's fair to say that the accelerating May/June melt shown in my graph has already spread to the CAB? I'm still wondering why May/June shows accelerating melt, however, and not just steadily increasing melt, like July/August. What are the causes of that? What type of feedbacks are at work in May/June, but not in July/August?
[]

viddaloo

  • Nilas ice
  • Posts: 1302
  • Hardanger Sometimes
    • View Profile
  • Liked: 1
  • Likes Given: 0
Re: Mysterious May–June Development
« Reply #7 on: August 30, 2014, 08:33:49 PM »
Top post graph shows melt share of all the Winter Max ice. For share of actual melted ice that season, May/June has already passed 50%, since the 'regime change' in 2010:
[]

viddaloo

  • Nilas ice
  • Posts: 1302
  • Hardanger Sometimes
    • View Profile
  • Liked: 1
  • Likes Given: 0
Re: Mysterious May–June Development
« Reply #8 on: August 30, 2014, 09:04:27 PM »
Turns out the original post graph was actually hiding a real-world volume drop in both the July & August melts. This was surprising to me, at least:
[]

viddaloo

  • Nilas ice
  • Posts: 1302
  • Hardanger Sometimes
    • View Profile
  • Liked: 1
  • Likes Given: 0
Re: Mysterious May–June Development
« Reply #9 on: August 30, 2014, 11:24:31 PM »
So what does all this mean? The short answer to that would be more ice melts earlier. The current all–time low for Melt Halfway Day (MHD) is 176 in 2012. That's just 4 days later than the totally average for its time Quarter Melt Day (QMD) of 1986, which was 172. 172 = June 21st and 176 = June 25th. Assumed MHD for 2014 is 178, or June 27th, according to which the total melt of 2014 would be 7763 km³ * 2 = 15526 km³, leaving 7589 km³ at September minimum. And already in 2021 Summer Solstice will also be Melt Halfway Day.

The 2012 QMD was 157, or June 6th, same as 2010. Thus in just 24 to 26 years the Quarter Melt moved to half a month earlier.

I assume of course that the increased Spring melt at acceleratingly earlier dates is caused by a warmer ocean and atmosphere, but what I don't understand is why July of 2012 now melts almost a 1000 km³ less than July 1982, when there's still almost half the April ice volume left at the start of July. It's not like it's running out of ice to work on?

What's slowing down melt in July & August? Could it be smoke etc from the increase in Boreal forest fires? Another form of negative feedback? Without this slowdown, July/August of 2012 would have melted another 1200 km³, leaving the September minimum at about 2470 instead of 3673 km³.

My working hypothesis would be that positive feedbacks melt acceleratingly more km³ of ice every year in May/June, while this immense warming causes some negative feedbacks to kick in, that cause July/august to melt acceleratingly fewer km³ each year.
[]

crandles

  • Young ice
  • Posts: 3379
    • View Profile
  • Liked: 240
  • Likes Given: 81
Re: Mysterious May–June Development
« Reply #10 on: August 31, 2014, 12:29:26 AM »
S but what I don't understand is why July of 2012 now melts almost a 1000 km³ less than July 1982, when there's still almost half the April ice volume left at the start of July. It's not like it's running out of ice to work on?

Area available to work on seems a place to start.

Calculating 5 year averages for 1982-1986 and 2010 to 2014

I get the volume loss in July to have fallen from 6.5568 to 5.7844

The CT area available to work on day .5042 has fallen from 8.9054 to 6.7408

I don't really expect it to depend on area available as the melting is from the edges. If the shape is similar then the circumference would decline by roughly square root of area.

6.5568 *(6.7408/8.9054)^.5 = 5.705

For such a wild calculation with so many other factors probably involved, the difference between 5.705 and 5.7844 seems remarkably close to me.

So I should now do a five year average half way between and show it works nothing like that.

crandles

  • Young ice
  • Posts: 3379
    • View Profile
  • Liked: 240
  • Likes Given: 81
Re: Mysterious May–June Development
« Reply #11 on: August 31, 2014, 12:38:42 AM »
That is of course exactly what happened:

July volume decline for 1996-2000 was up from 6.56 to 6.70 while the area was down from 8.91 to 7.83.

viddaloo

  • Nilas ice
  • Posts: 1302
  • Hardanger Sometimes
    • View Profile
  • Liked: 1
  • Likes Given: 0
Re: Mysterious May–June Development
« Reply #12 on: August 31, 2014, 12:55:08 AM »
What I don't understand is why July of 2012 now melts almost a 1000 km³ less than July 1982, when there's still almost half the April ice volume left at the start of July. It's not like it's running out of ice to work on?

Area available to work on seems a place to start.

Yet remaining ice volume by July 1st was the highest since 2008, and still 2014 was able to set an all–time low record for July melt, even more extreme than the previous record holder for low July melt; 2012.

IJIS extent was 3rd lowest in 2014, BTW, after 2010 and 2012:

10326446 (Jun 30th) 2002
10141556 (Jun 30th) 2003
10218844 (Jun 30th) 2004
9699627 (Jun 30th) 2005
9343353 (Jun 30th) 2006
9469400 (Jun 30th) 2007
9792385 (Jun 30th) 2008
9851597 (Jun 30th) 2009
8885384 (Jun 30th) 2010
9092702 (Jun 30th) 2011
9039911 (Jun 30th) 2012
9612340 (Jun 30th) 2013
9057557 (Jun 30th) 2014
« Last Edit: August 31, 2014, 01:08:18 AM by viddaloo »
[]

jdallen

  • Young ice
  • Posts: 3440
    • View Profile
  • Liked: 698
  • Likes Given: 256
Re: Mysterious May–June Development
« Reply #13 on: August 31, 2014, 02:07:01 AM »
From elsewhere...

Record low July melt in 2014: Continuing a strong trend of acceleratingly decreased July melt, 2014 saw only 5067 km³ melt away during the warmest Summer month. This is the lowest July melt ever in the 1979–2014 PIOMAS data series for Arctic sea ice volume. Surprisingly, perhaps, the #2 lowest ever July melt was in 2012, at 5619 km³. Something is clearly stopping sea ice from melting in the warmest of the Summer months, when even the biggest meltdown year in modern history sees a (then) record low July melt.

Smoke from forest fires raging before Summer Solstice?

I'd assume increased cloudiness due to more available water vapor.  I'd also say less vigorous circulation has in net led to less export and less mixing of meltwater with warmer water at depth.  Less movement, less turbulence, less heat exchange.
This space for Rent.

viddaloo

  • Nilas ice
  • Posts: 1302
  • Hardanger Sometimes
    • View Profile
  • Liked: 1
  • Likes Given: 0
Re: Mysterious May–June Development
« Reply #14 on: August 31, 2014, 03:45:31 AM »
Assumed MHD for 2014 is 178, or June 27th, according to which the total melt of 2014 would be 7763 km³ * 2 = 15526 km³, leaving 7589 km³ at September minimum.

If my assumption for MHD 2014 is correct, then August will end at about 7840 km³, giving all of August 2014 a melt volume of 1735 km³, which — no surprises there — is also record low for August with a huge margin, and the very first August below 2000 km³. The previous (current) record holder is 2013 with only 2365 km³ melted.

So with two very convincing melt records set by 2014 only since Solstice, and along (or strengthening) the longtime trends for July & August, this year is actually very trendy indeed, although no new low for ice volume will be set in September.
[]

ChrisReynolds

  • Nilas ice
  • Posts: 1764
    • View Profile
    • Dosbat
  • Liked: 20
  • Likes Given: 9
Re: Mysterious May–June Development
« Reply #15 on: August 31, 2014, 10:49:19 AM »
Viddalo,

I have no hard answers, just some guesses.

The really big clue is this - PIOMAS anomalies show that in all the post 2007 years, but especially so after 2010 the spring volume loss expressed as an anomaly (1980 to 1999) undergoes an inflection around the solstice - I suspect that any coherent explanation must address this observation to be convincing.
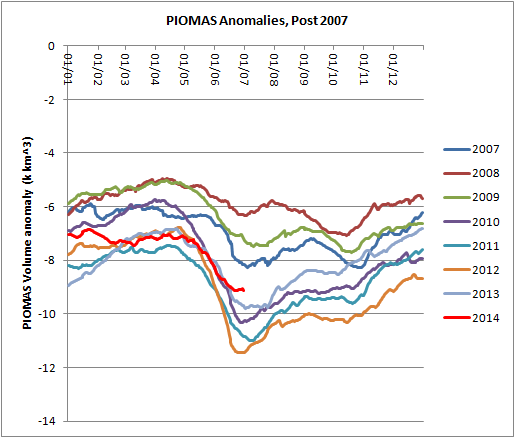


The other issue that graph raises is that whatever happens between May and the Solstice was made stronger by the 2010 volume loss event, but was already present. As those are anomalies it wasn't present in the 1980 to 1999 average, and visual inspection of graphs shows its regular appearance to be a new phenomenon.

Going back to 2010 and the Central Arctic...

I've re-jigged some code to convert volume as a function of grid box thickness, into area as a function of grid box thickness. So I can now work out PIOMAS sea ice area contributions from various grid box thicknesses. Note that the area is not directly comparable with other sea ice indices although it's fairly close.


So that is a plot showing what area each thickness band conributed to overall area each year in April. Note how the pack has undergone a general thinning. Note that 2010 saw a drop in ice over 3m thick (with a small recovery after) - this was due to the over winter export of a lot of multi year ice. But the effect it has on grid boxes reporting an April thickness 1 to 1.9m was to increase the area coverage of such grid boxes notably. Would we expect more thinning from thinner ice earlier in the season? I suspect so, but why? I must admit I can't put my finger on the physics of it.

Note that since 2007 there has been a net shift towards first year ice, that might explain the more muted spring melts and their attendant solstice inflections.

***

Stepping back for a better view of the long term trend, the way its working is that as ice from (for example) 3 to 3.9 declines it 'dumps' volume down into the next lowest thickness band. To show this long term behaviour I have taken a three year average of the data behind the above graph, then caculated as anomalies from the 1980 to 1999 average.
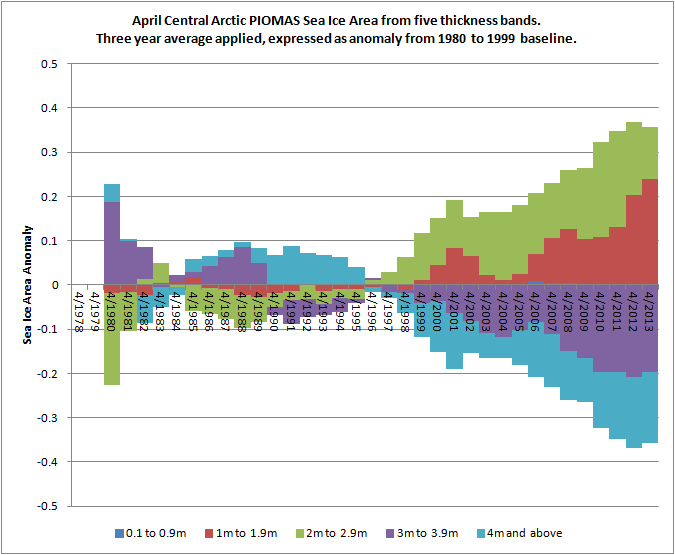


So as the ice area due to grid boxes over 3m has declined there has been a near identical increase in the area from grid boxes with an April thickness of 2.99m and below.

Not very informative, it's rather obvious,, but I liked the result graphically.

viddaloo

  • Nilas ice
  • Posts: 1302
  • Hardanger Sometimes
    • View Profile
  • Liked: 1
  • Likes Given: 0
Re: Mysterious May–June Development
« Reply #16 on: August 31, 2014, 06:44:04 PM »
Not very informative, it's rather obvious,, but I liked the result graphically.

Sweet! I'm already getting troves of ice knowledge from this thread, it's like opening the lid of Pandora's Box. I used the term 'trajectory' in my private notes for some reason, and then the computation of those 'trajectories' morphed into another way of predicting September minimum early on in the Melting Season, as if you throw a ball and ballistics determine how and where it lands.
[]

ChrisReynolds

  • Nilas ice
  • Posts: 1764
    • View Profile
    • Dosbat
  • Liked: 20
  • Likes Given: 9
Re: Mysterious May–June Development
« Reply #17 on: August 31, 2014, 09:23:54 PM »
Trajectory?

Stern et al is interesting on that.
http://www.agu.org/books/gm/v180/180gm12/180gm12.pdf
I really need to get to grips with principle components analysis.

As an aside: I've been playing around with an equation from Semtner's 1975 model of sea ice, easier to grasp than Maykut & Untersteiner. I've just hooked up:

Temperature difference across ice -> Heat flux through ice -> basal accretion at the ice ocean interface.

Using NCEP/NCAR temperatures for various years over the East Siberian Sea, monthly average surface temperature to set the surface temperature, ocean heat flux and snow omitted at this stage.

Results are graphed, red is the thickness calculated by the two equations, blue is average thickness for the East Siberian in PIOMAS, red is the model result. Not bad, I can even spot when I've made a mistake - not automated at this stage, e.g. have accdentally copied wrong year's temperature for PIOMAS thickness - gives visibly poor match.

However as 2014 shows some years give serious deviation - is this indicative of ice import into the ESS, or similar non thermodynamic issues?

viddaloo

  • Nilas ice
  • Posts: 1302
  • Hardanger Sometimes
    • View Profile
  • Liked: 1
  • Likes Given: 0
Re: Mysterious May–June Development
« Reply #18 on: September 01, 2014, 01:16:44 AM »
Trajectory?

We'll see how it plays out. I found a way. It most certainly will need tweaking and testing before any major announcement, but in the meantime: Can someone explain to me what I should call it, or what the difference is between a way, a method, a function and a 'model'? It's a tool, in any case. Consisting of a couple hundred lines of code.
[]

cesium62

  • Frazil ice
  • Posts: 330
    • View Profile
  • Liked: 33
  • Likes Given: 5
Re: Mysterious May–June Development
« Reply #19 on: September 01, 2014, 08:18:03 PM »
S but what I don't understand is why July of 2012 now melts almost a 1000 km³ less than July 1982, when there's still almost half the April ice volume left at the start of July. It's not like it's running out of ice to work on?

Area available to work on seems a place to start.

Calculating 5 year averages for 1982-1986 and 2010 to 2014

I get the volume loss in July to have fallen from 6.5568 to 5.7844

The CT area available to work on day .5042 has fallen from 8.9054 to 6.7408

I don't really expect it to depend on area available as the melting is from the edges. If the shape is similar then the circumference would decline by roughly square root of area.

6.5568 *(6.7408/8.9054)^.5 = 5.705

For such a wild calculation with so many other factors probably involved, the difference between 5.705 and 5.7844 seems remarkably close to me.

So I should now do a five year average half way between and show it works nothing like that.

Does melting really occur just at the edges?  Melting at just the edges seems to indicate that ocean temperatures are most important.  However, melt ponds seem to occur which would be indicative of surface melting.  We call 2014 "the year the ice melted in place"...

Early increases in melting leave more fresh water on the surface which may re-freeze more easily?

First year ice is saltier, so early may-june melting occurs, particularly on the surface, which washes salt out of the ice, leaving behind less salty, harder to melt ice... ?


viddaloo

  • Nilas ice
  • Posts: 1302
  • Hardanger Sometimes
    • View Profile
  • Liked: 1
  • Likes Given: 0
Re: Mysterious May–June Development
« Reply #20 on: September 01, 2014, 08:55:02 PM »
Trajectory?

May/June sets things in motion, or throws the ball. July/August is just air the ball travels through on its way to a September landing.

Seasonal changes in Earth's angle towards the Sun take the place of gravity, ensuring a safe landing = 0 melt.
[]

crandles

  • Young ice
  • Posts: 3379
    • View Profile
  • Liked: 240
  • Likes Given: 81
Re: Mysterious May–June Development
« Reply #21 on: September 02, 2014, 12:00:16 AM »
Does melting really occur just at the edges?  Melting at just the edges seems to indicate that ocean temperatures are most important.  However, melt ponds seem to occur which would be indicative of surface melting.  We call 2014 "the year the ice melted in place"...

Early increases in melting leave more fresh water on the surface which may re-freeze more easily?

First year ice is saltier, so early may-june melting occurs, particularly on the surface, which washes salt out of the ice, leaving behind less salty, harder to melt ice... ?

There is some melting in the middle, but it is nowhere near as much as at the edges. While a little of this might be due to less salty MYI, I think more important factors are that water outside the ice edge can gain more solar heat and wave action washing that warmer water onto the ice. At the centre of the pack, any waves are much smaller and thin layers of water can insulate the ice from warmer water.


viddaloo

  • Nilas ice
  • Posts: 1302
  • Hardanger Sometimes
    • View Profile
  • Liked: 1
  • Likes Given: 0
Re: Mysterious May–June Development
« Reply #22 on: September 02, 2014, 06:28:56 AM »
Back to the May/June Mystery: Even when there's a poor pre–iPhone age melt like in 2014, leaving more volume and more extent for July/August to work on than in many years, both July and August go ahead and set new all–time records for low melt. To me that indicates that the area of available ice to work on is not the central or only problem here.

To be a tad blunt: I think a fairly strong negative feedback mechanism is now at work after Solstice, a mechanism that is connected to the general warming of the climate– and ecosystems, for instance something to do with wildfires (smoke) or water vapour from the open seas.

This year was — to my knowledge — the worst year for Taiga forest fires in modern history, starting early in Spring in Alaska and Siberia, and ending up in Sala, Sweden with the biggest forest fire in the Nordic countries since modernity. In fact, forest fires here in Norway started as early as in late December, of last year! Due to there being no snow cover — at all — for the first time along most of the coastal and near–coastal inland areas of Norway.

One thing leads to another. But in this case, the forest fires may theoretically be good even for the icecaps. That is, the smoke may be good, if it blocks sunrays, yet the ash will be bad, if it increases albedo.

The «iPhone Gap»:
« Last Edit: September 02, 2014, 06:44:38 AM by viddaloo »
[]

ChrisReynolds

  • Nilas ice
  • Posts: 1764
    • View Profile
    • Dosbat
  • Liked: 20
  • Likes Given: 9
Re: Mysterious May–June Development
« Reply #23 on: September 02, 2014, 08:45:23 PM »
I really doubt that a random (albeit frequent and increasing) process like forest fires can create such a regular pattern with an inflection around the solstice.

Water vapour? Well that should increase back radiation which would act against sea ice. Later in the season insolation is falling and increased clouds at high latitudes actually act against ice rather than protecting them by blocking directly incident insolation.

Then there is the clue of the step jump of spring volume loss after 2010, a volume loss event leading to thinning of the Central Arctic, and the Central Arctic's role in the spring volume loss.

Everything points to me to a process intrinsic to sea ice in the PIOMAS model. The reason to suspect it is happening in the real world is what has been happening to extent losses in June, see attachment.

viddaloo

  • Nilas ice
  • Posts: 1302
  • Hardanger Sometimes
    • View Profile
  • Liked: 1
  • Likes Given: 0
Re: Mysterious May–June Development
« Reply #24 on: September 04, 2014, 01:34:14 AM »
The reason to suspect it is happening in the real world is what has been happening to extent losses in June, see attachment.

That may be part of the answer, but it seems to me that the jul/aug melt is declining more rapidly than the June 30 extent. This leads me to suspect that the extent of ice to work on during summer is just one of the factors that contribute to the decline in the Summer melt volume.
[]

ChrisReynolds

  • Nilas ice
  • Posts: 1764
    • View Profile
    • Dosbat
  • Liked: 20
  • Likes Given: 9
Re: Mysterious May–June Development
« Reply #25 on: September 04, 2014, 09:13:15 PM »
I don't think the June Extent loss is an answer, all I think its behaviour does is support the idea of unusual spring volume loss happening in the Spring. The two could reasonably be linked through increasing open water formation efficiency feedback.

Sorry, I had a thought in my head that I'd addressed this matter of the late summer volume anomaly increase. I had, the post was in February of this year.
http://dosbat.blogspot.co.uk/2014/02/the-piomas-late-summer-anomaly-increase.html

It's too complex for me to give a second opinion on that conclusion, I'm very tired, so I can't say whether I still agree with that or need to re-visit it. At the time I found it persuasive, but that's no indicator of whether the reasoning is right.

viddaloo

  • Nilas ice
  • Posts: 1302
  • Hardanger Sometimes
    • View Profile
  • Liked: 1
  • Likes Given: 0
Re: Mysterious May–June Development
« Reply #26 on: September 04, 2014, 10:33:28 PM »
Thanks, Chris, I'll definitely read that. Comments later:

This graph is very illustrative, I think.


It shows how the July and August ice melts are almost 'insulted and envious' of the huge May & June melts, more or less going on strike, saying, hey, where's my ice? What happened to the ice we were supposed to melt? Until they figure out that one, I guess we'll just have to get used to much lower July/August melt volumes than in the previous century and even the 2000s.

BTW: I saw an attempt at an explanation for the big decline in July/August melt in another thread that was at least thought provoking:

viddaloo, isn't that what we would expect? If and when the Arctic is ice-free at the end of June, the melt in July and August will be zero.
It basically said that some year in the future, there will be no ice left at all to melt by July 1st. And that Jul/Aug these last years have somehow already started to 'prepare' for that future, by showing a steady decline in the melt volume. I found that strange/funny. In terms of graph continuity, it may make some sense, though: The decline already started will gradually end in zero, as some day June will melt all the ice.

However this works, we clearly see that May/June are doing a bigger and bigger part of the melt job as years go by. When we have the final 2014 minimum, I'll make a graph that compares their share in the 2010s to the share in the 2000s, 1990s and 1980s. That it will someday end in a 100% share for Spring is a no–brainer.
« Last Edit: September 05, 2014, 01:13:22 AM by viddaloo »
[]

viddaloo

  • Nilas ice
  • Posts: 1302
  • Hardanger Sometimes
    • View Profile
  • Liked: 1
  • Likes Given: 0
Re: Mysterious May–June Development
« Reply #27 on: September 05, 2014, 02:39:39 AM »
Oh well. Tomorrow's news today (not much melt left till minimum anyway).

Spring includes the part of April that comes after the Winter Maximum.
Summer/Autumn includes the part of September that comes before the Autumn Minimum.
[]

ChrisReynolds

  • Nilas ice
  • Posts: 1764
    • View Profile
    • Dosbat
  • Liked: 20
  • Likes Given: 9
Re: Mysterious May–June Development
« Reply #28 on: September 05, 2014, 06:51:03 PM »
Spring includes the part of April that comes after the Winter Maximum.
Summer/Autumn includes the part of September that comes before the Autumn Minimum.

So the break is around end june / early july.  Spring = Apr, May, June, Summer = Jul Aug Sept?

That is interesting.

I don't know if I have already mentioned but Crandles gave me a link to a presentation in which Ed Blanchard Wrigglesworth showed PIOMAS results where the April thickness had been thinned by 1 metre. The result was that almost all the ice melted out by end July leaving a small amount of the MYI off Canada as the only remaining ice. This seems to be the later outcome of the process we are seeing. I'll have to find that link again.

The idea that it's a progression towards melt being zero is what led me to try looking at scaling anomalies by the daily volume.


Doing that makes the late summer anomaly increase vanish, anomalies remain low and only increase sharply around the minimum towards a sharp zero crossing. So I think there is some truth in Pikaia's simple explanation, despite it being simple. (Simple explanations are so often the wrong ones that I tend to be suspicious of them until the numbers back them up - nothing personal Pikaia).

viddaloo

  • Nilas ice
  • Posts: 1302
  • Hardanger Sometimes
    • View Profile
  • Liked: 1
  • Likes Given: 0
Re: Mysterious May–June Development
« Reply #29 on: September 05, 2014, 07:14:04 PM »
So the break is around end june / early july.  Spring = Apr, May, June, Summer = Jul Aug Sept?

That's right, Chris. 'Summer' starts on July 1st. Another way of looking at this — another angle to the natural truth — is that both Spring and Summer/Autumn are rising in terms of meltout % of the Winter Maximum ice volume. Spring share rising much faster, though, but as the total % is rising by the year, there's still room for Summer/Autumn to rise minimally.
[]

crandles

  • Young ice
  • Posts: 3379
    • View Profile
  • Liked: 240
  • Likes Given: 81
Re: Mysterious May–June Development
« Reply #30 on: September 05, 2014, 08:11:24 PM »
I don't know if I have already mentioned but Crandles gave me a link to a presentation in which Ed Blanchard Wrigglesworth showed PIOMAS results where the April thickness had been thinned by 1 metre. The result was that almost all the ice melted out by end July leaving a small amount of the MYI off Canada as the only remaining ice. This seems to be the later outcome of the process we are seeing. I'll have to find that link again.

no problem:
http://www.arcus.org/sipn/meetings/workshops/april-2014
2014 Sea Ice Prediction Workshop Day 1 Morning 1
starts about 56.5mins into 1hour 13min video

viddaloo

  • Nilas ice
  • Posts: 1302
  • Hardanger Sometimes
    • View Profile
  • Liked: 1
  • Likes Given: 0
Re: Mysterious May–June Development
« Reply #31 on: September 05, 2014, 10:50:23 PM »
Thanks, crandles,

looking forward to watching it. BTW, that would make this direct link, right?: youtu.be/wLzGABwoNK4?t=56m30s
[]

crandles

  • Young ice
  • Posts: 3379
    • View Profile
  • Liked: 240
  • Likes Given: 81
Re: Mysterious May–June Development
« Reply #32 on: September 05, 2014, 10:55:51 PM »
Thanks, crandles,

looking forward to watching it. BTW, that would make this direct link, right?: youtu.be/wLzGABwoNK4?t=56m30s

Yes that is the direct link.

ChrisReynolds

  • Nilas ice
  • Posts: 1764
    • View Profile
    • Dosbat
  • Liked: 20
  • Likes Given: 9
Re: Mysterious May–June Development
« Reply #33 on: September 06, 2014, 08:55:49 AM »
Thanks Crandles.

crandles

  • Young ice
  • Posts: 3379
    • View Profile
  • Liked: 240
  • Likes Given: 81
Re: Mysterious May–June Development
« Reply #34 on: September 06, 2014, 02:01:01 PM »
1m thinning is a lot, if we are talking un-deformed FYI, circa 100 years' time. So I was a little surprised at the suggestion that it wasn't all that far off. Of course MYI has been thinning at a rapid rate but another 1m of thinning would reduce lots of it to less than FYI thermal equilibrium thickness which isn't really possible.

I don't think that what was shown is sustainable. If the small area of MYI was all that was left in July  the ice would be much more mobile and large areas of that ice would move with Beaufort Gyre. Those areas would then be FYI the following year and would be highly likely to melt out (assuming that at that time FYI TET would be quite thin and melt out easily). The atmosphere is also likely to change to be warmer near the remaining ice causing more melting of the remaining ice.

The differences between the models did seem interesting.


ChrisReynolds

  • Nilas ice
  • Posts: 1764
    • View Profile
    • Dosbat
  • Liked: 20
  • Likes Given: 9
Re: Mysterious May–June Development
« Reply #35 on: September 06, 2014, 06:12:38 PM »
1m thinning is a lot, if we are talking un-deformed FYI, circa 100 years' time. So I was a little surprised at the suggestion that it wasn't all that far off. Of course MYI has been thinning at a rapid rate but another 1m of thinning would reduce lots of it to less than FYI thermal equilibrium thickness which isn't really possible.

I don't think that what was shown is sustainable. If the small area of MYI was all that was left in July  the ice would be much more mobile and large areas of that ice would move with Beaufort Gyre. Those areas would then be FYI the following year and would be highly likely to melt out (assuming that at that time FYI TET would be quite thin and melt out easily). The atmosphere is also likely to change to be warmer near the remaining ice causing more melting of the remaining ice.

The differences between the models did seem interesting.

In a similar manner to Tietsche et al, a thinning of 1m due to some sort of exceptional weather would be followed by a rebound.

That isn't my point here though. I'm drawing similarity between the observed aggressive spring melt in PIOMAS and the extreme case provided in that video. I suspect that something about thinning causes more agressive spring volume loss. It may of course simply be more ice put into the state where a given spring/summer thinning leads to more open water, and in Spring we're seeing the early stages of the seasonal melt move earlier.

It' just occurred to me. The May drop in anomalies is harder to explain in terms of the ice edge, but I've never tried to use Area.h to determine what proportion of the spring volume loss is from the ice edge and what proportion from thinning within the pack where concentration is higher.

viddaloo

  • Nilas ice
  • Posts: 1302
  • Hardanger Sometimes
    • View Profile
  • Liked: 1
  • Likes Given: 0
Re: Mysterious May–June Development
« Reply #36 on: September 16, 2014, 12:38:40 PM »
Back on topic, if I could rephrase (I'll leave it as is, though), I'd probably call it a 'mysterious July–August development', as that is the strangest part, that even 2012 melted less km³ in July–August than, say, 1982.

When and if September 2014 strengthens the upward September trend (more melting), then the July–August decline will be even weirder, with increased melt going on in April, May, June and September, just not July & August, the warmest of all months.
[]

jdallen

  • Young ice
  • Posts: 3440
    • View Profile
  • Liked: 698
  • Likes Given: 256
Re: Mysterious May–June Development
« Reply #37 on: September 17, 2014, 12:08:10 AM »
Back on topic, if I could rephrase (I'll leave it as is, though), I'd probably call it a 'mysterious July–August development', as that is the strangest part, that even 2012 melted less km³ in July–August than, say, 1982.

When and if September 2014 strengthens the upward September trend (more melting), then the July–August decline will be even weirder, with increased melt going on in April, May, June and September, just not July & August, the warmest of all months.

I think a hint may be acquired by examining where surviving ice has concentrated over time.  We may be seeing the creation of a "bastion" where the surviving MYI is sufficiently isolated, heat is not effectively applied to it until late in the season.  By nature, the thinner peripheral ice goes first.  If MYI isn't knocked out of the bastion, it doesn't get blitzed.  A curious feedback, but with less active movement if ice, it makes sense dynamically, when you think about weather and insolation on the Canadian side of the CAB.
This space for Rent.

viddaloo

  • Nilas ice
  • Posts: 1302
  • Hardanger Sometimes
    • View Profile
  • Liked: 1
  • Likes Given: 0
Re: Mysterious May–June Development
« Reply #38 on: September 17, 2014, 01:26:00 AM »
Yup, kind of like a Norwegian mountain glacier, melting only in September and October.
[]

JMP

  • Frazil ice
  • Posts: 116
    • View Profile
  • Liked: 20
  • Likes Given: 63
Re: Mysterious May–June Development
« Reply #39 on: September 19, 2014, 07:13:40 PM »
Back on topic, if I could rephrase (I'll leave it as is, though), I'd probably call it a 'mysterious July–August development', as that is the strangest part, that even 2012 melted less km³ in July–August than, say, 1982.

When and if September 2014 strengthens the upward September trend (more melting), then the July–August decline will be even weirder, with increased melt going on in April, May, June and September, just not July & August, the warmest of all months.

I think a hint may be acquired by examining where surviving ice has concentrated over time.  We may be seeing the creation of a "bastion" where the surviving MYI is sufficiently isolated, heat is not effectively applied to it until late in the season.  By nature, the thinner peripheral ice goes first.  If MYI isn't knocked out of the bastion, it doesn't get blitzed.  A curious feedback, but with less active movement if ice, it makes sense dynamically, when you think about weather and insolation on the Canadian side of the CAB.

This makes sense to me.   You can't melt what isn't there. 

Bottom-melt becomes more significant late in the season too doesn't it?  Could that be a factor also? 

Too, wouldn't AGW be expected to increase top-melt at a greater pace than bottom-melt?
Hasn't the "bastion" had significantly less of an increase in exposure to heat late in the season from below than has occurred from above early in the season through insolation?   
 
Am I thinking of too obvious of an explanation?  (apologies  if this has already been discussed) 
« Last Edit: September 19, 2014, 07:34:25 PM by JMP »

jdallen

  • Young ice
  • Posts: 3440
    • View Profile
  • Liked: 698
  • Likes Given: 256
Re: Mysterious May–June Development
« Reply #40 on: September 19, 2014, 07:41:08 PM »
Back on topic, if I could rephrase (I'll leave it as is, though), I'd probably call it a 'mysterious July–August development', as that is the strangest part, that even 2012 melted less km³ in July–August than, say, 1982.

When and if September 2014 strengthens the upward September trend (more melting), then the July–August decline will be even weirder, with increased melt going on in April, May, June and September, just not July & August, the warmest of all months.

I think a hint may be acquired by examining where surviving ice has concentrated over time.  We may be seeing the creation of a "bastion" where the surviving MYI is sufficiently isolated, heat is not effectively applied to it until late in the season.  By nature, the thinner peripheral ice goes first.  If MYI isn't knocked out of the bastion, it doesn't get blitzed.  A curious feedback, but with less active movement if ice, it makes sense dynamically, when you think about weather and insolation on the Canadian side of the CAB.

This makes sense to me.   You can't melt what isn't there. 

Bottom-melt becomes more significant late in the season too doesn't it?  Could that be a factor also? 

Too, wouldn't AGW be expected to increase top-melt at a greater pace than bottom-melt?
Hasn't the "bastion" had significantly less of an increase in exposure to heat late in the season from below than has occurred from above early in the season through insolation?   
 
Am I thinking of too obvious of an explanation?  Now I'm a bit confused.

Top melt is hugely dependent on albedo.  The actual convective transfer of heat directly from atmosphere to ice is very small.  The lions share is provided directly by radiation.

For bottom melt similarly, the energy comes predominantly from captured insolation.  As a lot of that heat is trapped at depth - greater than ice thickness - more of the heat is taken up heating a greater mass of water rather than transferring to ice.  Further, the heat is isolated from ice by thermoclines and haloclines.

The transfer of that heat depends on circulation by such mechanisms as Ekman pumping. As I understand it,  This season has been notable for the degree to which that sort of circulation hasn't been happening.

So on summary, we saw high albedo over the ice (low May/June melt pond fraction, cloudiness) and low ice movement/compaction (limiting distribution of heat from the water column to ice).  In spite of that, for melt we've passed 2013 in both extent and area, and passed 2007 in volume.

Does this help?
This space for Rent.

viddaloo

  • Nilas ice
  • Posts: 1302
  • Hardanger Sometimes
    • View Profile
  • Liked: 1
  • Likes Given: 0
Re: Mysterious May–June Development
« Reply #41 on: September 19, 2014, 08:23:09 PM »
There's probably been a record volume of boreal forest fires this season, too, with the smoke often settling over the Arctic sea ice, reducing insolation mainly after Solstice. I would add that as an explanation for low July-August melt, together with the "less ice area to melt" thing.

Record wildfires makes for more ash in the ice, too, though, so melting conditions for April-May-June 2015 are looking very good indeed. Add El Nino and stir.

Edit: Almost forgot: My newest understanding of the low July-August melt is the high level of methane Greenhouse trapping of heat in the Spring (Apr-Jun) because of low OH, with OH levels increasing to deplete methane levels during Summer (Jul-Aug). Does that make sense to you?
« Last Edit: September 19, 2014, 08:33:49 PM by viddaloo »
[]