Support the Arctic Sea Ice Forum and Blog

Author Topic: 2015 sea ice area and extent data  (Read 704421 times)

LRC1962

  • Frazil ice
  • Posts: 447
    • View Profile
  • Liked: 11
  • Likes Given: 3
Re: 2015 sea ice area and extent data
« Reply #150 on: March 10, 2015, 03:51:30 PM »
Just because I like the cool graphics and do not know its dependability as far as its forcats are concerned.
http://earth.nullschool.net/#current/wind/surface/level/overlay=mean_sea_level_pressure/orthographic=230.93,90.22,651
The big low pressure system in the Barents fizzles out in a day or 2, but take a look at at the system south eastern Greenland and see what happens 3 days from now.
http://earth.nullschool.net/#current/wind/surface/level/overlay=mean_sea_level_pressure/orthographic=230.93,90.22,651
Doesn't last long but what kind of damage could that do to the faces of the glaciers in that area?
"All truth passes through three stages: First, it is ridiculed; Second,  it is violently opposed; and Third, it is accepted as self-evident."
       - Arthur Schopenhauer

BornFromTheVoid

  • Nilas ice
  • Posts: 1339
    • View Profile
  • Liked: 679
  • Likes Given: 299
Re: 2015 sea ice area and extent data
« Reply #151 on: March 10, 2015, 04:11:53 PM »
Latest NSIDC daily extent is the 3rd lowest value on record for March, and lowest for the date by 391k.

With the 5 day trailing average, we're lowest on record by 311k, and 1.24 million below the 81-10 average.
I recently joined the twitter thing, where I post more analysis, pics and animations: @Icy_Samuel

Wipneus

  • Citizen scientist
  • Young ice
  • Posts: 4220
    • View Profile
    • Arctische Pinguin
  • Liked: 1025
  • Likes Given: 0
Re: 2015 sea ice area and extent data
« Reply #152 on: March 10, 2015, 04:51:31 PM »
From area calculated from NSIDC sea ice concentration I expect the following changes of  CT-area:

Wed: +0k (was +7k, NSIDC did update the whole data set since 2015-01-01)
Thu: +18k

crandles

  • Young ice
  • Posts: 3379
    • View Profile
  • Liked: 239
  • Likes Given: 81
Re: 2015 sea ice area and extent data
« Reply #153 on: March 10, 2015, 05:20:28 PM »
From area calculated from NSIDC sea ice concentration I expect the following changes of  CT-area:

Wed: +0k (was +7k, NSIDC did update the whole data set since 2015-01-01)
Thu: +18k

Actually they have gone back to 1978!

deep octopus

  • Grease ice
  • Posts: 559
    • View Profile
  • Liked: 6
  • Likes Given: 17
Re: 2015 sea ice area and extent data
« Reply #154 on: March 10, 2015, 05:24:52 PM »
From area calculated from NSIDC sea ice concentration I expect the following changes of  CT-area:

Wed: +0k (was +7k, NSIDC did update the whole data set since 2015-01-01)
Thu: +18k

Actually they have gone back to 1978!

And replaced five decimal places with three. Huh.

Wipneus

  • Citizen scientist
  • Young ice
  • Posts: 4220
    • View Profile
    • Arctische Pinguin
  • Liked: 1025
  • Likes Given: 0
Re: 2015 sea ice area and extent data
« Reply #155 on: March 10, 2015, 06:01:50 PM »
The underlying sea ice concentration data was modified since 2008.

It is odd for NSIDC not to report such changes, last year the announced that the data for a single day in 1984 was changed. Maybe it is work in progress though.

BornFromTheVoid

  • Nilas ice
  • Posts: 1339
    • View Profile
  • Liked: 679
  • Likes Given: 299
Re: 2015 sea ice area and extent data
« Reply #156 on: March 10, 2015, 06:11:09 PM »
They did it 2 years ago too for the June data. I send them an email at the time, they said it was related to an updated land mask.
I recently joined the twitter thing, where I post more analysis, pics and animations: @Icy_Samuel

viddaloo

  • Nilas ice
  • Posts: 1302
  • Hardanger Sometimes
    • View Profile
  • Liked: 1
  • Likes Given: 0
Re: 2015 sea ice area and extent data
« Reply #157 on: March 10, 2015, 06:43:48 PM »
Reminds me of Winston's day–job in Orwell's most widely known novel.
[]

jdallen

  • Young ice
  • Posts: 3412
    • View Profile
  • Liked: 651
  • Likes Given: 244
Re: 2015 sea ice area and extent data
« Reply #158 on: March 10, 2015, 07:00:56 PM »
  ....
26/27 is more than 95% but recent years might be more representative, or maybe for such a low point we should look at movements from low points? Therefore not quite ready to say 95% sure we are past peak for NSIDC extent.
  ....

Agreed that movements from low points (local minima) would have more predictive value.  I'd still place the odds of a later maximum at close to 50%.  That's not statistically based, though, just from eyeballing the forecasts for the coming week.
I don't see it, Iceman.  I don't think the Arctic can dump the heat being shoved into it from the Atlantic side fast enough.  I don't think the cold snap in the Pacific side will be deep enough, especially with the water temps as high as they are.

The only thing that would give us a new maxima is weather that disperses the pack and reduces concentration.  Even then, it may not significantly increase area.  There's just too much d*mn heat, seems to me...
This space for Rent.

viddaloo

  • Nilas ice
  • Posts: 1302
  • Hardanger Sometimes
    • View Profile
  • Liked: 1
  • Likes Given: 0
Re: 2015 sea ice area and extent data
« Reply #159 on: March 10, 2015, 07:14:05 PM »
The only thing that would give us a new maxima is weather that disperses the pack and reduces concentration.  Even then, it may not significantly increase area.  There's just too much d*mn heat, seems to me...

Agree. I'm no expert, but there's a reason 2015 SIE has been down–down–down since Feb 15 and not going up for 22 days. This is no coincidence, and common sense tells me it has to do with heat. We had the record warm ocean and general surface year in 2014, remember? That's a lot of extra heat.
[]

Buddy

  • Young ice
  • Posts: 3379
  • Go DUCKS!!
    • View Profile
  • Liked: 49
  • Likes Given: 34
Re: 2015 sea ice area and extent data
« Reply #160 on: March 10, 2015, 08:05:54 PM »
What heat...::)

http://climatechangegraphs.blogspot.com/2013/02/sea-surface-temperature-anomaly.html

Oh.....THAT heat....

Too much heat in oceans.....and ice will be attacked from all sides come later this spring and through the summer.

It is so hard for "us humans" to wrap our heads around what is...and will be happening now and over the coming months and years.  All of it will be "off the charts" stuff:  Continued melting of the Arctic......continued and serious melting of Greenland....and the continued melting of Antarctica.

Pretty wild stuff ahead of us.....and meanwhile we have to convince a group of "stooges" (OK...we'll call them politicians) that the earth is just BEGINNING to heat up.

Amazing...... Truly f*****g amazing:)

FOX (RT) News....."The Trump Channel.....where truth and journalism are dead."

DavidR

  • Grease ice
  • Posts: 740
    • View Profile
  • Liked: 36
  • Likes Given: 3
Re: 2015 sea ice area and extent data
« Reply #161 on: March 10, 2015, 11:48:12 PM »
The only thing that would give us a new maxima is weather that disperses the pack and reduces concentration.  Even then, it may not significantly increase area.  There's just too much d*mn heat, seems to me...

Agree. I'm no expert, but there's a reason 2015 SIE has been down–down–down since Feb 15 and not going up for 22 days. This is no coincidence, and common sense tells me it has to do with heat. We had the record warm ocean and general surface year in 2014, remember? That's a lot of extra heat.

SIE and SIA have been consistently drifting lower since mid February.  In 2014,  SIE and SIA were consistently moving up until the sudden drop in early  March followed by a return to the trend a week later. In my  view that makes a new Max this year much more unlikely than just  looking at the actual jumps that  occurred in 2014.

According to NSIDC March 9th had the previous highest "lowest extent for the day". On most measures its now downhill to the minimum. Half of the drops, in the last 8  years, taken from the maximum, have the ice second lowest extent on record. All the drops take the ice into the bottom 5.   On those figures Old Leatherneck is giving away money on the blog.

Toto, I've a feeling we're not in Kansas anymore

OldLeatherneck

  • Grease ice
  • Posts: 554
    • View Profile
  • Liked: 2
  • Likes Given: 0
Re: 2015 sea ice area and extent data
« Reply #162 on: March 11, 2015, 01:45:40 AM »

<SNIP>
..........Half of the drops, in the last 8  years, taken from the maximum, have the ice second lowest extent on record. All the drops take the ice into the bottom 5.   On those figures Old Leatherneck is giving away money on the blog.

First of all, I wouldn't risk a thin dime on wagering the outcome of any thing the arctic.   Well, maybe a few pints of beer from time to time.  I was just having fun on the blog.  Although, I did indicate that intuitively I expect 2015, with reasonably good probability, to end up in the lowest 5 years on record.  Secondly, I won't be surprised if 2015 is in fierce competition with 2007, 2011 and 2012 when it comes to July/August and September.  But neither I, nor the the most brilliant meteorologists and climatologists in the world can say with  absolute certainty what the environmental conditions in the Arctic will be like, on a month-to-month basis from April through September.  All we know now is what the weather will probably be like for the next 7-10 days in various regions of the Arctic and the current state of of the ice in those same regions.

Let's wait on our levels of excitement until mid-May when insolation starts to peak for the year.  At that time a massive lead in both area and exent will open a great deal of open water for warming.

Meanwhile, the discussions are informative as well as fun........but can't be put in the bank.
"Share Your Knowledge.  It's a Way to Achieve Immortality."  ......the Dalai Lama

iceman

  • Frazil ice
  • Posts: 285
    • View Profile
  • Liked: 7
  • Likes Given: 19
Re: 2015 sea ice area and extent data
« Reply #163 on: March 11, 2015, 03:31:54 AM »
The only thing that would give us a new maxima is weather that disperses the pack and reduces concentration.  Even then, it may not significantly increase area.  There's just too much d*mn heat, seems to me...

Agree. I'm no expert, but there's a reason 2015 SIE has been down–down–down since Feb 15 and not going up for 22 days. This is no coincidence, and common sense tells me it has to do with heat. We had the record warm ocean and general surface year in 2014, remember? That's a lot of extra heat.

SIE and SIA have been consistently drifting lower since mid February.  In 2014,  SIE and SIA were consistently moving up until the sudden drop in early  March followed by a return to the trend a week later. In my  view that makes a new Max this year much more unlikely than just  looking at the actual jumps that  occurred in 2014.
  ....

All sound reasoning, but land temperatures matter too.  The disfigured jet stream has been pouring arctic air onto northeastern North America for most of the winter.  A big reservoir of cold there, which easterly winds will carry over the Baffin/Newfoundland this week.  Will the coming surge of ice formation be enough to tip the balance toward a later maximum?  Check back on 17th March.

epiphyte

  • Frazil ice
  • Posts: 387
    • View Profile
  • Liked: 22
  • Likes Given: 21
Re: 2015 sea ice area and extent data
« Reply #164 on: March 11, 2015, 06:58:15 AM »

All sound reasoning, but land temperatures matter too.  The disfigured jet stream has been pouring arctic air onto northeastern North America for most of the winter.  A big reservoir of cold there, which easterly winds will carry over the Baffin/Newfoundland this week.  Will the coming surge of ice formation be enough to tip the balance toward a later maximum?  Check back on 17th March.

Well here in Minneapolis it's been consistently much colder than the east coast all winter - but the High/Low temps have gone from 12/-2F six days ago, to 67/37F today... so maybe the cold reservoir isn't as deep as all that!

LRC1962

  • Frazil ice
  • Posts: 447
    • View Profile
  • Liked: 11
  • Likes Given: 3
Re: 2015 sea ice area and extent data
« Reply #165 on: March 11, 2015, 10:28:33 AM »

All sound reasoning, but land temperatures matter too.  The disfigured jet stream has been pouring arctic air onto northeastern North America for most of the winter.  A big reservoir of cold there, which easterly winds will carry over the Baffin/Newfoundland this week.  Will the coming surge of ice formation be enough to tip the balance toward a later maximum?  Check back on 17th March.
I would not call it a reservoir of cold. For one thing it is bringing the Arctic cold into closer contact with warm tropical air and the temps although cold by local present day standards is no where close to Arctic temps. Although that is not totally true as on several days the North Pole did register temps close to the temps seen in the Northern States.
"All truth passes through three stages: First, it is ridiculed; Second,  it is violently opposed; and Third, it is accepted as self-evident."
       - Arthur Schopenhauer

Rick Aster

  • New ice
  • Posts: 71
    • View Profile
  • Liked: 1
  • Likes Given: 1
Re: 2015 sea ice area and extent data
« Reply #166 on: March 11, 2015, 06:47:12 PM »
I don't think it's a very strong cold band in northeastern North America. If I'm reading the maps right, the cold air hasn't had much success in penetrating the unusually warm air over Hudson Bay.

Wipneus

  • Citizen scientist
  • Young ice
  • Posts: 4220
    • View Profile
    • Arctische Pinguin
  • Liked: 1025
  • Likes Given: 0
Re: 2015 sea ice area and extent data
« Reply #167 on: March 14, 2015, 06:06:21 PM »
From area calculated from NSIDC sea ice concentration I expect the following changes of  CT-area:

(reporting day, change [k], estimated value [M])

Sat       12.994736
Sun -19.6 12.975136
Mon +99.9 13.075036


Wipneus

  • Citizen scientist
  • Young ice
  • Posts: 4220
    • View Profile
    • Arctische Pinguin
  • Liked: 1025
  • Likes Given: 0
Re: 2015 sea ice area and extent data
« Reply #168 on: March 15, 2015, 08:14:44 AM »
An in-between update of the NSIDC data changed the number for expected CT area on Monday:

(reporting day, change [k], estimated value [M])
Sat       12.994736
Sun -19.6 12.975136
Mon +37.4 13.012536

BornFromTheVoid

  • Nilas ice
  • Posts: 1339
    • View Profile
  • Liked: 679
  • Likes Given: 299
Re: 2015 sea ice area and extent data
« Reply #169 on: March 15, 2015, 07:24:09 PM »
Update for the week to March 14th

The current 5 day mean is on 14,325,800km2 while the 1 day extent is at 14,325,000km2.
The daily anomaly (compared to 81-10) is at -1,172,160km2, an increase from -1,134,130km2 last week. The anomaly compared to the 07, 11 and 12 average is at -462,720km2, a decrease from -487,120km2 last week. We're currently lowest on record, same as last week.


The average daily change over the last 7 days was +3.5k/day, compared to the long term average of +0.7k/day, and the 07, 11 and 12 average of -4.0k/day.
The average long term change over the next week is -14.1k/day, with the 07, 11, and 12 average being -6.9k/day.


The change so far this March is the 7th most negative on record. To achieve the largest recorded monthly increase, a daily gain of over +34.6k/day is required, while the largest loss requires a loss of at least 35.5k/day and an average requires a loss of 3.9k/day.

I recently joined the twitter thing, where I post more analysis, pics and animations: @Icy_Samuel

OldLeatherneck

  • Grease ice
  • Posts: 554
    • View Profile
  • Liked: 2
  • Likes Given: 0
Re: 2015 sea ice area and extent data
« Reply #170 on: March 16, 2015, 01:05:01 PM »
"To Bounce or Not, This is the Question"

Or a better question might be:

Will the current February 15th Maximum stand?  Currently we are 217K Km2 below that level.  Based purely on statistics of previous years gains/losses in the  last 16 days of  March, it would seem likely that the current maximum is safe.  2010 is the only recent year to have a net gain in extent during this period and that gain was only 139K Km2.  However, it can be reasonably assumed that there will be some more upward bumps in the  next few weeks.  It remains to be seen whether these bumps are short lived or a steady succession of massive daily gains.

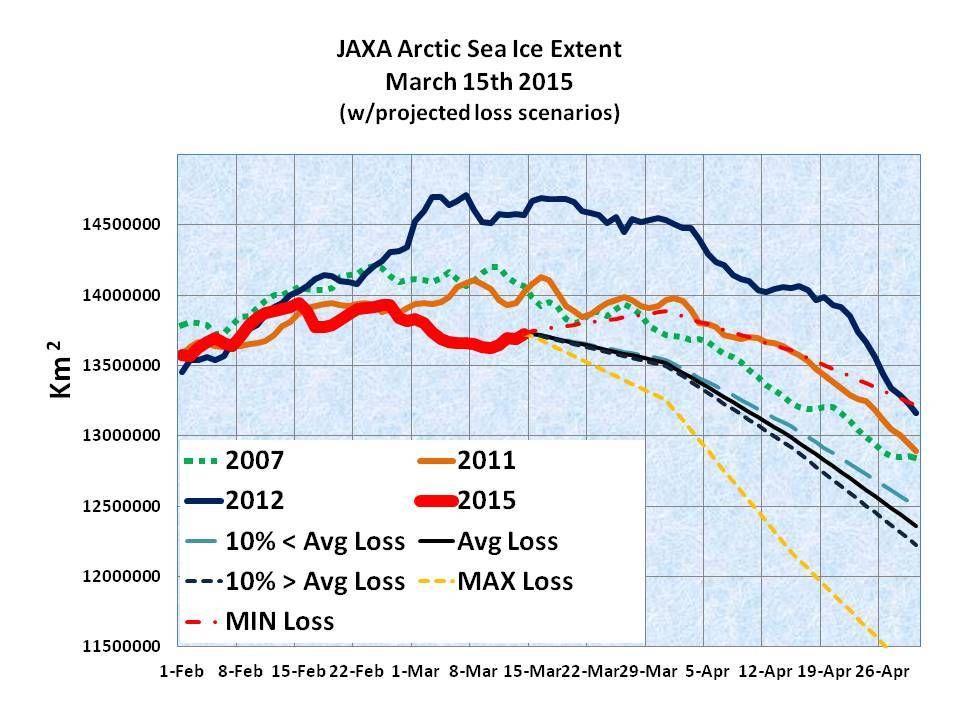
The chart below is a model that I have developed, using only the statistical data from 2003 to 2014, with the months from March 1st to September 15th broken into 15 or 16 day periods.  I'm plotting 5 projected scenarios from the current date.  The two extreme high/low projections use the record high and low losses for each period respectively.  The remaining three projections use average loss plus 10%, average loss and average loss minus 10%.  The tables below show the data I am using for the remainder of March and the entire month of April.

In no case am I trying to make any absolute predictions as to what will happen in the near future, only what kind of performance relative to previous years historical performance is required to keep 2015's Extent within the range of the previous record years of 2007, 2011 and 2012.

Neither am I using any current weather predictions, nor am I factoring in the current state if the ice in any of the Arctic regions.  I'll let people far smarter and more experienced than I am do that.

At best, my model is a "GUESStimator" rather than a scientific predictor.  However, I have learned a great deal in the process of developing this tool.

March 16-31      
 AVG Loss    206,478   
 MAX Loss    452,018          2014
 MAX Gain   139,124        2010 Note: only year with net gain

April 1-15      
 AVG Loss       526,335   
 MAX Loss    1,080,605    2004
 MIN Loss        278,712     2006

April 16-30      
 AVG Loss      631,407   
 MAX Loss      891,819         2012
 MIN Loss      389,601          2007


"Share Your Knowledge.  It's a Way to Achieve Immortality."  ......the Dalai Lama

Jim Pettit

  • Nilas ice
  • Posts: 1175
    • View Profile
  • Liked: 41
  • Likes Given: 11
Re: 2015 sea ice area and extent data
« Reply #171 on: March 16, 2015, 01:21:55 PM »
IJIS Extent:
13,724,438 km2 (15 March)
Down 217,622 km2 (1.56%) from 2015 maximum-to-date of 13,942,060 km2 on 15 February.
10,546,983 km2 above record minimum extent of 3,177,455 km2 (16 September 2012).
Up 38,151 km2 from previous day.
Up 74,569 km2 over past seven days (daily average: 10,653 km2).
Down 93,879 km2 for the month of March (daily average: -6,259 km2).
847,381 km2 below 2000s average for this date.
585,865 km2 below 2010s average for this date.
604,754 km2 below 2014 value for this date.
941,873 km2 below 2012 value for this date.
Lowest March to-date average.
Lowest value for the date.
20 days this year (27.03% year-to-date) have recorded the lowest daily extent.
11 days (14.86%) have recorded the second lowest.
17 days (22.97%) have recorded the third lowest.
48 days (64.86%) in total have been among the three lowest on record.


CT Area:
13,001,982 km2 (15 March [Day 0.2000])
Down 272,574 km2 (2.05%) from 2015 maximum-to-date of 13,274,555 km2 on 17 February [Day 0.1288].
10,767,972 km2 above record minimum area of 2,234,010 km2 (14 September 2012).
Up 26,192 km2 from previous day.
Down 34,506 km2 over past seven days (daily average: -4,929 km2).
Down 77,129 km2 for the month of March (daily average: -5,142 km2).
617,901 km2 below 2000s average for this date.
394,493 km2 below 2010s average for this date.
442,606 km2 below 2014 value for this date.
442,647 km2 below 2012 value for this date.
2nd lowest March to-date average.
Lowest value for the date.
4 days this year (5.41% year-to-date) have recorded the lowest daily area.
6 days (8.11%) have recorded the second lowest.
5 days (6.76%) have recorded the third lowest.
15 days in total (20.27%) have been among the lowest three on record.

Rubikscube

  • Frazil ice
  • Posts: 254
    • View Profile
  • Liked: 5
  • Likes Given: 4
Re: 2015 sea ice area and extent data
« Reply #172 on: March 16, 2015, 03:45:50 PM »
After a recent dip, the negative anomaly in the sea of Okhotsk is now below 0,5 million square km which means that the previous all time record anomaly in this region has been pulverized. It also appears that the winter max there is going to be lowest ever with a margin of more that 100 000 km^2.

crandles

  • Young ice
  • Posts: 3379
    • View Profile
  • Liked: 239
  • Likes Given: 81
Re: 2015 sea ice area and extent data
« Reply #173 on: March 16, 2015, 04:56:58 PM »


2007 anomaly plausible? error?

The record low maximum does appear smashed. Anomaly less clear whether second or first. Either is by large margin.

BornFromTheVoid

  • Nilas ice
  • Posts: 1339
    • View Profile
  • Liked: 679
  • Likes Given: 299
Re: 2015 sea ice area and extent data
« Reply #174 on: March 16, 2015, 05:00:05 PM »
Error, without a doubt.
I recently joined the twitter thing, where I post more analysis, pics and animations: @Icy_Samuel

Wipneus

  • Citizen scientist
  • Young ice
  • Posts: 4220
    • View Profile
    • Arctische Pinguin
  • Liked: 1025
  • Likes Given: 0
Re: 2015 sea ice area and extent data
« Reply #175 on: March 17, 2015, 04:32:22 PM »
Weird things are going on in the NSIDC sea ice concentration data. Extent has increased now for two days (+63k and +50k) but area has dropped in no small way. This will be seen in the ct-area numbers tomorrow and the day after, estimated by me as follows:


Mon       13.001982
Tue +6.0 13.007982
Wed -50.9 12.957082
Thu -122.8 12.834282


Epi-center seems to be Hudson Bay region:

Regional Arctic Sea Ice Extent and Area calculated from NSIDC NASA Team concentration data
Date: 2015-03-16 12:00  Values in 1000 km^2  Anomalies are from the 1981-2010 mean values

Extent (value, one day change, anomaly):
   Central Arctic Basin       East Siberian Sea              Laptev Sea
  4456.6   +2.0    +1.7    935.7   +0.0    +0.0    733.9   +0.0    -0.0
               Kara Sea             Barents Sea           Greenland Sea
   899.7   +0.0    +0.9    484.2  -13.8  -351.4    597.6  +20.0  -186.7
Baffin/Newfoundland Bay            St. Lawrence              Hudson Bay
  1556.2  +17.2  +169.4    287.7   +3.2   +71.5   1230.5   +0.0    -1.8
   Canadian Archipelago            Beaufort Sea             Chukchi Sea
   747.0   +0.0    +0.0    527.6   +0.0    +0.0    602.9   +0.0    +0.0
             Bering Sea          Sea of Okhotsk                   Lakes
   609.8  +17.4  -146.5    579.0   -3.4  -481.4    306.4  -27.0   +76.8
          Other regions       Total (ex. lakes)
    87.7  -20.2  -157.0  14336.0  +22.4 -1081.3

Area (value, one day change, anomaly):
   Central Arctic Basin       East Siberian Sea              Laptev Sea
  4327.6  -37.1   -37.8    931.8   +0.1   +14.2    701.3   -7.9    -9.8
               Kara Sea             Barents Sea           Greenland Sea
   772.6  -31.9   -78.6    280.7  -24.1  -352.8    437.4  +30.0  -128.1
Baffin/Newfoundland Bay            St. Lawrence              Hudson Bay
  1238.4  +35.7   +96.5    156.7  -12.1   +35.7   1057.0  -68.1  -106.8
   Canadian Archipelago            Beaufort Sea             Chukchi Sea
   703.2   -3.9    -9.5    516.5   -0.8    +6.5    577.1   +3.0    -3.6
             Bering Sea          Sea of Okhotsk                   Lakes
   412.6  +20.4  -111.4    395.8   -4.1  -353.3    216.9  -13.5   +68.8
          Other regions       Total (ex. lakes)
    27.1  -11.1  -104.0  12535.7 -111.7 -1142.7


BornFromTheVoid

  • Nilas ice
  • Posts: 1339
    • View Profile
  • Liked: 679
  • Likes Given: 299
Re: 2015 sea ice area and extent data
« Reply #176 on: March 17, 2015, 04:44:24 PM »
I wonder if that might be melt water on the ice, Wipneus? There was that warm spell that set record highs across much of the US, and some very positive anomalies across Hudson Bay in general the last few days.

I recently joined the twitter thing, where I post more analysis, pics and animations: @Icy_Samuel

jdallen

  • Young ice
  • Posts: 3412
    • View Profile
  • Liked: 651
  • Likes Given: 244
Re: 2015 sea ice area and extent data
« Reply #177 on: March 17, 2015, 05:00:56 PM »
I wonder if that might be melt water on the ice, Wipneus? There was that warm spell that set record highs across much of the US, and some very positive anomalies across Hudson Bay in general the last few days.
Significant anomalies, but oddly, temps are still well below freezing.
This space for Rent.

LRC1962

  • Frazil ice
  • Posts: 447
    • View Profile
  • Liked: 11
  • Likes Given: 3
Re: 2015 sea ice area and extent data
« Reply #178 on: March 17, 2015, 05:09:50 PM »
There was a small storm centred around Northern Hudson a few days ago. Could that have shaken things up enough to lower the area, but keep the extent up?
"All truth passes through three stages: First, it is ridiculed; Second,  it is violently opposed; and Third, it is accepted as self-evident."
       - Arthur Schopenhauer

Wipneus

  • Citizen scientist
  • Young ice
  • Posts: 4220
    • View Profile
    • Arctische Pinguin
  • Liked: 1025
  • Likes Given: 0
Re: 2015 sea ice area and extent data
« Reply #179 on: March 17, 2015, 06:38:57 PM »
I forgot to add that neither Jaxa (bootstrap algorithm) or Uni Hamburg (ASI algorithm) show anything strange in the Hudson.

 The Jaxa thickness/melting maps show some melting in the Hudson.

So all this points at wet ice or wet snow cover, something we normally see at an Arctic scale in June.


Nightvid Cole

  • Frazil ice
  • Posts: 438
    • View Profile
  • Liked: 6
  • Likes Given: 0
Re: 2015 sea ice area and extent data
« Reply #180 on: March 17, 2015, 07:28:19 PM »
Ok, so Okhotsk looks like it won't gain ice. Bering probably won't either - the forecast for (for example) McGrath, AK shows high temps rising above freezing in the coming days which will begin the snowmelt, thus reducing the ice albedo. Baffin/Labrador/St. Lawrence ice covers are already overextended, so little growth expected there either. Where does that leave us? We must have a MASSIVE cold snap in Barents/Kara, REAL SOON, in order to have any chance at threatening the "mad max" on 2/15.

Lord M Vader

  • Nilas ice
  • Posts: 1406
    • View Profile
  • Liked: 60
  • Likes Given: 39
Re: 2015 sea ice area and extent data
« Reply #181 on: March 17, 2015, 08:09:14 PM »
Your wish is coming true Mr cole! :P

A cold snap is on the way to Barents/Kara Sea during friday and seems to last for about up to 7 days. This should possibly be able to generate some new ice. If that will be enough to put Mad Max to an end, I don't know. OTOH, it seems like St. Lawrence and the southern part of Labrador Sea will be impacted by two strong cyclones. The question is how much damage they will do to the ice there.

Best, LMV

Jim Pettit

  • Nilas ice
  • Posts: 1175
    • View Profile
  • Liked: 41
  • Likes Given: 11
Re: 2015 sea ice area and extent data
« Reply #182 on: March 18, 2015, 12:04:14 PM »
IJIS Extent:
13,720,322 km2 (17 March)
Down 221,738 km2 (1.59%) from 2015 maximum-to-date of 13,942,060 km2 on 15 February.
10,542,867 km2 above record minimum extent of 3,177,455 km2 (16 September 2012).
Down 35,467 km2 from previous day.
Up 96,554 km2 over past seven days (daily average: 13,793 km2).
Down 97,995 km2 for the month of March (daily average: -5,764 km2).
815,562 km2 below 2000s average for this date.
610,406 km2 below 2010s average for this date.
698,872 km2 below 2014 value for this date.
960,614 km2 below 2012 value for this date.
Lowest March to-date average.
Lowest value for the date.
22 days this year (28.95% year-to-date) have recorded the lowest daily extent.
11 days (14.47%) have recorded the second lowest.
17 days (22.37%) have recorded the third lowest.
50 days (65.79%) in total have been among the three lowest on record.


CT Area:
12,971,601 km2 (17 March [Day 0.2054])
Down 302,955 km2 (2.28%) from 2015 maximum-to-date of 13,274,555 km2 on 17 February [Day 0.1288].
10,737,591 km2 above record minimum area of 2,234,010 km2 (14 September 2012).
Down 47,764 km2 from previous day.
Down 8,082 km2 over past seven days (daily average: -1,155 km2).
Down 107,511 km2 for the month of March (daily average: -6,324 km2).
650,471 km2 below 2000s average for this date.
401,583 km2 below 2010s average for this date.
430,720 km2 below 2014 value for this date.
589,372 km2 below 2012 value for this date.
2nd lowest March to-date average.
2nd lowest value for the date.
4 days this year (5.26% year-to-date) have recorded the lowest daily area.
7 days (9.21%) have recorded the second lowest.
6 days (7.89%) have recorded the third lowest.
17 days in total (22.37%) have been among the lowest three on record.
« Last Edit: March 18, 2015, 12:14:10 PM by Jim Pettit »

crandles

  • Young ice
  • Posts: 3379
    • View Profile
  • Liked: 239
  • Likes Given: 81
Re: 2015 sea ice area and extent data
« Reply #183 on: March 18, 2015, 03:38:25 PM »
NSIDC extent

2015,    03,  16,     14.428
2015,    03,  17,     14.298   

- Century break

- 297k below max of 14.595 on 22 Feb

- Movements of last 27 years don't get back up to 14.595

Enough to call the max as 22nd Feb? hmm very cold in Barents is forecast but relatively warm in other critical areas. Very close to callable but I am still not quite going to do so yet.

Wipneus

  • Citizen scientist
  • Young ice
  • Posts: 4220
    • View Profile
    • Arctische Pinguin
  • Liked: 1025
  • Likes Given: 0
Re: 2015 sea ice area and extent data
« Reply #184 on: March 18, 2015, 04:26:13 PM »
From area calculated from NSIDC sea ice concentration I expect the following changes of  CT-area:

Wed       12.971600
Thu -122.8 12.848800
Fri -90.2 12.758601


Feb max is 13.27456, more than half a million above this. The should be enough.

Siffy

  • Frazil ice
  • Posts: 179
    • View Profile
  • Liked: 0
  • Likes Given: 0
Re: 2015 sea ice area and extent data
« Reply #185 on: March 18, 2015, 04:28:49 PM »
From area calculated from NSIDC sea ice concentration I expect the following changes of  CT-area:

Wed       12.971600
Thu -122.8 12.848800
Fri -90.2 12.758601


Feb max is 13.27456, more than half a million above this. The should be enough.

Wow, where do those loses come from is it mostly the hudson?
« Last Edit: March 18, 2015, 05:14:46 PM by Siffy »

jdallen

  • Young ice
  • Posts: 3412
    • View Profile
  • Liked: 651
  • Likes Given: 244
Re: 2015 sea ice area and extent data
« Reply #186 on: March 18, 2015, 04:43:22 PM »
Dang!  Are we falling off a cliff?
This space for Rent.

Wipneus

  • Citizen scientist
  • Young ice
  • Posts: 4220
    • View Profile
    • Arctische Pinguin
  • Liked: 1025
  • Likes Given: 0
Re: 2015 sea ice area and extent data
« Reply #187 on: March 18, 2015, 06:49:59 PM »
Wow, where do those loses come from is it mostly the hudson?

Not today. Today it is Kara, Baffin Bay and for extent Barents, Okhotsk  and St. Lawrence regions.

Here is the regional summery for today:

Regional Arctic Sea Ice Extent and Area calculated from NSIDC NASA Team concentration data
Date: 2015-03-17 12:00  Values in 1000 km^2  Anomalies are from the 1981-2010 mean values

Extent (value, one day change, anomaly):
   Central Arctic Basin       East Siberian Sea              Laptev Sea
  4456.6   +0.0    +1.8    935.7   +0.0    +0.0    733.9   +0.0    -0.0
               Kara Sea             Barents Sea           Greenland Sea
   888.8  -10.8    -9.2    452.5  -31.7  -380.8    592.3   -6.0  -197.0
Baffin/Newfoundland Bay            St. Lawrence              Hudson Bay
  1543.0  -15.1  +160.2    265.8  -21.8   +60.3   1230.5   +0.0    +0.0
   Canadian Archipelago            Beaufort Sea             Chukchi Sea
   747.0   +0.0    +0.0    527.6   +0.0    +0.0    602.9   +0.0    +0.0
             Bering Sea          Sea of Okhotsk                   Lakes
   620.8  +10.5  -137.1    554.3  -24.7  -502.2    315.3   +8.8   +86.7
          Other regions       Total (ex. lakes)
   147.3  -28.7  -143.6  14299.0 -128.4 -1147.5

Area (value, one day change, anomaly):
   Central Arctic Basin       East Siberian Sea              Laptev Sea
  4326.9   -0.4   -39.3    930.3   -1.6   +13.4    691.4   -9.9   -19.9
               Kara Sea             Barents Sea           Greenland Sea
   739.4  -33.2  -112.8    273.4   -7.3  -358.8    440.6   +3.1  -128.8
Baffin/Newfoundland Bay            St. Lawrence              Hudson Bay
  1210.3  -29.2   +71.4    148.3   -8.4   +34.9   1069.4  +12.4   -93.1
   Canadian Archipelago            Beaufort Sea             Chukchi Sea
   703.7   +0.5    -9.7    510.9   -5.6    +0.2    577.8   +0.6    -2.9
             Bering Sea          Sea of Okhotsk                   Lakes
   432.9  +20.0   -91.1    391.1   -4.7  -352.8    205.5  -11.4   +58.1
          Other regions       Total (ex. lakes)
    43.4   -8.3  -101.2  12489.7  -72.0 -1190.4

jplotinus

  • Frazil ice
  • Posts: 128
    • View Profile
  • Liked: 12
  • Likes Given: 16
Re: 2015 sea ice area and extent data
« Reply #188 on: March 18, 2015, 07:26:16 PM »
Shout out to Viddaloo

Don't gloat. Anything can happen.  :P

viddaloo

  • Nilas ice
  • Posts: 1302
  • Hardanger Sometimes
    • View Profile
  • Liked: 1
  • Likes Given: 0
Re: 2015 sea ice area and extent data
« Reply #189 on: March 18, 2015, 08:43:36 PM »
What's a gloat?  ::)

Anyway, it seems a lot of people will be eating robin stew over the weekend. I'm hoping they're not extinct or anything in the areas where you guys live? If they are, pop me a PM and I'll send some birds along from Oslo through mail.
[]

ktonine

  • Frazil ice
  • Posts: 363
    • View Profile
  • Liked: 0
  • Likes Given: 0
Re: 2015 sea ice area and extent data
« Reply #190 on: March 18, 2015, 09:05:15 PM »
Robin stew?  What are you talking about - that will land you in jail here.  The robin is the state bird of Wisconsin and as such is protected :)

viddaloo

  • Nilas ice
  • Posts: 1302
  • Hardanger Sometimes
    • View Profile
  • Liked: 1
  • Likes Given: 0
Re: 2015 sea ice area and extent data
« Reply #191 on: March 18, 2015, 09:11:44 PM »
Robin stew?  What are you talking about - that will land you in jail here.  The robin is the state bird of Wisconsin and as such is protected :)

Guess y'all should have thought about that before, before qualifying to have one.
[]

Jim Pettit

  • Nilas ice
  • Posts: 1175
    • View Profile
  • Liked: 41
  • Likes Given: 11
Re: 2015 sea ice area and extent data
« Reply #192 on: March 18, 2015, 09:42:35 PM »
For the record--and please forgive the brief foray intro off-topic territory--"eating crow" is performed by those who predict something to happen that subsequently doesn't; those who out of an abundance of caution chose to make no prediction can happily enjoy a crow-free diet. Thus, if the mid-February maxima do turn out to be this year's icy pinnacles, only someone who claimed those would be definitely surpassed will have to feast on blackbird. And I don't know that anyone did that; I only saw a lot of people being careful.

(And FWIW, I'm still not convinced that either extent, area, or both won't reach new maximums before the melt-out gets underway.)

DavidR

  • Grease ice
  • Posts: 740
    • View Profile
  • Liked: 36
  • Likes Given: 3
Re: 2015 sea ice area and extent data
« Reply #193 on: March 18, 2015, 09:55:43 PM »
NSIDC extent

2015,    03,  16,     14.428
2015,    03,  17,     14.298   

- Century break

- 297k below max of 14.595 on 22 Feb

- Movements of last 27 years don't get back up to 14.595

Enough to call the max as 22nd Feb? hmm very cold in Barents is forecast but relatively warm in other critical areas. Very close to callable but I am still not quite going to do so yet.
If that figure holds for one day without bouncing back then I  think we can call the max. 

This is just a drop back towards the trend line.  The big late climbs in March all appear to  have occurred after a rapid drop below the trend for that  year.  2014 dropped 250K from trend just  before climbing 500K, 2010 dropped 120K from trend before climbing back 300K.   
Toto, I've a feeling we're not in Kansas anymore

jplotinus

  • Frazil ice
  • Posts: 128
    • View Profile
  • Liked: 12
  • Likes Given: 16
Re: 2015 sea ice area and extent data
« Reply #194 on: March 18, 2015, 10:09:17 PM »
The word gloat...

Espen

  • Young ice
  • Posts: 3722
    • View Profile
  • Liked: 421
  • Likes Given: 4
Re: 2015 sea ice area and extent data
« Reply #195 on: March 18, 2015, 10:11:39 PM »
For the record--and please forgive the brief foray intro off-topic territory--"eating crow" is performed by those who predict something to happen that subsequently doesn't; those who out of an abundance of caution chose to make no prediction can happily enjoy a crow-free diet. Thus, if the mid-February maxima do turn out to be this year's icy pinnacles, only someone who claimed those would be definitely surpassed will have to feast on blackbird. And I don't know that anyone did that; I only saw a lot of people being careful.

(And FWIW, I'm still not convinced that either extent, area, or both won't reach new maximums before the melt-out gets underway.)

I actually did so: https://forum.arctic-sea-ice.net/index.php/topic,230.msg46649.html#msg46649
Have a ice day!

viddaloo

  • Nilas ice
  • Posts: 1302
  • Hardanger Sometimes
    • View Profile
  • Liked: 1
  • Likes Given: 0
Re: 2015 sea ice area and extent data
« Reply #196 on: March 18, 2015, 10:20:56 PM »
Espen beat me to it. I waited the 'safe' 22 days before calling it here:

Today also marks the end of the 22–day wait for a new 2015 maximum extent — 22 being the 'safe' wait gleaned from the 2002—2014 IJIS extent time series. No year has ever come back with a higher maximum after 22 days of not beating the previous candidate. I therefore hereby call the 2015 maximum at 13,942,060 km² on Sunday February 15th. We won't see 13.94 million again before February or, perhaps, January 2016.
[]

crandles

  • Young ice
  • Posts: 3379
    • View Profile
  • Liked: 239
  • Likes Given: 81
Re: 2015 sea ice area and extent data
« Reply #197 on: March 19, 2015, 12:12:42 AM »
If Fri is anywhere near Fri  12.758 then that is 516k below the peak.

The largest rise from that date is 297k following 1992 movements. So there is an extra 200k safety margin over the highest rise of last 36 years. Cold Barents looks slightly concerning but 200k is 60% extra safety margin so I think that should be enough so subject to that 12.758 not being a long way too low, I will call the maximum area to have been that

2015.1288  13.2745552

Jim Pettit

  • Nilas ice
  • Posts: 1175
    • View Profile
  • Liked: 41
  • Likes Given: 11
Re: 2015 sea ice area and extent data
« Reply #198 on: March 19, 2015, 01:08:01 PM »
IJIS Extent:
13,708,005 km2 (18 March)
Down 234,055 km2 (1.68%) from 2015 maximum-to-date of 13,942,060 km2 on 15 February.
10,530,550 km2 above record minimum extent of 3,177,455 km2 (16 September 2012).
Down 12,317 km2 from previous day.
Up 59,725 km2 over past seven days (daily average: 8,532 km2).
Down 110,312 km2 for the month of March (daily average: -6,128 km2).
821,951 km2 below 2000s average for this date.
606,830 km2 below 2010s average for this date.
729,485 km2 below 2014 value for this date.
971,971 km2 below 2012 value for this date.
Lowest March to-date average.
Lowest value for the date.
23 days this year (29.87% year-to-date) have recorded the lowest daily extent.
11 days (14.29%) have recorded the second lowest.
17 days (22.08%) have recorded the third lowest.
51 days (66.23%) in total have been among the three lowest on record.


CT Area:
12,841,934 km2 (18 March [Day 0.2083])
Down 432,621 km2 (3.26%) from 2015 maximum-to-date of 13,274,555 km2 on 17 February [Day 0.1288].
10,607,925 km2 above record minimum area of 2,234,010 km2 (14 September 2012).
Down 129,666 km2 from previous day.
Down 142,476 km2 over past seven days (daily average: -20,354 km2).
Down 237,177 km2 for the month of March (daily average: -13,176 km2).
786,679 km2 below 2000s average for this date.
518,889 km2 below 2010s average for this date.
551,827 km2 below 2014 value for this date.
787,511 km2 below 2012 value for this date.
2nd lowest March to-date average.
Lowest value for the date.
5 days this year (6.49% year-to-date) have recorded the lowest daily area.
7 days (9.09%) have recorded the second lowest.
6 days (7.79%) have recorded the third lowest.
18 days in total (23.38%) have been among the lowest three on record.

Wipneus

  • Citizen scientist
  • Young ice
  • Posts: 4220
    • View Profile
    • Arctische Pinguin
  • Liked: 1025
  • Likes Given: 0
Re: 2015 sea ice area and extent data
« Reply #199 on: March 19, 2015, 06:15:26 PM »
From area calculated from NSIDC sea ice concentration I expect the following changes of  CT-area:


Thu       12.841934
Fri -90.2 12.751734
Sat +76.6 12.828334


So the nose dive will not continue for now.  Still 446k below the Feb max  ( 13.27456).