Support the Arctic Sea Ice Forum and Blog

Author Topic: The 2015 melting season  (Read 2331675 times)

seaicesailor

  • Guest
Re: The 2015 melting season
« Reply #1600 on: June 27, 2015, 11:58:18 PM »
Quote from: Neven

Yes, this is looking a lot like 2014, the year of in situ melting.


@ Nightvid, Neven comment reminded me that. Insitu (or local as you call it) melting is not all melting.

Nick_Naylor

  • Frazil ice
  • Posts: 291
    • View Profile
  • Liked: 0
  • Likes Given: 0
Re: The 2015 melting season
« Reply #1601 on: June 28, 2015, 12:10:39 AM »
I have noticed that the Arctic seems noticeably darker over the entire expanse than the last couple of years, so I thought I'd try to make that more obvious by doing the following:
- Take the seven day period of June 20-26 in each of the 2013, 2014 and 2015 seasons.
- Average the seven images from each year together to smooth out effect of weather.
- "Dark-blend" the seven images from each year to eliminate clouds as far as possible
- Boost the contrast identically for each year's image to make the differences easier to see.

Here's what the result looks like. 2015 is clearly less reflective than either of the last two years. This is confirmed by histogram analysis, which shows a significantly lower mode than 2013 or 2014.
I didn't do the same for 2012 because the original images for that year don't look like they were processed consistently.

I should explain what the darken blending mode in Photoshop does for those who might be unfamiliar with it. Suppose I have two similar images stacked on top of each other. Normally, the top layer would completely obscure the bottom layer. However, if I set the mode to "Darken", then each pixel in the visible image would reflect only the darker pixel from image A and image B, regardless of which is on top. So if image A and B were identical except for a cloud that has moved within the frame, the cloud would magically disappear. By the same token, if image A is white ice with the exception of a crack that has moved to a new location in image B, the crack would appear in both locations in the final image. So the "darken" mode exaggerates the degree of fragmentation of mobile ice under clear skies.

jdallen

  • Young ice
  • Posts: 3412
    • View Profile
  • Liked: 651
  • Likes Given: 244
Re: The 2015 melting season
« Reply #1602 on: June 28, 2015, 12:56:37 AM »
But this is not the case - the ice melts from the top surface and from the bottom surface. You can indeed have melting on the lateral surface of ice floes, but the lateral melting from the edges of the pack is not what gets you to the September minimum - simple back of the envelope calculations suggest that the melting from action at the edges of the ice pack is orders of magnitude too slow.
Lateral melt does not become a serious factor until the floe size drops below about 100M in diameter.
This space for Rent.

ChrisReynolds

  • Nilas ice
  • Posts: 1764
    • View Profile
    • Dosbat
  • Liked: 20
  • Likes Given: 9
Re: The 2015 melting season
« Reply #1603 on: June 28, 2015, 12:56:55 AM »
Sea Ice Sailor,

The melt front is very important, as is the estabishment of melt front. But in PIOMAS most of the volume loss comes from thinning away from the ice edge, not the retreat of the melt front (by virtue of the greater surface area away from the ice edge). The issue then becomes how quickly open water can be produced.

I don't know if you are aware of the PIOMAS -1m experiment.


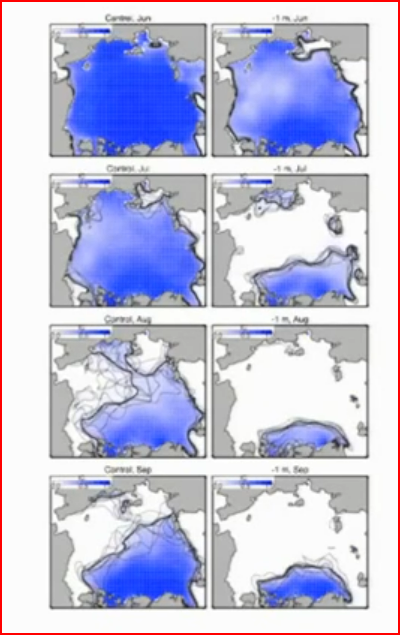
This was organised by Ed Blanchard Wrigglesworth for a SIPN webinar last year (or the year before?). In the first column are Jun/Jul/Aug/Sept PIOMAS average for recent years. In the second column is the progression with June starting as in recent years on the last day of May but with ice thinned across the pack by 1m from the first day of June.

What is striking is the fast retreat through June, such that the July average is so low. I could email Dr Zhang about this... I suspect that rather than a severely fragmented pack going rotten from the inside with large tracts of open water what would happen is a staggeringly fast recession of the ice edge.

Obviously the initial stage of loss associated with June thining would cause concentration to plummet as open water develops between floes. But my reasoning regards a rapid retreat of the ice edge is as follows:

Within the pack, with melting ice in close proximity, while open water between floes will lead to enhanced ice/ocean albedo feedback, the presence of melting ice will keep temperatures close to zero. As heat flux is proportional to temperature difference this will limit the flux of heat from ocean to ice.

Contrast this with the situation at the ice edge. Here, once a body of water has opened away from the ice, the only limit on ocean warming is deep conduction/mixing of heat with deeper sub surface waters (the latter from wind/wave action), and (mainly) evaporation to the air losing heat (also LW emission). So temperatures can climb well above freezing and the potential for heat conduction into ice at the ice edge is substantially increased. This means that the ice edge is subjected to a greater heat flux than dispersed floes behind the ice edge, hence it retreats fast.

These considerations would go some way towards explaining why the ice melts from an edge rather than just going patchy.


seaicesailor

  • Guest
Re: The 2015 melting season
« Reply #1604 on: June 28, 2015, 02:30:58 AM »
Chris,
Thank you very much, today I am learning more than one thing or two, definitely.

I am at a loss now. This thinning Arctic ocean-wide during June (which the Piomas monthly volume plot confirms somehow) now contradicts the conception I had that low extent is the main cause of low volume. The causality seems to go in the opposite direction.

To reply to you I need to understand the melting within the pack. For instance what is happening within those patches of broken ice North of New Siberian Islands and in Beaufort to prepare the further retreat of the ice edge. That prepares the final melting as much as melt ponds, but I don't understand the thermodynamics you explained.

I guess I have to read more and write less ...

seaicesailor

  • Guest
Re: The 2015 melting season
« Reply #1605 on: June 28, 2015, 02:42:35 AM »
Chris,

Still,..., that plot of thickness-1m seems to contradict buoy data which don't show much bottom melt until July and melt ponds that only go deep a few (but important) centimeters.

Can it be that PIOMAS is also a bit fooled by water over the ice during June? (I believed to have read so here)

Jim Hunt

  • First-year ice
  • Posts: 6268
  • Don't Vote NatC or PopCon, Save Lives!
    • View Profile
    • The Arctic sea ice Great White Con
  • Liked: 893
  • Likes Given: 87
Re: The 2015 melting season
« Reply #1606 on: June 28, 2015, 03:00:56 AM »
that plot of thickness-1m seems to contradict buoy data which don't show much bottom melt until July and melt ponds that only go deep a few (but important) centimeters.

If the ice is 1 meter thinner more short wave will warm the water beneath it. I also wonder what happens to the temperature throughout the remaining ice in the simulation when the step change occurs on June 1st.
"The most revolutionary thing one can do always is to proclaim loudly what is happening" - Rosa Luxemburg

ChrisReynolds

  • Nilas ice
  • Posts: 1764
    • View Profile
    • Dosbat
  • Liked: 20
  • Likes Given: 9
Re: The 2015 melting season
« Reply #1607 on: June 28, 2015, 08:39:04 AM »
Sea Ice Sailor,

Think of it in terms of a simple equation that is the sum of several terms of energy. Strictly speaking this is in joules, so time doesn't matter for what happens each second. To turn it into power (watts)  1 watt = 1 joule per second, but that's just detail - ignore it.

So for each second (time)...

Qmelt = the energy going into melting.
QoceanDP = the melting energy from the deeper (DP) ocean due to non solar warming.
QoceanSFC = the energy that goes into the melting of ice from solar energy absorbed by open water (SFC is surface).
Qsolar = the energy from the sun that goes into melting the upper surface of the ice.
I have neglected atmospheric heat going into melting ice from the absorption of infrared radiation, and conduction of heat into the upper surface of the ice, also the warming from ocean warmed by these mechanisms into this.

Qmelt =  QOceanSFC + QoceanDP + Qsolar

Waves/storms would be expected to increase QoceanDP by vertical mixing.

Q solar doesn't change much for ice, once the ice is wet I assume that albedo drop from dry / snow covered ice to wet / wet snow accounts for most of the increase of this during the melt season.

The question is what happens to QOceanSfc...

The energy absorbed by the ocean needs to get into the ice somehow. It mainly does this by conduction.

The heat flux between two bodies is proportional to the temperature difference between them multiplied by the thermal conductivity. Thermal conductivity may not be quite a fixed amount in a complex situation like the ice/ocean boundary, but let us assume for a moment that if it changes it is not significant.

So QOceanSfc has two states when we look at the difference between the ice edge and melt within the pack. Say the open water warms to around 5degC, the water between floes is limited to 1 degC, ice melts at 0degC (assuming pure water).

Open water, QOceanSfc is proportional to 5 - 0 = 5.
Between floes QOceanSfc is proportional to 1 - 0 = 1.

So you would get 5 times more energy flux from the warm open water flowing against the ice than you would for the open water between floes. Our oiginal sums become

Ice Edge.
Qmelt =  5 X QOceanSFC + QoceanDP + Qsolar

Between Floes.
Qmelt =  1 X QOceanSFC + QoceanDP + Qsolar


Jim,

The temperature of the remaining ice would remain near zero, like a drink cooling with ice in it.

ChrisReynolds

  • Nilas ice
  • Posts: 1764
    • View Profile
    • Dosbat
  • Liked: 20
  • Likes Given: 9
Re: The 2015 melting season
« Reply #1608 on: June 28, 2015, 08:43:02 AM »
Chris,

Still,..., that plot of thickness-1m seems to contradict buoy data which don't show much bottom melt until July and melt ponds that only go deep a few (but important) centimeters.

Can it be that PIOMAS is also a bit fooled by water over the ice during June? (I believed to have read so here)

I don't understand why people are claiming that PIOMAS is fooled by the water over the ice in June. PIOMAS is a physics model of the ice consisting of a set of interlinked equations. It sits upon an ocean model, and it uses data from the NCEP/NCAR reanalysis system as atmospheric forcing.

The only sea ice data it takes in is NSIDC gridded concentration data.

Jim Hunt

  • First-year ice
  • Posts: 6268
  • Don't Vote NatC or PopCon, Save Lives!
    • View Profile
    • The Arctic sea ice Great White Con
  • Liked: 893
  • Likes Given: 87
Re: The 2015 melting season
« Reply #1609 on: June 28, 2015, 10:33:27 AM »
The temperature of the remaining ice would remain near zero, like a drink cooling with ice in it.

Like this?
"The most revolutionary thing one can do always is to proclaim loudly what is happening" - Rosa Luxemburg

ChrisReynolds

  • Nilas ice
  • Posts: 1764
    • View Profile
    • Dosbat
  • Liked: 20
  • Likes Given: 9
Re: The 2015 melting season
« Reply #1610 on: June 28, 2015, 10:40:42 AM »
No.

At the ice/ocean interface where the melt occurs.

Jim Hunt

  • First-year ice
  • Posts: 6268
  • Don't Vote NatC or PopCon, Save Lives!
    • View Profile
    • The Arctic sea ice Great White Con
  • Liked: 893
  • Likes Given: 87
Re: The 2015 melting season
« Reply #1611 on: June 28, 2015, 10:49:21 AM »
No.

At the ice/ocean interface where the melt occurs.

My graph is a thought experiment showing a simulated sudden change in the ice/ocean interface of IMB buoy 2013C  from thermistor 40 to thermistor 30 on June 1st 2013. Bottom melt wouldn't then start for quite a while, unless Ed messed with the ocean temperature too.
« Last Edit: June 28, 2015, 01:22:23 PM by Jim Hunt »
"The most revolutionary thing one can do always is to proclaim loudly what is happening" - Rosa Luxemburg

ChrisReynolds

  • Nilas ice
  • Posts: 1764
    • View Profile
    • Dosbat
  • Liked: 20
  • Likes Given: 9
Re: The 2015 melting season
« Reply #1612 on: June 28, 2015, 11:15:58 AM »
No.

At the ice/ocean interface where the melt occurs.

My graph shows the ice/ocean interface of IMB buoy 2013C suddenly changing from thermistor 40 to thermistor 30 on June 1st 2013. Bottom melt won't start for quite a while, unless Ed messed with the ocean temperature too.

I thought you were referring to the ice being cold inside.

What you would need to do is to get out there when that lower end oddity happens, pull out the chunk of ice and inspect it visually. Perhaps a slice of ice dropped off at the time the second reading was made. To have ice that cold in contact with water results in one thing - acretion, not loss.

There are reasons why the people who run those buoys caution that the data is preliminary.

sofouuk

  • New ice
  • Posts: 82
    • View Profile
  • Liked: 0
  • Likes Given: 15
Re: The 2015 melting season
« Reply #1613 on: June 28, 2015, 11:16:12 AM »
"Qmelt = the energy going into melting.
QoceanDP = the melting energy from the deeper (DP) ocean due to non solar warming.
QoceanSFC = the energy that goes into the melting of ice from solar energy absorbed by open water (SFC is surface).
Qsolar = the energy from the sun that goes into melting the upper surface of the ice.
I have neglected atmospheric heat going into melting ice from the absorption of infrared radiation, and conduction of heat into the upper surface of the ice, also the warming from ocean warmed by these mechanisms into this.

Qmelt =  QOceanSFC + QoceanDP + Qsolar"

... is it possible to quantify the relative importance of each energy source in a typical melt season across the arctic as a whole?

ChrisReynolds

  • Nilas ice
  • Posts: 1764
    • View Profile
    • Dosbat
  • Liked: 20
  • Likes Given: 9
Re: The 2015 melting season
« Reply #1614 on: June 28, 2015, 11:29:40 AM »
Yes in theory, but not in practice. Take solar for example. It varies by: Latitude, Time, Angle of Incidence, Cloudiness, Ice Albedo. Time and latitude are OK to account for, the other factors are not. Also ocean isn't well constrained at all, and what data there is is patchy and sporadic. So my argument has to remain qualitative. Sorry.

Andreas T

  • Nilas ice
  • Posts: 1149
    • View Profile
  • Liked: 18
  • Likes Given: 4
Re: The 2015 melting season
« Reply #1615 on: June 28, 2015, 12:05:59 PM »
The temperature of the remaining ice would remain near zero, like a drink cooling with ice in it.

Like this?
I had a look at the preliminary data file to see what happened in the following hours to that sudden temperature change and it isn't in the data as archived. Just a gradual increase in ice temperature as could be expected.
Have another look there Jim to make sure it isn't something that has gone wrong in your plot.

Lord M Vader

  • Nilas ice
  • Posts: 1406
    • View Profile
  • Liked: 60
  • Likes Given: 39
Re: The 2015 melting season
« Reply #1616 on: June 28, 2015, 12:19:09 PM »
For the next 7 days I expect 3-4 century breaks. This as a result of

1) warmer air in Labrador Sea
2) somewhat warmer air in Hudson Bay
3) significant dropping in sea ice concentration i Chukchi Sea. the difference between June 26 and June 27 is big.
4) warm air at 850 hPa will enter Chukchi Sea by tomorrow
5) warm air will enter Laptev Sea in about 3 days according to GFS 00z run.
6) parts of the Greenland ice has low ice concentration as seen on todays ice concentration map and should melt out quite soon.

That's why I think so!

Does anyone here have an idea about how the temps at 850 hPa was distributed in the Arctic for the years 2007-2014? I think that one main reason for this years slow melt rate in June is that the coldest air have been located at the fringes with the thinnest ice while the warmest air OTOH have been situated in areas with much thicker ice. Another factor is the lack of significant pressure gradient so far. While the sun is important to create melt ponds, the wind is of equal importance to get this melt ponds to hammer the environment around it, especially in the areas where the ice have broken up.

If the ice thickness distribution had been inverted e.g thickest ice in the Atlantic sector and the thinnest one in the Pacific sector there would have been many more century breaks up to this date.

While El Niño is strengthening 2016 may in many ways be a crucial year for the ASIE and ASIA.

Finally, one very interesting question with main adress to Wipneus: how many century breaks would there have been in earlier melt seasons if one had removed the fringes areas in calculating the SIE and SIA? This would be very interesting to know!!

Best, LMV

ChrisReynolds

  • Nilas ice
  • Posts: 1764
    • View Profile
    • Dosbat
  • Liked: 20
  • Likes Given: 9
Re: The 2015 melting season
« Reply #1617 on: June 28, 2015, 12:44:25 PM »
LMV,

Coincidence: Last night I was looking at 1 June to 25 June 850mb temp & SLP (Surface obviously) for 2007 to 2015. I've zipped them together and they're available together with SLP. Try this link:
https://drive.google.com/file/d/0B3pB-kdzoLU3S0o4N3hEdHp1dUE/view?usp=sharing
Let me know if you have a problem with it.

Jim Hunt

  • First-year ice
  • Posts: 6268
  • Don't Vote NatC or PopCon, Save Lives!
    • View Profile
    • The Arctic sea ice Great White Con
  • Liked: 893
  • Likes Given: 87
Re: The 2015 melting season
« Reply #1618 on: June 28, 2015, 12:46:16 PM »
Have another look there Jim to make sure it isn't something that has gone wrong in your plot.

As the filename suggests, my graph above is merely a "thought experiment", not a slice of "real life". You could try hacking the 2013C CSV file which I assume you recently downloaded? The real thing looks like this:

http://GreatWhiteCon.info/resources/ice-mass-balance-buoys/summer-2013-imbs/#2013C
"The most revolutionary thing one can do always is to proclaim loudly what is happening" - Rosa Luxemburg

ChrisReynolds

  • Nilas ice
  • Posts: 1764
    • View Profile
    • Dosbat
  • Liked: 20
  • Likes Given: 9
Re: The 2015 melting season
« Reply #1619 on: June 28, 2015, 12:53:58 PM »
No.

At the ice/ocean interface where the melt occurs.

My graph shows the ice/ocean interface of IMB buoy 2013C suddenly changing from thermistor 40 to thermistor 30 on June 1st 2013. Bottom melt won't start for quite a while, unless Ed messed with the ocean temperature too.

I thought you were referring to the ice being cold inside.

What you would need to do is to get out there when that lower end oddity happens, pull out the chunk of ice and inspect it visually. Perhaps a slice of ice dropped off at the time the second reading was made. To have ice that cold in contact with water results in one thing - acretion, not loss.

There are reasons why the people who run those buoys caution that the data is preliminary.

Or it could be that Jim was just making shit up for no apparent reason...

Sheesh.

Andreas T

  • Nilas ice
  • Posts: 1149
    • View Profile
  • Liked: 18
  • Likes Given: 4
Re: The 2015 melting season
« Reply #1620 on: June 28, 2015, 01:05:15 PM »
Yes in theory, but not in practice. Take solar for example. It varies by: Latitude, Time, Angle of Incidence, Cloudiness, Ice Albedo. Time and latitude are OK to account for, the other factors are not. Also ocean isn't well constrained at all, and what data there is is patchy and sporadic. So my argument has to remain qualitative. Sorry.
also solar shortwave inputs can be absorbed over greated depth in clear water or predominantly near the surface in more opaque (turbid?) water.  The same applies to ice. Clean ice absorbs less of the radiation  than  ice which is darkened by sediment (in coastal waters) or by algae. This affects the immediate consequence of this solar imput. Ice melting near surface or at depths, water temperature rising strongly in a thin layer or less strongly over a thicker layer.
What I find remarkable in the older buoy "movies" is how melt out of buoys occurs after surfaces have frozen again in September. Clearly bottom melt becomes apparent at the surface only when it has thinned the ice over a long enough time. Buoy images also show sea water melting ice from the floe edge, often the surface overhangs the water where melt has progressed further (see the what the buoys are telling thread) This keeps water temperatures down but it does so by taking the latent heat which melts ice at constant temperature from the water which receives energy from solar input.
What I want to point out here for seaicesailor is there are time lags between  energy reaching the surface and ice melting. It seems to me that what happens in september is largely based on mixing , bringing water of sufficient warmth and sufficient salinity (these can be values just above the melting point if large quantaties are available) in contact with the ice. A complicating factor is that the melt of course reduces salinity, again slowing melt until mixing can counteract it.

Andreas T

  • Nilas ice
  • Posts: 1149
    • View Profile
  • Liked: 18
  • Likes Given: 4
Re: The 2015 melting season
« Reply #1621 on: June 28, 2015, 01:08:32 PM »
Have another look there Jim to make sure it isn't something that has gone wrong in your plot.

As the filename suggests, my graph above is merely a "thought experiment", not a slice of "real life". You could try hacking the 2013C CSV file which I assume you recently downloaded? The real thing looks like this:

http://GreatWhiteCon.info/resources/ice-mass-balance-buoys/summer-2013-imbs/#2013C
I clearly misunderstood what you did there completely, sorry, Jim

Jim Hunt

  • First-year ice
  • Posts: 6268
  • Don't Vote NatC or PopCon, Save Lives!
    • View Profile
    • The Arctic sea ice Great White Con
  • Liked: 893
  • Likes Given: 87
Re: The 2015 melting season
« Reply #1622 on: June 28, 2015, 01:18:14 PM »
Or it could be that Jim was just making shit up for no apparent reason...

With the benefit of hindsight I can now appreciate that my "linguistics" were a trifle confusing. I'll try and make things clearer forthwith.

I also must complement you on a remarkably good impersonation of Vergent.

Sheesh!
« Last Edit: June 28, 2015, 01:51:27 PM by Jim Hunt »
"The most revolutionary thing one can do always is to proclaim loudly what is happening" - Rosa Luxemburg

Frivolousz21

  • Nilas ice
  • Posts: 1915
  • Live in Belleville, IL..15 miles SE of St. Louis.
    • View Profile
  • Liked: 598
  • Likes Given: 7
Re: The 2015 melting season
« Reply #1623 on: June 28, 2015, 01:29:46 PM »
verything is on track for an explosive 2-3 week period in terms of losses.


What's up with this huge area of smoke getting sucked into the Beaufort, CA, and CAB.


Also the NWP is done this year unless there is a large reversal in weather.  This kind of sustained WAA and sunlight there is the end game.


We can see the regional warming effect coming out of the CAA into the CAB.


Everyday I check these graphics which lays out where melt is taking place and how strong.

The Pacific side has been under fire for a while.  It's been getting the Western half of the CAB and North of GIS for a while now.

The CAA has been smoked for a while and the Chuchki relentlessly.

The ESS has gotten a sight break which is now over.


Again the amazing change at 140W/77N in the Western CAB.

That warm airmass rolled through and major surface melt took off in a 24 hour period.

If there was 10cm of snow it would be moot.

No snow and a cloudy misty day becomes a nasty melt day.
Thanks to sea ice melting at 29F.

I got a nickname for all my guns
a Desert Eagle that I call Big Pun
a two shot that I call Tupac
and a dirty pistol that love to crew hop
my TEC 9 Imma call T-Pain
my 3-8 snub Imma call Lil Wayne
machine gun named Missy so loud
it go e-e-e-e-ow e-e-e-e-e-e-blaow

Frivolousz21

  • Nilas ice
  • Posts: 1915
  • Live in Belleville, IL..15 miles SE of St. Louis.
    • View Profile
  • Liked: 598
  • Likes Given: 7
Re: The 2015 melting season
« Reply #1624 on: June 28, 2015, 01:32:17 PM »
Waiting, waiting and waiting... Don't like to wait for big melt rate to go ahead,... Model forecasts continues to be rather ice friendly and backing virtually every run...

Yes, this is looking a lot like 2014, the year of in situ melting.

But the CAA is looking interesting:


I wonder if and when things are going to fall apart.


With all due respect melt this summer is anywhere from 1-4 weeks ahead of 2014.

Pretty much everywhere. 
I got a nickname for all my guns
a Desert Eagle that I call Big Pun
a two shot that I call Tupac
and a dirty pistol that love to crew hop
my TEC 9 Imma call T-Pain
my 3-8 snub Imma call Lil Wayne
machine gun named Missy so loud
it go e-e-e-e-ow e-e-e-e-e-e-blaow

Andreas T

  • Nilas ice
  • Posts: 1149
    • View Profile
  • Liked: 18
  • Likes Given: 4
Re: The 2015 melting season
« Reply #1625 on: June 28, 2015, 01:37:00 PM »
Quote
My graph is a thought experiment showing a simulated sudden change in the ice/ocean interface of IMB buoy 2013C  from thermistor 40 to thermistor 30 on June 1st 2013. Bottom melt wouldn't then start for quite a while, unless Ed messed with the ocean temperature too.
To follow through with your thought experiment: what happens at the new and cold ice bottom is entirely dependent on water convection. Water at -1.7 deg  could cool to -1.8 deg and warm the ice a little be replaced by more water at -1.7 deg and so on. So ice surface warms, strong temp gradient in the ice warms ice further into the floe, i.e. temp at say T20 rises faster than before while water temp drops a little.
Another possibility would be little or no convection, so water in contact with ice at -6 deg would freeze. That too would maintain the ice surface at the freezing temp of sea water say -1.8 and the same steep temp gradient in the ice which raises temps at T20. This time less water is cooled but since it is also frozen it warms a lot of ice in the process.
Either way you end up with ice which hasn't melted straight away but is ready for melting sooner that the ice which hasn't magically thinned by a meter.
 Or am I missing the point again?

maybe this should be in a different thread?

Neven

  • Administrator
  • First-year ice
  • Posts: 9503
    • View Profile
    • Arctic Sea Ice Blog
  • Liked: 1336
  • Likes Given: 618
Re: The 2015 melting season
« Reply #1626 on: June 28, 2015, 02:43:21 PM »
With all due respect melt this summer is anywhere from 1-4 weeks ahead of 2014.

Pretty much everywhere.

Fair enough, but it only counts once it starts showing up on the graphs. I'm pretty sure that will happen as soon as a dipole sets up. Except for the second half of May we haven't really seen atmospheric conditions that are ideal for extent/area declines.

And I wonder, where is all that heat in Bering/Chukchi disappearing to:
The enemy is within
Don't confuse me with him

E. Smith

Andreas T

  • Nilas ice
  • Posts: 1149
    • View Profile
  • Liked: 18
  • Likes Given: 4
Re: The 2015 melting season
« Reply #1627 on: June 28, 2015, 02:54:16 PM »
....

And I wonder, where is all that heat in Bering/Chukchi disappearing to:
Since you are showing anomalies the heat does not need to disappear, it could just mean that surface "normal" temps are catching up. Of course the headstart which showed as anomalies could mean more heat in more water at that now not so anomalous temperature (mixed to greater depth)

Frivolousz21

  • Nilas ice
  • Posts: 1915
  • Live in Belleville, IL..15 miles SE of St. Louis.
    • View Profile
  • Liked: 598
  • Likes Given: 7
Re: The 2015 melting season
« Reply #1628 on: June 28, 2015, 03:16:20 PM »
With all due respect melt this summer is anywhere from 1-4 weeks ahead of 2014.

Pretty much everywhere.

Fair enough, but it only counts once it starts showing up on the graphs. I'm pretty sure that will happen as soon as a dipole sets up. Except for the second half of May we haven't really seen atmospheric conditions that are ideal for extent/area declines.

And I wonder, where is all that heat in Bering/Chukchi disappearing to:

Losses will be NR or record in July.

The historic Hudson and Badin have a lot of ice that will completely melt out in the next 3 weeks. 

The chichi is cooked. 

The ESS and Beaufort are not far behind.

Oh and the Eastern Laptv is hosed.

   
The coldest air is being jettisoned into the Atlantic side

In the end the surface are way warmer than 2014.
I got a nickname for all my guns
a Desert Eagle that I call Big Pun
a two shot that I call Tupac
and a dirty pistol that love to crew hop
my TEC 9 Imma call T-Pain
my 3-8 snub Imma call Lil Wayne
machine gun named Missy so loud
it go e-e-e-e-ow e-e-e-e-e-e-blaow

Frivolousz21

  • Nilas ice
  • Posts: 1915
  • Live in Belleville, IL..15 miles SE of St. Louis.
    • View Profile
  • Liked: 598
  • Likes Given: 7
Re: The 2015 melting season
« Reply #1629 on: June 28, 2015, 03:50:02 PM »
This pretty much sums it up


Here is 2014 versus 2015 and

2012 is the last one.


2015 is a lot closer to 2012 than 2014


2012 was warm all over.

This year is behind that but nothing like 2014.
I got a nickname for all my guns
a Desert Eagle that I call Big Pun
a two shot that I call Tupac
and a dirty pistol that love to crew hop
my TEC 9 Imma call T-Pain
my 3-8 snub Imma call Lil Wayne
machine gun named Missy so loud
it go e-e-e-e-ow e-e-e-e-e-e-blaow

Neven

  • Administrator
  • First-year ice
  • Posts: 9503
    • View Profile
    • Arctic Sea Ice Blog
  • Liked: 1336
  • Likes Given: 618
Re: The 2015 melting season
« Reply #1630 on: June 28, 2015, 04:00:49 PM »
The heat is definitely there, as seen on the DMI 80N temp graph:


But little movement this year so far.
The enemy is within
Don't confuse me with him

E. Smith

Paddy

  • Nilas ice
  • Posts: 1026
    • View Profile
  • Liked: 153
  • Likes Given: 151
Re: The 2015 melting season
« Reply #1631 on: June 28, 2015, 04:25:46 PM »
Is the green line on that temperature graph an average of previous years?

Bruce Steele

  • Young ice
  • Posts: 2520
    • View Profile
  • Liked: 753
  • Likes Given: 41
Re: The 2015 melting season
« Reply #1632 on: June 28, 2015, 04:48:15 PM »
Paddy, Green line average 1958-2002. Here is the DMI site, you can toggle year to year and compare.

http://ocean.dmi.dk/arctic/meant80n.uk.php


Bruce Steele

  • Young ice
  • Posts: 2520
    • View Profile
  • Liked: 753
  • Likes Given: 41
Re: The 2015 melting season
« Reply #1633 on: June 28, 2015, 05:03:39 PM »
Schumacher and Stabeno make the argument that the PDO phase has large effects upon Bering Sea Ice extent.

http://www.pmel.noaa.gov/pubs/outstand/stab2529/features.shtml

From a Jan. dosbat posting I borrowed a chart showing Bering Sea ice anomalies 79-2015. This provides info to test the Schumacher paper PDO / Bering Ice correlation . Thanks Chris

 http://dosbat.blogspot.com/2015/01/where-is-ice-in-bering-sea.html

The PDO flipped back to positive last year and the Bering Ice has has responded as predicted. It will be interesting to see what happens if PDO phase changes back negative with the associated La Nina that usually follows a strong El Nino( which is presumably still in the works )

Lord M Vader

  • Nilas ice
  • Posts: 1406
    • View Profile
  • Liked: 60
  • Likes Given: 39
Re: The 2015 melting season
« Reply #1634 on: June 28, 2015, 05:05:33 PM »
Speaking about heat, look at the Baffin/New Foundland Sea where the SSTs have gone from mostly negative to rather positive in just a few days.. Should get some impacts there next week :)

Laptev Sea is on steroids, and actually above normal SIE for this time at year. But the ice is thin and once WAA happens, the sea ice will blow away quick.

//LMV


helorime

  • Frazil ice
  • Posts: 129
    • View Profile
  • Liked: 3
  • Likes Given: 18
Re: The 2015 melting season
« Reply #1635 on: June 28, 2015, 05:07:10 PM »
Oddly toggling through the years at http://ocean.dmi.dk/arctic/meant80n.uk.php it superficially appears that all the 2000's have had cooler arctic summer than average, and it was the 90's where it was warmer than usual.
Any sufficiently advanced technology is indistinguishable from magic.

Nick_Naylor

  • Frazil ice
  • Posts: 291
    • View Profile
  • Liked: 0
  • Likes Given: 0
Re: The 2015 melting season
« Reply #1636 on: June 28, 2015, 05:17:31 PM »
Oddly toggling through the years at http://ocean.dmi.dk/arctic/meant80n.uk.php it superficially appears that all the 2000's have had cooler arctic summer than average, and it was the 90's where it was warmer than usual.

Could that be due to earlier loss of snow, allowing the ice to more effectively remove heat from the surface atmosphere?

Bruce Steele

  • Young ice
  • Posts: 2520
    • View Profile
  • Liked: 753
  • Likes Given: 41
Re: The 2015 melting season
« Reply #1637 on: June 28, 2015, 05:33:15 PM »
I think some caution is needed when comparing years prior to 2002 with years post 2002. Data 1958-2002 was from ECMWF reannalysis and years post from different models. You can see these data sources on the DMI site. I wouldn't be pointing this out but I recall caution on this issue from something I read here years past .

ChrisReynolds

  • Nilas ice
  • Posts: 1764
    • View Profile
    • Dosbat
  • Liked: 20
  • Likes Given: 9
Re: The 2015 melting season
« Reply #1638 on: June 28, 2015, 05:34:05 PM »
Schumacher and Stabeno make the argument that the PDO phase has large effects upon Bering Sea Ice extent.

http://www.pmel.noaa.gov/pubs/outstand/stab2529/features.shtml

From a Jan. dosbat posting I borrowed a chart showing Bering Sea ice anomalies 79-2015. This provides info to test the Schumacher paper PDO / Bering Ice correlation . Thanks Chris

 http://dosbat.blogspot.com/2015/01/where-is-ice-in-bering-sea.html

The PDO flipped back to positive last year and the Bering Ice has has responded as predicted. It will be interesting to see what happens if PDO phase changes back negative with the associated La Nina that usually follows a strong El Nino( which is presumably still in the works )

Bruce,

The correlation between PDO and first week of Jan (data used in that post) is

PDO December -0.493
PDO January  -0.530

Both are statistically significant to 99.5%. The correlation is such that a high PDO means low Bering sea ice, PDO December was 2.51, January was 2.45, both are in excess of 2 sigma.

I don't know why I didn't include that in the original post.

Data
http://research.jisao.washington.edu/pdo/PDO.latest
Table of Correl significance
http://www.oneonta.edu/faculty/vomsaaw/w/psy220/files/SignifOfCorrelations.htm

Andir

  • New ice
  • Posts: 13
    • View Profile
  • Liked: 0
  • Likes Given: 0
Re: The 2015 melting season
« Reply #1639 on: June 28, 2015, 06:50:50 PM »
Sometimes i have problems to get a quick overview over the current weather conditions and temperatures in the arctic.
I am looking for a site a bit like http://www.schneedecke.de/Temperaturen.html
, but with weather conditions and maps.
Can u help me?
Thx
Aramed

seaicesailor

  • Guest
Re: The 2015 melting season
« Reply #1640 on: June 28, 2015, 07:00:47 PM »
....

And I wonder, where is all that heat in Bering/Chukchi disappearing to:
Since you are showing anomalies the heat does not need to disappear, it could just mean that surface "normal" temps are catching up. Of course the headstart which showed as anomalies could mean more heat in more water at that now not so anomalous temperature (mixed to greater depth)

I believe wind has been blowing from the North for a couple of days and got quite cloudier too. I asked out how long that dark purple might last and Tnioli said a couple of days or so. Seemed about right.

Nick_Naylor

  • Frazil ice
  • Posts: 291
    • View Profile
  • Liked: 0
  • Likes Given: 0
Re: The 2015 melting season
« Reply #1641 on: June 28, 2015, 07:12:17 PM »
Sometimes i have problems to get a quick overview over the current weather conditions and temperatures in the arctic.

If you wait a little bit, Carnival Cruise Lines will probably put something up  ;)
Seriously, if you just want to see conditions very quickly, you can use the MeteoEarth App on iOs/Android. This shows global temp, wind, clouds, precipitation for now through now + 5 days in a nullschool sort of display, but much quicker to navigate.

jdallen

  • Young ice
  • Posts: 3412
    • View Profile
  • Liked: 651
  • Likes Given: 244
Re: The 2015 melting season
« Reply #1642 on: June 28, 2015, 10:47:01 PM »
We may find this important later, but I think the two images will speak for themselves.  The first is a wider-scale image of the CAB, mostly cloud covered.

The second is an exposed window of the CAB on the eastern side of the pack, near the pole.  It mostly speaks for it self, by way of seriously reduced concentration for an area where we *should* still be seeing mostly contiguous extent.
This space for Rent.

Peter Ellis

  • Grease ice
  • Posts: 619
    • View Profile
  • Liked: 33
  • Likes Given: 14
Re: The 2015 melting season
« Reply #1643 on: June 28, 2015, 10:58:12 PM »
Um, 2013 looked like that in June 28th over a very wide area, almost up to the Pole itself, and still had limited melt (as compared to other post-2007 years).  This is not particularly unusual and doesn't really give us a clue what's going to happen through the rest of the season.

http://1.usa.gov/1BOJPM7

jdallen

  • Young ice
  • Posts: 3412
    • View Profile
  • Liked: 651
  • Likes Given: 244
Re: The 2015 melting season
« Reply #1644 on: June 28, 2015, 11:12:16 PM »
Um, 2013 looked like that in June 28th over a very wide area, almost up to the Pole itself, and still had limited melt (as compared to other post-2007 years).  This is not particularly unusual and doesn't really give us a clue what's going to happen through the rest of the season.

http://1.usa.gov/1BOJPM7
IIRC, 2013 up to this point had much better weather for ice preservation, with a far worse starting point (2015's low extent not withstanding - volume is higher, and there is more MYI than in 2013).

I agree, weather will make or break the season.  My point is, far from being in good shape, the CAB is broken up and vulnerable.  I think it does give us a clue.
This space for Rent.

Lord M Vader

  • Nilas ice
  • Posts: 1406
    • View Profile
  • Liked: 60
  • Likes Given: 39
Re: The 2015 melting season
« Reply #1645 on: June 28, 2015, 11:31:38 PM »
On of this years big player should be El Niño. From the info I've seen summer time El Niño tends to manifest themselves by higher pressure in the Arctic. For a short while there was a minor hiccup in El Niño but now another very strong Westerly Wind Burst (WWB) is emerging in the Western Pacific.

Joint Typhoon Warning Center is currently giving two AOI fairly close to the Equator a medium chance to develope into a TC by the next 24 hours. One of these invests is actually on SOUTHERN hemisphere(!). A third AOI is given a low chance to develope. Anyway, this is creating an enhanced WWB. The ECMWF have for several runs hinted of a possibly very powerful cyclone to move on a way to Taiwan from which it most likely will recurve after that. I think most of us remember what happened to STY Nuri that "bombed" in the Berings Sea. This one I believe have a reasonable chance to be a good moisture distibutor to the Arctic basin if it recurves. Look at the recent ECMWF runs! Even if the first foreseen TC doesn't recurve, the second foreseen one may do so... JTWC: http://www.usno.navy.mil/JTWC/ (Click at "Satellite image" at "Western/South Pacific Ocean")

Finally, ECMWF 12z run is no good news for the Arctic sea ice!! It hints a possibility for a decent dipole set up late by next week. See: http://www.ecmwf.int/en/forecasts/charts/medium/mean-sea-level-pressure-wind-speed-850-hpa-and-geopotential-500-hpa

Best, LMV

Neven

  • Administrator
  • First-year ice
  • Posts: 9503
    • View Profile
    • Arctic Sea Ice Blog
  • Liked: 1336
  • Likes Given: 618
Re: The 2015 melting season
« Reply #1646 on: June 28, 2015, 11:34:24 PM »
I agree the pack looks vulnerable, with holes starting to pop up here and there, and with a lot less cyclonic activity compared to 2013. But if the weather forecast stays like this, there won't be much capitalization on this potential.
The enemy is within
Don't confuse me with him

E. Smith

seaicesailor

  • Guest
Re: The 2015 melting season
« Reply #1647 on: June 29, 2015, 06:37:47 AM »
Hi Chris and all,

I understand that surface air temp  within the pack is close to zero due to melting (air in direct contact with melting ice be at same temp by thermodynamics) and for similar reasons ocean water at -1.5 or so. That moderates the rate of melting within the pack since it is the same state for hundreds of kilometers.

Melt ponds for what I can gather, only go deep a few tens of centimeters (if so) by this time of the year.

Then I dont get the -1m result. Unless snow cover is taken as ice thickness!

Polynya opened by storms and on weak ice is also a major factor. That is also local melting to be true. But doesn't seem to me it makes for the 1 meter plus either.

Anyway I now wonder about the relevance of melt ponds, is it more a just manifestation of what later will come or really a main cause of faster melting? I think one of your conclusions in your blog was precisely the first one.

Back to polynya: they might help the edge retreat big time when this reaches the broken ice: instead of being a homogenous line of limited perimeter, the edge will become a very wrinkled front (or a wide strip of broken melting floes). In front propagation, wrinkling is a major accelerator because it can increase the length of the front by many times.
I am not talking about lateral melting; this wrinkling will increase the rate of top (bottom) mixing between the warm air (water) and the quasi-isothermal pack ahead of the front.

Maybe melt ponds also help wrinkling, directly (wrinkling of the floe itself and faster lateral melting) and by helping floe break due to their weakening effect.

Wrt this melting season, pack seems crumbling down indeed ! except for Laptev. But ice edge is not well established within the Arctic and warm weather is coming back two weeks too late if so.
« Last Edit: June 29, 2015, 06:48:08 AM by seaicesailor »

Frivolousz21

  • Nilas ice
  • Posts: 1915
  • Live in Belleville, IL..15 miles SE of St. Louis.
    • View Profile
  • Liked: 598
  • Likes Given: 7
Re: The 2015 melting season
« Reply #1648 on: June 29, 2015, 08:40:59 AM »
I respectfully disagree.


The models have been trending towards the GIS bridge block with the NEPAC HP causing basically a huge flow of tremendous heat coming from areas with ssta of 2-4C above normal.

Add in the ridging and kaboom.


I got a nickname for all my guns
a Desert Eagle that I call Big Pun
a two shot that I call Tupac
and a dirty pistol that love to crew hop
my TEC 9 Imma call T-Pain
my 3-8 snub Imma call Lil Wayne
machine gun named Missy so loud
it go e-e-e-e-ow e-e-e-e-e-e-blaow

Frivolousz21

  • Nilas ice
  • Posts: 1915
  • Live in Belleville, IL..15 miles SE of St. Louis.
    • View Profile
  • Liked: 598
  • Likes Given: 7
Re: The 2015 melting season
« Reply #1649 on: June 29, 2015, 09:16:13 AM »
The euro is just nasty.

Almost the entire NH ends up roasting.

The gfs nukes the Pacific side and is warm the entire run.   

I got a nickname for all my guns
a Desert Eagle that I call Big Pun
a two shot that I call Tupac
and a dirty pistol that love to crew hop
my TEC 9 Imma call T-Pain
my 3-8 snub Imma call Lil Wayne
machine gun named Missy so loud
it go e-e-e-e-ow e-e-e-e-e-e-blaow