So 2016 sets a new record for earliest minimum, beating 2002 by one day. Except that 2016 is a leap year, while 2002 wasn't, so the difference is actually a smaller fraction of a day.
This seems like an unusually fast increase following minimum, but 2005, 2010, 2012, and 2015 all had faster rebounds after their minima.
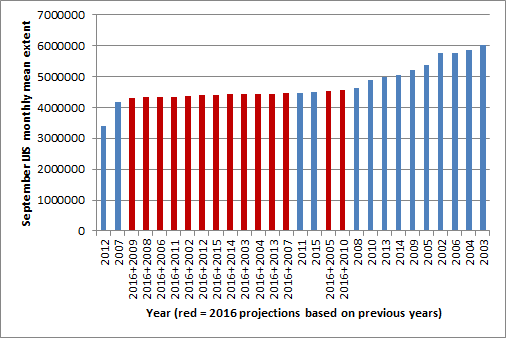
I used the data from each previous year's re-freeze period to project what 2016's September monthly average extent might look like. To do this, I aligned each previous year's record by shifting it in time (to begin where we are now, 7 days past the minimum) and in extent (so the increase for the rest of the month starts at the extent that 2016 is at now).
It seems inevitable that 2016 will come in above 2007 for monthly extent -- this would happen even if there was no further increase for the entire rest of the month, which is obviously unlikely.
If 2016 follows the pattern of any previous year except 2005 or 2010, it will end up in 3rd place -- above 2012 and 2007, but below all other years. If it follows the pattern of 2005 or 2010, then 2016 will end up in 5th place, above 2012, 2007, 2011, and 2015.
Based on the 14 projections, the expected monthly mean will be 4.41 (95% CI 4.26-4.56).
So it seems likely that 2016 goes down in the record books as 2nd lowest daily extent, 3rd lowest monthly mean extent; but 4th or 5th lowest monthly mean would not be too surprising. Coming in 6th place for monthly mean (i.e., above 2008) would be 3 sigma above the expected value.
Assuming that 2016 ends up on the average of those 14 projections (i.e., 4.41), here is how that compares to the trend of previous years. 2016 would be close to the existing trendline, but slightly above it (error bars show the 95% CI for the projection):


