Thanks for the discussion on 2017A's top-melt profile and how it relates to the images sent by the WARM buoy at the same location. I tend to agree with many of you that we probably are over-thinking it. After all, many buoys melt a hole right around the stem, which drains any melt water to sea level, and thus a melting pond will not form around the buoy itself.
Also, it is clear that no matter the process (top or bottom melt) the ice at that location appears to be very thin right now.
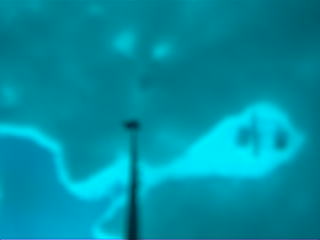
For example, the co-located WARM buoy 6 (that holds the camera that documented 2017A) records being in open water. At least, somebody wrote "open water!" on the Aug 2 tag in Jim's tracker site :
https://sites.wp.odu.edu/BORG/current-projects/warm-buoy-maps/Sidekick#2, WB#6 Aug 02 2017, 77.276106, -145.855897 - open water!
with this image of the buoy seen from below :
I looked into that WARM buoy a bit more, and found out that is actually a really COOL (pun intended) instrument !
I have not seen much reporting about WARM buoys on the ASIF, but essentially, it is a buoy with a 20 or 50 meter tether, with various sensors along the line. Here is a good overview of the system :
https://sites.wp.odu.edu/BORG/current-projects/temperature-and-irradiance-measurements-in-the-arctic/One of the sensors is a camera, mounted 20 meters deep, looking upward, and that is the one that is producing the images at this time (like the one above from Aug 2). Jim, you mentioned that the 'above surface' camera is looking at the sky now, but how do you know that ?
But the thing that makes the WARM buoys REALLY cool (in my opinion) is that they have "irradiance" sensors at certain depths. These sensors record how much sunlight makes it through the ice. Here is the data for this particular WARM buoy :
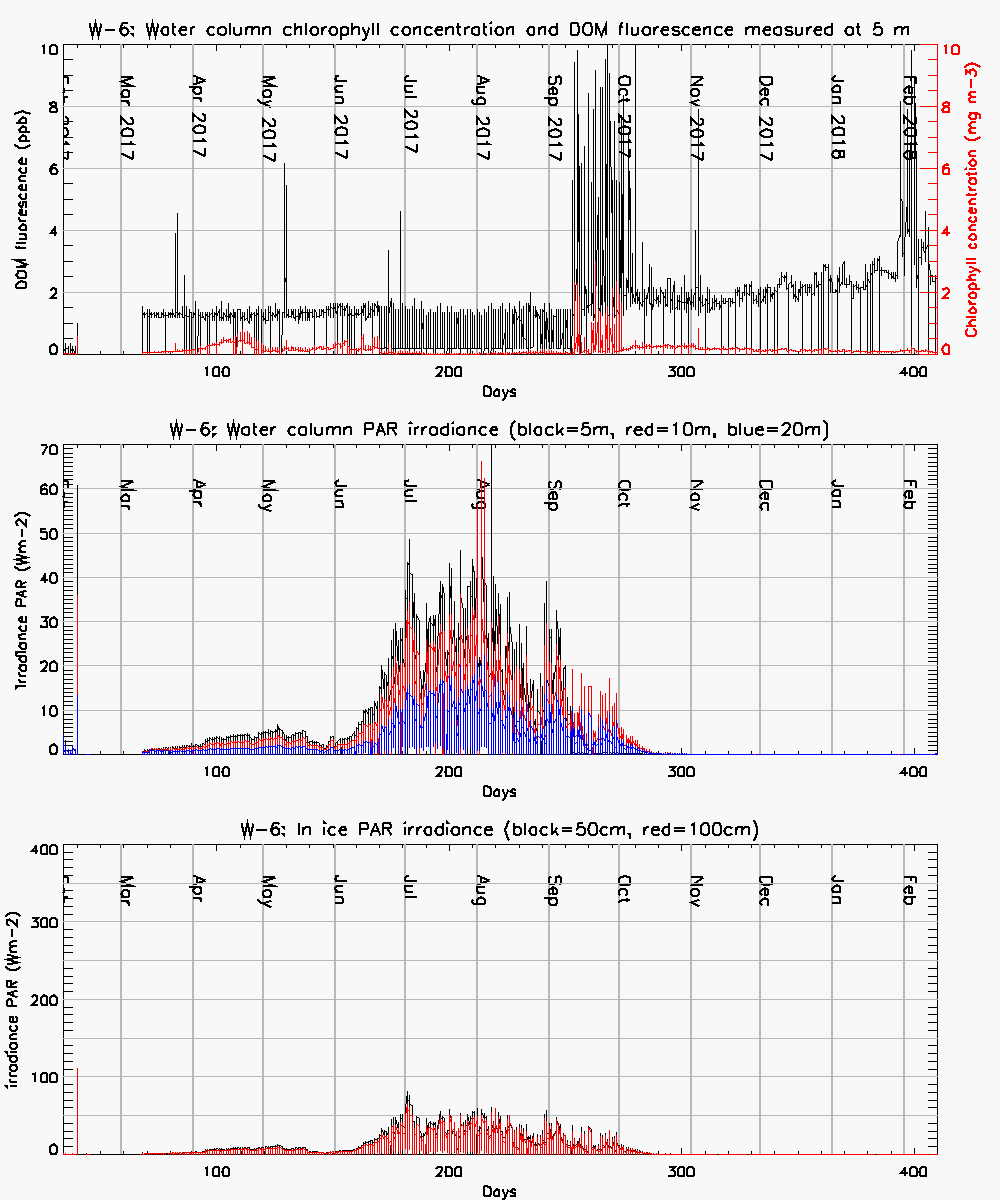
Full data for this buoy is here :
http://psc.apl.washington.edu/UpTempO/BuoyInfo.php?cbuoy=9080&bname1=UpTempO%202017Note that very little sunlight makes it through the ice before June. That is when there is still snow cover on the ice. But after that, irradiance moves up quickly, and during July we see 30-40 W/m^2 makes it through the ice, and we see that most of that heat gets absorbed in the top 20 meters of water below the ice. That is still above the halocline, which means that most of that heat will make it it causing bottom melt. And remember that 35 W/m^2 will cause about 1 cm/day of bottom melt.
This (30-40 W/m^2 shining through the ice) appears to be typical for July, when we look at other WARM buoy data.
So here we see a quantification of a main cause of Arctic sea ice bottom melt.
That's pretty awesome, no ?


