Support the Arctic Sea Ice Forum and Blog

Author Topic: Latest PIOMAS Volume update  (Read 1892043 times)

crandles

  • Young ice
  • Posts: 3379
    • View Profile
  • Liked: 239
  • Likes Given: 81
Re: Latest PIOMAS update (March)
« Reply #200 on: April 07, 2014, 11:31:19 PM »
March daily data is now out. 31 March 14 value 22.609 just below 2011's minimum maximum of 22.677, is second lowest for 31 March 14.


Jim Pettit

  • Nilas ice
  • Posts: 1175
    • View Profile
  • Liked: 41
  • Likes Given: 11
Re: Latest PIOMAS update (March)
« Reply #201 on: April 08, 2014, 12:34:21 AM »
 Excellent! I've gone ahead and updated my interactive 3D PIOMAS graphs with the March numbers, as well:

Wipneus

  • Citizen scientist
  • Young ice
  • Posts: 4220
    • View Profile
    • Arctische Pinguin
  • Liked: 1025
  • Likes Given: 0
Re: Latest PIOMAS update (April)
« Reply #202 on: April 08, 2014, 06:59:10 AM »
Updated, graphs are in the top post.

Wipneus

  • Citizen scientist
  • Young ice
  • Posts: 4220
    • View Profile
    • Arctische Pinguin
  • Liked: 1025
  • Likes Given: 0
Re: Latest PIOMAS update (April)
« Reply #203 on: April 08, 2014, 07:47:06 AM »
Gridded monthly thickness data has been updated as well with March 2014.

Attached are thickness maps for March 2013 and 2014, as well as the difference between them.

Wipneus

  • Citizen scientist
  • Young ice
  • Posts: 4220
    • View Profile
    • Arctische Pinguin
  • Liked: 1025
  • Likes Given: 0
Re: Latest PIOMAS update (April)
« Reply #204 on: April 08, 2014, 07:49:02 AM »
And the difference between the March-February growth (or melt) between 2014 and 2013.

jdallen

  • Young ice
  • Posts: 3406
    • View Profile
  • Liked: 646
  • Likes Given: 242
Re: Latest PIOMAS update (April)
« Reply #205 on: April 08, 2014, 08:44:19 PM »
It looks like an awful lot of our recovered volume is stacked up along the CAA.  Even with the increase in MYI, we have no broad recovery in thickness.  In fact, it looks just as vulnerable as last year.  This tends to be borne out anecdotally by the spot measurements we see at the buoys and Barneo.  I'm very anxious to see what Icebridge will tell us.  I'm not expecting any good news.
This space for Rent.

ChrisReynolds

  • Nilas ice
  • Posts: 1764
    • View Profile
    • Dosbat
  • Liked: 20
  • Likes Given: 9
Re: Latest PIOMAS update (April)
« Reply #206 on: April 08, 2014, 10:30:29 PM »
Thickness breakdowns for Beaufort/ESS/Central, and regional volume breakdowns etc here:
http://dosbat.blogspot.co.uk/2014/04/piomas-march-2014.html

Looks like we may have an exciting melt season.  ;D

Wipneus

  • Citizen scientist
  • Young ice
  • Posts: 4220
    • View Profile
    • Arctische Pinguin
  • Liked: 1025
  • Likes Given: 0
Re: Latest PIOMAS update (May)
« Reply #207 on: May 08, 2014, 05:53:59 AM »
Updated, graphs are in the top post.

(no gridded data update yet)

Wipneus

  • Citizen scientist
  • Young ice
  • Posts: 4220
    • View Profile
    • Arctische Pinguin
  • Liked: 1025
  • Likes Given: 0
Re: Latest PIOMAS update (May)
« Reply #208 on: May 08, 2014, 06:54:12 AM »
From the Polar Science Ice Volume Page


Quote
The 2014 ice volume reached its annual maximum in April  with 22,900 km3  which is just slightly below the long term trend and is the second lowest on record;  just 400 km3 above the previous April minimum which occurred in 2011.  However, variations over the last 4-years are well within the error bars of the volume estimates so that inter-annual variability over this period maybe due to errors in the sea ice reanalysis.

crandles

  • Young ice
  • Posts: 3379
    • View Profile
  • Liked: 239
  • Likes Given: 81
Re: Latest PIOMAS update (May)
« Reply #209 on: May 08, 2014, 05:07:38 PM »
Daily Max 23.104 day 105 second lowest 0.427 above day 109 2011 at 22.677.

April Average 22.931 second lowest 0.42 above April 2011.

31 March 14 at 22.609 was second lowest 0.48 above 2011.

30 April 14 at 22.94 is third lowest 0.112 above 2013's 22.828 and 0.658 above 2011's 22.282.

So April 2014 has been unusually flat, starting 0.48 above 2011 the difference reduced to 0.427 at maximum then the difference increased to 0.658 at the end of April.

Temperature was above average almost throughout month


Any reasons for unusually flat shape?
(maybe I need temperature N of 70N rather than N ot 80N?)

ChrisReynolds

  • Nilas ice
  • Posts: 1764
    • View Profile
    • Dosbat
  • Liked: 20
  • Likes Given: 9
Re: Latest PIOMAS update (May)
« Reply #210 on: May 08, 2014, 06:29:23 PM »
Crandles,

Whilst there is the usual low level surface hugging warming typical of recent years, this winter has seen substantial warming from the 1951 to 1980 baseline average (GISS baseline) up to around 500mb (north of 80degN for NCEP/NCAR).

The low level warming is due to loss of ice. But the deeper atmospheric warming of this year seems to me to be probably due to influx of warmer air - although I've not been able to conclusively demonstrate that.

jdallen

  • Young ice
  • Posts: 3406
    • View Profile
  • Liked: 646
  • Likes Given: 242
Re: Latest PIOMAS update (May)
« Reply #211 on: May 08, 2014, 07:36:32 PM »
The low level warming is due to loss of ice. But the deeper atmospheric warming of this year seems to me to be probably due to influx of warmer air - although I've not been able to conclusively demonstrate that.
Chris - I presume the heating of mid levels of the atmosphere is an unpleasant but expected climate signal?

I would imagine it would have a modest but non-trivial effect on outgoing heat transfer?
This space for Rent.

crandles

  • Young ice
  • Posts: 3379
    • View Profile
  • Liked: 239
  • Likes Given: 81
Re: Latest PIOMAS update (May)
« Reply #212 on: May 08, 2014, 08:10:17 PM »
Crandles,

Whilst there is the usual low level surface hugging warming typical of recent years, this winter has seen substantial warming from the 1951 to 1980 baseline average (GISS baseline) up to around 500mb (north of 80degN for NCEP/NCAR).

The low level warming is due to loss of ice. But the deeper atmospheric warming of this year seems to me to be probably due to influx of warmer air - although I've not been able to conclusively demonstrate that.

So are you saying that ice causes low level temperature not the other way around so I shouldn't look at temperature for an explanation?

or are you suggesting that the deeper atmospheric warmth this year should have affected ice levels so this year should have seen less up and more down? This doesn't agree with the flat PIOMAS trend in April either.

Perhaps that deeper atmospheric warmth applies over a longer timescale than just April and is an explanation for the small gain in the run up to the maximum. We haven't seen much time since the maximum and while the small loss since maximum isn't explained by this, over a short period there can be lots of possible explanations?

lanevn

  • New ice
  • Posts: 91
    • View Profile
  • Liked: 0
  • Likes Given: 0
Re: Latest PIOMAS update (May)
« Reply #213 on: May 08, 2014, 08:15:32 PM »
@crandles

April 2014 were colder than april 2013 for that graph, so it is normal that it lost his second place.

crandles

  • Young ice
  • Posts: 3379
    • View Profile
  • Liked: 239
  • Likes Given: 81
Re: Latest PIOMAS update (May)
« Reply #214 on: May 08, 2014, 08:32:04 PM »
@crandles

April 2014 were colder than April 2013 for that graph, so it is normal that it lost his second place.

Good point thanks.

The end of April 2011 was also warmer than in 2014 potentially accounting for an increase in the gap.

The end of April 2012 was cooler but the gap has if anything narrowed rather than widened so I guess we cannot fully explain deviations like this but it could be a good part of the explanations necessary.

ChrisReynolds

  • Nilas ice
  • Posts: 1764
    • View Profile
    • Dosbat
  • Liked: 20
  • Likes Given: 9
Re: Latest PIOMAS update (May)
« Reply #215 on: May 08, 2014, 09:46:25 PM »
I've just blogged, so can post images now.

JDAllen,

Not a climate signal, just weather. Even in recent years above about 900mb there are cold and warm winters. The low level warming in the following graphic is due to 1) the breakdown of the calimatological (i.e. typical) inversion, 2) surface sourced heat flux due to thinner ice (which in part causes 1).


Crandles,

There's a two way effect. However summer (including spring) melt losses are, as you know, countered by winter (including autumn volume gains).


While at the same time winter warming is racing ahead of summer warming.


So it is clear that while we should expect some kind of impact on winter volume gains due to the winter warming, we aren't. So I think the only answer to this is that winter warming at the surface is caused mainly by open water and thinner ice, it is not causing that. Amidst this warming the overall change in volume gain over winter as been an increase.

However with regards this year (damn - forgot to add this to my blog post) - Francis & Hunter find that downwelling longwave (DLR) impacts the ice edge in summer, other research shows DLR is a strong factor in ice loss in models. Warming aloft should be expected to increase DLR, so I suspect the upper atmosphere (900 to 500mb) warming may have played a role in limiting thickening this year.

For comparison I've uploaded JFM 2013 and 2012...


crandles

  • Young ice
  • Posts: 3379
    • View Profile
  • Liked: 239
  • Likes Given: 81
Re: Latest PIOMAS update (May)
« Reply #216 on: May 08, 2014, 10:18:20 PM »

So it is clear that while we should expect some kind of impact on winter volume gains due to the winter warming, we aren't. So I think the only answer to this is that winter warming at the surface is caused mainly by open water and thinner ice, it is not causing that. Amidst this warming the overall change in volume gain over winter as been an increase.


I think the prime effect on volume gain is that if you start from a lower minimum then you get a larger gain. So rather than work in terms of what affects volume gain, it is much better to work with volume maximum.

This years volume maximum appears lower than 2012 and 2013, but perhaps we should expect more difference. How does 2014 NCEP/NCAR reanalysis temperature given above compare with 2011 if that isn't too much trouble?


Steven

  • Grease ice
  • Posts: 957
    • View Profile
    • Arctic sea ice data and graphs
  • Liked: 481
  • Likes Given: 19
Re: Latest PIOMAS update (May)
« Reply #217 on: May 08, 2014, 11:50:48 PM »
The end of April 2011 was also warmer than in 2014 potentially accounting for an increase in the gap.

The end of April 2012 was cooler but the gap has if anything narrowed rather than widened so I guess we cannot fully explain deviations like this but it could be a good part of the explanations necessary.

CT sea ice area decreased rapidly around the middle of April 2014,  but slowed down and plateaued during the last part of April.  So the "flat" shape of the PIOMAS curve for April 2014 may be partly due to weather conditions near the edges of the ice.

In contrast, the other years in the 2010s had a big decrease of CT area in the last 10 days of April.

jdallen

  • Young ice
  • Posts: 3406
    • View Profile
  • Liked: 646
  • Likes Given: 242
Re: Latest PIOMAS update (May)
« Reply #218 on: May 09, 2014, 12:18:42 AM »
Magnificently illustrated as typical, Chris. Thank you!
This space for Rent.

ChrisReynolds

  • Nilas ice
  • Posts: 1764
    • View Profile
    • Dosbat
  • Liked: 20
  • Likes Given: 9
Re: Latest PIOMAS update (May)
« Reply #219 on: May 10, 2014, 09:51:59 AM »

So it is clear that while we should expect some kind of impact on winter volume gains due to the winter warming, we aren't. So I think the only answer to this is that winter warming at the surface is caused mainly by open water and thinner ice, it is not causing that. Amidst this warming the overall change in volume gain over winter as been an increase.


I think the prime effect on volume gain is that if you start from a lower minimum then you get a larger gain. So rather than work in terms of what affects volume gain, it is much better to work with volume maximum.

This years volume maximum appears lower than 2012 and 2013, but perhaps we should expect more difference. How does 2014 NCEP/NCAR reanalysis temperature given above compare with 2011 if that isn't too much trouble?

The overall multi-year trend shows the impact of reducing summer volume on the following freeze season gain. This years freeze season gain hasn't been as large as recent years, so looking for the effects of warming on that seems to be swamped by the signal of the growth response to reduced summer volume.

However similarly the overall surface warming has climbed so much over winter that it doesn't seem to me to be a major factor in determining end of winter peak volume.

What temperatures do you need? A quick snapshot of the lower atmospheric column would seem to me to be surface, 850mb, 500mb - would this be OK?

Steven,

That seems reasonable, notably up to end May there is still some thickening in parts of the central Arctic Ocean in most years.

JD Allen,

I just hope it was useful, thanks.

ghoti

  • Grease ice
  • Posts: 767
    • View Profile
  • Liked: 12
  • Likes Given: 15
Re: Latest PIOMAS update (May)
« Reply #220 on: May 10, 2014, 07:28:19 PM »
On a press conference webcast from the European Geophysical Union meetings  near the end of April data was presented showing a good correlation between freezing degree days (FDD) and maximum ice volume. Seems obvious to me. The FDD charts for the post satellite era look the same as the PIOMASS max volume charts for the same period. I wish I remembered the presenter's name so I could find a reference.

In any case, winter temperatures were above average the entire freezing season this year so it is no surprise that volume increase was lower.

OSweetMrMath

  • Frazil ice
  • Posts: 137
    • View Profile
  • Liked: 0
  • Likes Given: 0
Re: Latest PIOMAS update (May)
« Reply #221 on: May 11, 2014, 08:32:48 AM »
I've been doing some experimenting with modeling PIOMAS as a SARIMA time series, and I have some results to share. This graph shows the last few years of PIOMAS data in black, with predictions through 2016 in red. The dashed lines are (nominal) 95% confidence intervals on the predictions. The year tick marks indicate January of each year.

The prediction of greatest interest is probably the volume in September. The predicted value for this year is 4.6 x 10^3 km^3, and the 95% confidence interval is 2.9 - 6.3 x 10^3 km^3. Note that the confidence interval size is nominally 95%, but based on previous years, this interval is too small. In practice, this is an 85% confidence interval, and a 95% confidence interval would be approximately 50% larger, or 2.1 - 7.2 x 10^3 km^3.

Also, note that when the smaller interval fails to accurately predict the September ice volume, the prediction is usually too high.

Steven

  • Grease ice
  • Posts: 957
    • View Profile
    • Arctic sea ice data and graphs
  • Liked: 481
  • Likes Given: 19
Re: Latest PIOMAS update (May)
« Reply #222 on: May 11, 2014, 05:30:25 PM »
I wish I remembered the presenter's name so I could find a reference.

Perhaps it's in the Press Conference webstream "PC3: The changing Arctic":

http://client.cntv.at/EGU2014/?play=24

Second speaker Jean-Claude Gascard between minutes 12 and 14 of the video shows some maps of "Freezing Degree Days" for 4 different freezing seasons, and next shows a graph of "ice volume produced in winter calculated from FDD".  His presentation slides and abstract are here  (search for "Gascard")

Steven

  • Grease ice
  • Posts: 957
    • View Profile
    • Arctic sea ice data and graphs
  • Liked: 481
  • Likes Given: 19
Re: Latest PIOMAS update (May)
« Reply #223 on: May 11, 2014, 06:13:45 PM »
So I think the only answer to this is that winter warming at the surface is caused mainly by open water and thinner ice, it is not causing that.

Chris, thanks for your comments above and for your blog post.  My understanding is that there are other amplifying factors which are also very important, e.g. in the Pithan/Mauritsen paper that was discussed some time ago in another thread.  (It's probably more on-topic there than here.)  Here's a link to the pdf of the paper.  There's also an article about it on LiveScience.com.  It looks very interesting to me.
 

ChrisReynolds

  • Nilas ice
  • Posts: 1764
    • View Profile
    • Dosbat
  • Liked: 20
  • Likes Given: 9
Re: Latest PIOMAS update (May)
« Reply #224 on: May 11, 2014, 07:46:52 PM »
Steven,

Pithan/Mauritsen look at ice/snow albedo feedback, this is not a factor north of 80degN over autumn/winter, however they may be considering the winter warming as resultant from ice/albedo feedback through release of ocean heat - I may have missed it but I don't think that's clear. I don't doubt that Plank emission needs a higher temperature increase at lower temperatures to achieve the same increase of emission as at higher temperatures. I just doubt it is the major player in winter warming.

The greatest anomalous warming in the annual cycle is over the dark months in both NCEP/NCAR and ERA Interim. The climatological mean temperature profile with height from 2007 to 2012 is shown below (NCEP/NCAR) relative to a 1951 to 1980 baseline.


This shows a very low level massive warming, which I have argued is due to thinning of sea ice.
http://dosbat.blogspot.co.uk/2013/10/winter-warming-and-sea-ice-thinning.html

Using a grid box covering part of the Siberian Arctic it is seen that winter surface temperature and PIOMAS thickness track each other closely.


Because NCEP/NCAR is used in PIOMAS it may be thought that this close relationship is due to winter thickening reducing with the warming. However a substantial proportion of the thinning is due to loss of MYI, not thermodynamic thinning. For example here are the DAM plots for Jan 1984 and Jan 2013
ftp://ccar.colorado.edu/pub/tschudi/iceage/gifs/age1984_01.gif
ftp://ccar.colorado.edu/pub/tschudi/iceage/gifs/age2013_01.gif
And for the same region used in the above linked blog post, here is the percentage contribtion to overall volume for grid boxes above and below 2m thick in December (a reasonable proxy for MYI and FYI)


I calculate that the combined thinning of ice and warming of atmosphere, has increased heat flux through the ice by something of the order of 50%.


So in line with Screen and Simmonds I think the major player in reality is the thinning of ice over winter due to the transition from a mainly MYI to a mainly FYI cover.

Nightvid Cole

  • Frazil ice
  • Posts: 438
    • View Profile
  • Liked: 5
  • Likes Given: 0
Re: Latest PIOMAS update (May)
« Reply #225 on: May 11, 2014, 08:48:12 PM »
Steven,

Pithan/Mauritsen look at ice/snow albedo feedback, this is not a factor north of 80degN over autumn/winter, however they may be considering the winter warming as resultant from ice/albedo feedback through release of ocean heat - I may have missed it but I don't think that's clear. I don't doubt that Plank emission needs a higher temperature increase at lower temperatures to achieve the same increase of emission as at higher temperatures. I just doubt it is the major player in winter warming.

The greatest anomalous warming in the annual cycle is over the dark months in both NCEP/NCAR and ERA Interim. The climatological mean temperature profile with height from 2007 to 2012 is shown below (NCEP/NCAR) relative to a 1951 to 1980 baseline.


This shows a very low level massive warming, which I have argued is due to thinning of sea ice.
http://dosbat.blogspot.co.uk/2013/10/winter-warming-and-sea-ice-thinning.html

Using a grid box covering part of the Siberian Arctic it is seen that winter surface temperature and PIOMAS thickness track each other closely.


Because NCEP/NCAR is used in PIOMAS it may be thought that this close relationship is due to winter thickening reducing with the warming. However a substantial proportion of the thinning is due to loss of MYI, not thermodynamic thinning. For example here are the DAM plots for Jan 1984 and Jan 2013
ftp://ccar.colorado.edu/pub/tschudi/iceage/gifs/age1984_01.gif
ftp://ccar.colorado.edu/pub/tschudi/iceage/gifs/age2013_01.gif
And for the same region used in the above linked blog post, here is the percentage contribtion to overall volume for grid boxes above and below 2m thick in December (a reasonable proxy for MYI and FYI)


I calculate that the combined thinning of ice and warming of atmosphere, has increased heat flux through the ice by something of the order of 50%.


So in line with Screen and Simmonds I think the major player in reality is the thinning of ice over winter due to the transition from a mainly MYI to a mainly FYI cover.

If this explanation were correct, wouldn't we expect to see greater temperature anomalies in November than we do in March or April, since the ice is thinner?

Steven

  • Grease ice
  • Posts: 957
    • View Profile
    • Arctic sea ice data and graphs
  • Liked: 481
  • Likes Given: 19
Re: Latest PIOMAS update (May)
« Reply #226 on: May 11, 2014, 10:04:44 PM »
Chris, yes I think Pithan/Mauritsen take into account the "delayed" effect of the albedo feedback.  They say in the paper: 

Quote
Seasonal heat storage in the ocean, including latent heat of melting sea ice, mitigates about two-thirds of the summertime effect of surface albedo change.  Heat from the ocean is released to the atmosphere in winter, which in combination with the positive lapse-rate feedback causes the well-known pattern of winter-amplified Arctic warming.

The bolded sentence in this quote (bold mine) seems consistent with the feedbacks called "ocean" and "albedo" in Fig. 2b.  That figure shows the contribution of each feedback from a top of atmosphere perspective; Fig 2c is from a surface perspective, which is probably somewhat more relevant for the Arctic sea ice.

I need to think a bit more about your last comment and the references you gave.
« Last Edit: May 12, 2014, 11:53:20 AM by Steven »

Neven

  • Administrator
  • First-year ice
  • Posts: 9433
    • View Profile
    • Arctic Sea Ice Blog
  • Liked: 1333
  • Likes Given: 617
Re: Latest PIOMAS update (May)
« Reply #227 on: May 11, 2014, 10:15:19 PM »
I have to approve comments by new members before they show up, and so someone might miss this one:

I've been doing some experimenting with modeling PIOMAS as a SARIMA time series, and I have some results to share. This graph shows the last few years of PIOMAS data in black, with predictions through 2016 in red. The dashed lines are (nominal) 95% confidence intervals on the predictions. The year tick marks indicate January of each year.

The prediction of greatest interest is probably the volume in September. The predicted value for this year is 4.6 x 10^3 km^3, and the 95% confidence interval is 2.9 - 6.3 x 10^3 km^3. Note that the confidence interval size is nominally 95%, but based on previous years, this interval is too small. In practice, this is an 85% confidence interval, and a 95% confidence interval would be approximately 50% larger, or 2.1 - 7.2 x 10^3 km^3.

Also, note that when the smaller interval fails to accurately predict the September ice volume, the prediction is usually too high.

The enemy is within
Don't confuse me with him

E. Smith

wili

  • Young ice
  • Posts: 3342
    • View Profile
  • Liked: 602
  • Likes Given: 409
Re: Latest PIOMAS update (May)
« Reply #228 on: May 12, 2014, 05:47:56 PM »
Nice graph, OSMM.

If I read it right, the lower end of predictions for September 2016 would looks like about one thousand cubic meters. If my always meager maths haven't completely failed me, that would translate to one million square meters of meter-thick ice, or what most have accepted to be the 
"essentially ice free" measure.
"A force de chercher de bonnes raisons, on en trouve; on les dit; et après on y tient, non pas tant parce qu'elles sont bonnes que pour ne pas se démentir." Choderlos de Laclos "You struggle to come up with some valid reasons, then cling to them, not because they're good, but just to not back down."

jai mitchell

  • Nilas ice
  • Posts: 2356
    • View Profile
  • Liked: 207
  • Likes Given: 60
Re: Latest PIOMAS update (May)
« Reply #229 on: May 12, 2014, 06:47:44 PM »
Steven, Chris,

For what it is worth, my reading of Pithan-Mauritsen is that the increased moist adiabatic lapse rate feedback is equal to the summer ice albedo feedback.  The models for arctic amplification hold that winter warming will be greater than summer warming and we see that now.  I was always under the assumption that increased relative humidity in winter was the cause.

paleoclimate analysis of the Eocene holds that this area did not go below freezing in winter due to high humidity during this period.   

from a strict observational analysis of this last winter, a shift in the jet stream produced a wobble in the polar vortex   This is why Alaska had one of its warmest winters on record, extreme warm air moving north from the pacific due to the blocking system (the same that produced the droughts in California all last year) forced colder air out of the arctic.

This animation shows the actual Jetstream on January 6th, notice how the warm air is being pushed up into the arctic circle on the bearing strait and Svalbard sides of the arctic.

http://earth.nullschool.net/#2014/01/06/1500Z/wind/isobaric/850hPa/overlay=temp/orthographic=270.11,63.45,434

I don't believe that this can be attributed to low ice thickness or area.  I would attribute it to the pacific blocking pattern and a low pressure development over Hudson bay.
Haiku of Futures Passed
My "burning embers"
are not tri-color bar graphs
+3C today

ChrisReynolds

  • Nilas ice
  • Posts: 1764
    • View Profile
    • Dosbat
  • Liked: 20
  • Likes Given: 9
Re: Latest PIOMAS update (May)
« Reply #230 on: May 12, 2014, 08:08:29 PM »
Nightvid,

Here are the monthly anomalies (1951 to 1980 baseline) average from 2007 onwards.

Jan   3.042
Feb   3.954
Mar   3.377
Apr   3.520
May   2.655
Jun   0.188
Jul   0.000
Aug   0.270
Sep   3.948
Oct   6.120 -highest
Nov   4.316 -second highest
Dec   3.982

We do indeed see the greatest warming anomalies in the early autumn.

ChrisReynolds

  • Nilas ice
  • Posts: 1764
    • View Profile
    • Dosbat
  • Liked: 20
  • Likes Given: 9
Re: Latest PIOMAS update (May)
« Reply #231 on: May 12, 2014, 08:15:21 PM »
Steven,

From my reading it just wasn't clear exactly how the autumn/winter energy release was handled or considered. I had read what you referenced but couldn't figure out how it was factored in. That said a chunk of the methods was out of my grasp.

Jai,

As I say in my most recent blog post, and up thread, I see this winter's warmth as being due to atmospheric heat transport into the Arctic from lower latitudes. The surface hugging warming due to thin ice is apparent, but there is also a deeper warming from over 500mb downwards which is not seen in other years.

Andreas T

  • Nilas ice
  • Posts: 1149
    • View Profile
  • Liked: 18
  • Likes Given: 4
Re: Latest PIOMAS update (May)
« Reply #232 on: May 12, 2014, 09:35:13 PM »
Thinner ice which has water nearer the ice surface, does of course raise surface temperatures but must also, if everything else is unchanged, increase heat loss from that surface and therefore cooling and freezing of that water. That is, I believe, the effect seen in models (I recall a discussion on real climate some time ago) where an artificially icefree arctic returns to an ice covered one in not many years.
What Pithan and Mauritsen report is that changes in outgoing radiation from the surface have a strong effect on surface temperatures in the arctic. That would mean that the warmer (i.e. less cold) winter temperatures you point to near the surface can be the cause of less thickening of the ice rather than the consequence of thin ice.
This is of course complicated by the fact that the most substantial reduction in thickness is occurring over several seasons. So autumn ice thickness is low because of both increased summer melt and reduced winter freeze. I understand them as saying reduced winter freeze does not have to mean reduced growth compared to previous winters (you have the numbers) but reduced growth compared to what it should be at this ice thickness. They don't say that literally, but it is implied in what they are saying about warming being constituted by changes in heat fluxes and also by changes in where temperature gradients are found. I am thinking for example of their point about low clouds which increase temperatures on the surface but loose heat from their tops at the same rate as the surface did previously.
When attributing warming it makes a big difference whether one talks about higher than previous temperatures or changes in heat fluxes.

OSweetMrMath

  • Frazil ice
  • Posts: 137
    • View Profile
  • Liked: 0
  • Likes Given: 0
Re: Latest PIOMAS update (May)
« Reply #233 on: May 13, 2014, 01:47:52 AM »
Neven,

Thanks for reposting my post. One thing I didn't state, but is probably clear from the graph, is that this is based on the monthly data. The results probably would not differ greatly if I used the daily data instead.

wili,

A couple of points in response. The reliability of predictions is dependent on the goodness of fit of the model, and unfortunately, this model isn't that good.

The model assumptions of a SARIMA model are that the next month's value can be written as a weighted sum of all previous months, plus a noise term. The monthly noise is assumed to be constant variance and uncorrelated with the noise from all previous months.

The best model I can find (I used a (3,0,0)x(1,1,1) model) has noise with an increasing variance and no short term correlations, but longer term correlations are nonzero. Bigger models don't do much better, and this model is already bigger than I would like anyway.

What this means in practice is that the predictions out to a year or so probably aren't terrible, but the reliability goes down beyond that, so I'm not sure it makes much sense to look at the predictions for 2016.

If you do look at the prediction for September 2016, the minimum value for the confidence interval is 1.3 x 10^3 km^3. Keeping in mind that the confidence intervals are probably too small, this means that there is some non-zero probability that the ice minimum in 2016 will be less than 1000 km^3.

(But this interpretation is a Bayesian interpretation of a frequentist model, which is kind of sketchy from a statistical standpoint. Coming from a frequentist model, the correct interpretation of the confidence interval is a probability statement about the model. The interpretation above is making a probability statement about the ice volume.)

On the other hand, the model also states that there is an equal probability that the ice minimum in 2016 will be above 8500 km^3. Based on the record up to this point, I do not think these two probabilities are in fact equal.

Neven

  • Administrator
  • First-year ice
  • Posts: 9433
    • View Profile
    • Arctic Sea Ice Blog
  • Liked: 1333
  • Likes Given: 617
Re: Latest PIOMAS update (May)
« Reply #234 on: May 13, 2014, 02:33:20 AM »
Quote
Thanks for reposting my post.

You're welcome. I have to approve the first 3 posts by new members (as an anti-spam measure) and after that their comments show up immediately.
The enemy is within
Don't confuse me with him

E. Smith

Wipneus

  • Citizen scientist
  • Young ice
  • Posts: 4220
    • View Profile
    • Arctische Pinguin
  • Liked: 1025
  • Likes Given: 0
Re: Latest PIOMAS update (May)
« Reply #235 on: May 13, 2014, 09:38:02 AM »
Back online after the main telephone in my street was cut by construction work. It may well happen again as the works will probably continue into 2015.

Anyway, here are the delayed maps created from PIOMAS gridded data. First the April thickness maps  of 2013 and 2014 as well as the differences.

Wipneus

  • Citizen scientist
  • Young ice
  • Posts: 4220
    • View Profile
    • Arctische Pinguin
  • Liked: 1025
  • Likes Given: 0
Re: Latest PIOMAS update (May)
« Reply #236 on: May 13, 2014, 09:42:22 AM »
And here the differences in growth between 2013 and 2014.

(I will have to change the term "growth" to something else next month. Negative growth gets too confusing, would "gains/losses" be better?)


crandles

  • Young ice
  • Posts: 3379
    • View Profile
  • Liked: 239
  • Likes Given: 81
Re: Latest PIOMAS update (May)
« Reply #237 on: May 13, 2014, 02:53:53 PM »
I am thinking the comparison to 2013 may become increasingly irrelevant.

Perhaps 2011 and 2012 thickness maps (and perhaps difference to 2014) would be more relevant &/or useful additions?

Gains/losses difference is OK but perhaps add that red represent less loss of ice this year in the melt season and say red represent more gain of ice this year in freeze season.

Great work as always.

Shared Humanity

  • Guest
Re: Latest PIOMAS update (May)
« Reply #238 on: May 13, 2014, 04:10:13 PM »
Nightvid,

Here are the monthly anomalies (1951 to 1980 baseline) average from 2007 onwards.

Jan   3.042
Feb   3.954
Mar   3.377
Apr   3.520
May   2.655
Jun   0.188
Jul   0.000
Aug   0.270
Sep   3.948
Oct   6.120 -highest
Nov   4.316 -second highest
Dec   3.982

We do indeed see the greatest warming anomalies in the early autumn.

If you consider that the 4 seasons are more a function of the summer and winter solstice and the spring and fall equinox, I would call this late autumn/early winter.

This raises a question for me. I wonder what all of the arctic measurement seasonal trends would look like if we considered these to be the center points of their respective seasons instead of the start points. Would we gain any insights?

ChrisReynolds

  • Nilas ice
  • Posts: 1764
    • View Profile
    • Dosbat
  • Liked: 20
  • Likes Given: 9
Re: Latest PIOMAS update (May)
« Reply #239 on: May 13, 2014, 10:57:05 PM »
New post up with analysis of starting conditions for the 2014 season.
http://dosbat.blogspot.co.uk/2014/05/piomas-april-2014-gridded-data.html

Looking good for something exciting.  ;D

It's well past my bedtime, I'll reply to comments above tomorrow.

OSweetMrMath

  • Frazil ice
  • Posts: 137
    • View Profile
  • Liked: 0
  • Likes Given: 0
Re: Latest PIOMAS update (May)
« Reply #240 on: May 15, 2014, 11:37:44 PM »
I've done some more statistical regression and prediction on the PIOMAS monthly data. This time I took the average of the monthly values for each month over the period 1981-2010 as a baseline, and subtracted that from the PIOMAS data to get a monthly anomaly. I fit the anomaly with a smoothing spline, and then used that to predict future ice volumes.

Note that splines tend to have high variance at the ends of the data interval, so the ends of the spline should not be overinterpreted. Prediction of future values is inherently overinterpreting the end of the spline, so the confidence intervals (not computed) should be assumed to be quite large.

The predicted value for September is similar to the predicted value from my previous post using the SARIMA time series model, at 4600 km^3. The spline approach appears to underestimate the size of the annual cycle, but predicts a continuing decreasing trend in ice volume, unlike the SARIMA model.

ChrisReynolds

  • Nilas ice
  • Posts: 1764
    • View Profile
    • Dosbat
  • Liked: 20
  • Likes Given: 9
Re: Latest PIOMAS update (May)
« Reply #241 on: May 16, 2014, 08:51:19 PM »
OSweetMrMath,

Thanks interesting. Monthly anomalies are deviations per month from an average seasonal cycle for some past baseline period (for what it's worth I use 1980 to 1999). Given that behaviour within the annual cycle can vary, for example there are different behaviours of anomalies in April, June and October, does it make physical sense to concatenate the monthly anomalies into an anomaly from the past average seasonal cycle?

Would it not make more sense from a physical perspective to analyse each seperately or indeed to work with seasonal amomalies?

I know PIOMAS use an anomaly timeseries using all days of data available in their main anomaly graph. I've just never been persuaded it's meaningful to analyse a series of anomalies in that way. When looking at the daily anomalies I use I tend to work across common points in the seasonal cycle (be it individual days, months or seasons (formal or ad hoc)) when analysing changes with time.

OSweetMrMath

  • Frazil ice
  • Posts: 137
    • View Profile
  • Liked: 0
  • Likes Given: 0
Re: Latest PIOMAS update (May)
« Reply #242 on: May 17, 2014, 01:20:39 AM »
Chris,

I've done a little formal study of time series, but I'm by no means an expert, so don't take my comments as the voice of authority. It's fairly standard in time series analysis to consider the time series as a sum of three components, the trend, the seasonal (or periodic) component, and the random noise. The goal is to estimate the trend and the seasonal component from the data, and if done well, whatever is left over should look like random noise.

If you compute an estimate of the seasonal component and subtract it from the full data, you have left the trend + the estimated noise. Because the seasonal component is an estimate, the remaining noise is also an estimate, so there's at least the potential that the estimated noise is larger than the true noise. But if the assumption that the seasonal component is periodic is a good assumption, then the estimated noise is approximately the same magnitude as the true noise.

If the periodic assumption is good, you can then use the entire time series to estimate the trend. This is in contrast to building a separate time series for each month and estimating the trend of each individually. For the individual estimates, you have less data, so the estimate is less accurate, and there's at least the potential for the estimates to be inconsistent.

So how do we know whether the periodic assumption is good? Well, we can try running the data analysis using just one month's data, and see if the results are better or worse than using the full data. Below I have a graph of the September PIOMAS data, along with an ARIMA forecast (in red, with confidence intervals as dashed lines) and a spline regression (in blue). The ARIMA forecast for September 2014 is 5000 km^3, with a 95% confidence interval of 2200-7700 km^3. The spline regression forecast for September 2014 is 3600 km^3. I haven't attempted to compute a confidence interval for the spline regression, but it is likely to be very large.

The ARIMA forecast is greater than the SARIMA forecast (from my earlier post), and also has a larger confidence interval. Essentially, the ARIMA forecast is greater than the SARIMA forecast because it doesn't know that the April volume is low, and the confidence interval is wider because it's just less accurate. I don't put a lot of value in the spline regression forecasts, but I think it's worth observing that that the spline forecast on the full data set is very close to the SARIMA forecast, but the spline forecast on just the September data is much lower than the ARIMA forecast.

« Last Edit: May 17, 2014, 01:36:17 AM by OSweetMrMath »

OSweetMrMath

  • Frazil ice
  • Posts: 137
    • View Profile
  • Liked: 0
  • Likes Given: 0
Re: Latest PIOMAS update (May)
« Reply #243 on: May 18, 2014, 06:50:26 AM »
I was thinking that the SARIMA and ARIMA forecasts I posted earlier looked a little off. I found some online discussion which confirmed my suspicion, which is that the R function arima() does not handle trends well. So I've redone both graphs with corrected forecasts. For the corrected forecasts, the SARIMA forecast for September, using all of the PIOMAS data is 4700 km^3, with 95% CI 3000-6300 km^3. The ARIMA forecast for September, using just the September PIOMAS data, is 4300 km^3, with 95% CI 1800-6700 km^3. This is assuming that I haven't introduced any new computation errors as I've corrected my previous errors.

On further thought, the confidence intervals on the SARIMA forecast are not correct starting at April 2015 and going into the future. They should be larger.  :P

Edit: I've corrected the confidence intervals and updated the graph. Hopefully now I'm doing everything correctly.
« Last Edit: May 18, 2014, 11:12:51 PM by OSweetMrMath »

ChrisReynolds

  • Nilas ice
  • Posts: 1764
    • View Profile
    • Dosbat
  • Liked: 20
  • Likes Given: 9
Re: Latest PIOMAS update (May)
« Reply #244 on: May 18, 2014, 09:45:57 AM »
OMrSweetMath,

Thanks. I'm also no expert on timeseries analysis (I hadn't even heard of SARIMA). But I wonder if the increase in statistical confidence gained by using all months for all years as anomalies is sound. You find that the spline forecast on just September data is lower than that using all months, this is to be expected because September volume is declining faster than April (with a range of declines between those months spanning those extremes). So in this case I wonder if the higher confidence gained from using a longer series is illusory and if the result of prediction using all months will consistently overshoot the actual September volume.

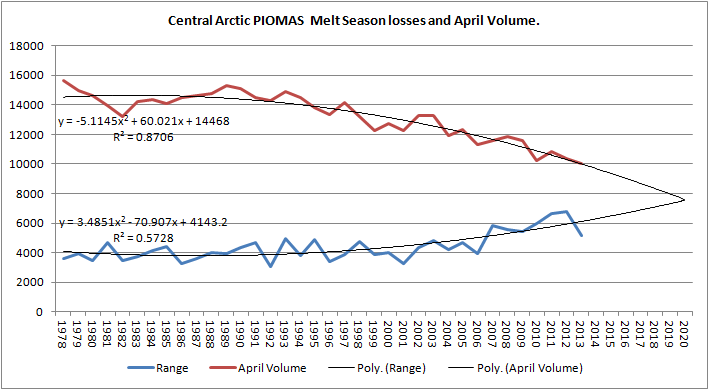
I've suggested recently that we might see a reduction of loss rates in April volume because much of the past decline in volume has been from loss of thicker multi-year ice (ice which has survived more than one season). However the pack is reaching a state where it is mainly first year ice (new ice which has grown since the previous September).

Continuing melt season losses and April peak volume for the Arctic Ocean into the future, and the two curves meet in around 2020. When the curves meet it implies that April volume is equal to melt season losses resulting in virtually* no ice by September. *allow 'wiggle room' for weather impacts!


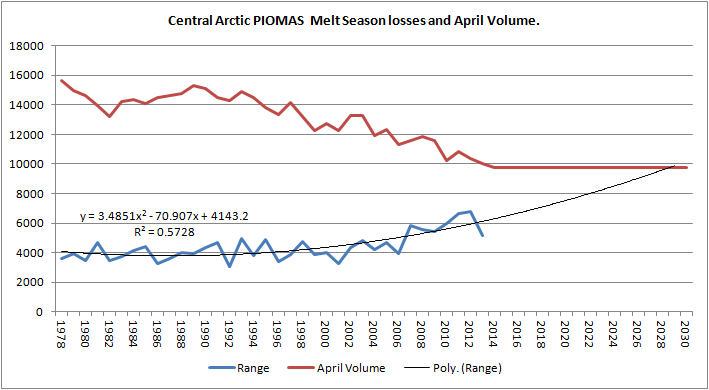
However if the Central Arctic ceases to lose volume in April because it hits a 'floor' of around 2m thick, and the above plot becomes....


The reason I raise this issue is that such a feasible underlying physical process might exacerbate the potential problem I see with using all months in forming the trend.

I've previously compared NSIDC Extent and PIOMAS volume - the extent & volume at the days of volume maximum in April and extent minimum in September. These should be related due to open water formation efficiency - the thinner ice gets the more open water can be exposed by a given melt.


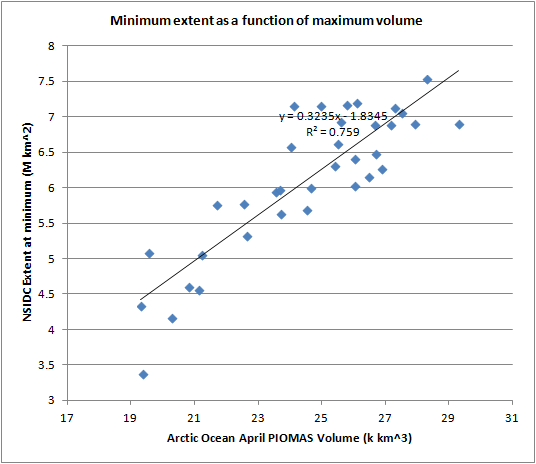
Regressing the two produces quite a strong R2. However using interannual differences to effectively detrend* produces no residual relationship. *(actually the following answers the question - what is the relationship between interannual changes of volume in April and interannual changes of extent in September)


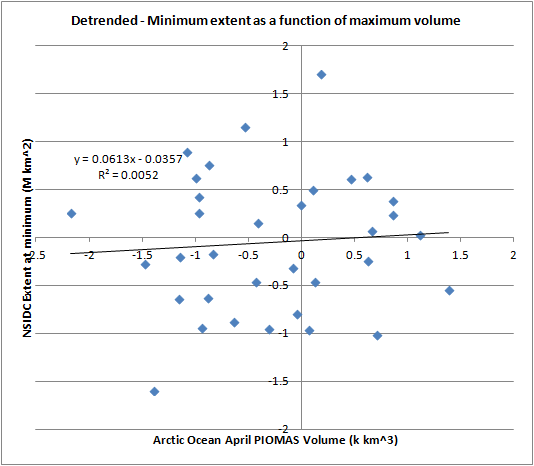
OK, strictly I should use the relationship in the first scatter plot to develop a series of residuals and present those, but I've not updated that, I did do it some years ago. What I've had problems with is 'explaining' the residuals using indices such as temperature of the mid troposphere, Arctic Oscillation, Pacific/North American index etc..

In terms of prediction I think accounting for the residuals in the past series is the key. Whether the factors involved in those residuals can then be explained is another question entirely!

The reason I posted those two scatter plots is that I see initial volume (aka thickness) in April  as mainly explaining the trend, and not being a good predictor of variation around the trend.


If you do want to slew the conversation more firmly in the direction of prediction, there's a prediction thread we could move to here.
http://forum.arctic-sea-ice.net/index.php/topic,696.0.html

Although strictly, IMO, prediction of this year is reasonable fallout from the April data, until May data is released.
« Last Edit: May 18, 2014, 09:54:13 AM by ChrisReynolds »

Shared Humanity

  • Guest
Re: Latest PIOMAS update (May)
« Reply #245 on: May 18, 2014, 01:31:29 PM »
CR.....

I love this melt season losses vs. April volume analysis. Looking at the 1st 2 charts, it seems to suggest that the most pessimistic forecasts for an ice free Arctic by 2030 might play out. The 2nd chart certainly suggests this but I do have a question.

What is the reason you have for April volume hitting a floor? Is this simply the result of the freeze volume preceding the melt or does it include a persistent MYI remnant along the CA? If it is the latter couldn't we also see a floor in the melt season as this persistent MYI just refuses to melt?

In this case it could be much later that the two actually meet.

crandles

  • Young ice
  • Posts: 3379
    • View Profile
  • Liked: 239
  • Likes Given: 81
Re: Latest PIOMAS update (May)
« Reply #246 on: May 18, 2014, 08:35:57 PM »
CR.....

I love this melt season losses vs. April volume analysis. Looking at the 1st 2 charts, it seems to suggest that the most pessimistic forecasts for an ice free Arctic by 2030 might play out. The 2nd chart certainly suggests this but I do have a question.

What is the reason you have for April volume hitting a floor? Is this simply the result of the freeze volume preceding the melt or does it include a persistent MYI remnant along the CA? If it is the latter couldn't we also see a floor in the melt season as this persistent MYI just refuses to melt?

In this case it could be much later that the two actually meet.

Wrong CR but


The thick MYI ice has been thinning fast as it converts to FYI or is simply less old and has had less time to thicken mechanically. FYI has been thinning slowly and the very marginal ice zones where thickness rarely gets to 1m have hardly been thinning at all.

As we run out of MYI that is a lot thicker than FYI, then I think there is a good argument for the rate of decline to reduce to the rate of FYI thinning.

Why there would be a floor rather than a decline in rate to that of FYI isn't clear to me. You could perhaps add some other reasons like
1. River run-off not reaching the hard to melt areas.
2. What we have seen in the way of areas opening up is only areas where ice is moving out and it may be a different story when we get to areas where ice moves in from other areas.
3. Upward heat flux may have increased noticeably in shallow areas and less so in deeper areas.
4. All excess heat built up in ocean in summer gets vented to space before freeze up and there is enough time in winter for the ice to build back up to thermal equilibrium thickness.

For Chris Reynolds views, have you seen Chris Reynolds discussion at
http://dosbat.blogspot.co.uk/2014/04/what-is-future-of-arctic-sea-ice-part-2.html

OSweetMrMath

  • Frazil ice
  • Posts: 137
    • View Profile
  • Liked: 0
  • Likes Given: 0
Re: Latest PIOMAS update (May)
« Reply #247 on: May 19, 2014, 01:31:27 AM »
Following Chris Reynolds's suggestion, I've posted my response to him on the Predicting PIOMAS Max Volume thread at http://forum.arctic-sea-ice.net/index.php/topic,696.0.html . My post is long, but the one sentence summary is that using the anomaly data has a better outcome in terms of the bias-variance tradeoff than using the data from each month separately.

crandles

  • Young ice
  • Posts: 3379
    • View Profile
  • Liked: 239
  • Likes Given: 81
Re: Latest PIOMAS update (May)
« Reply #248 on: June 03, 2014, 11:54:22 PM »
Day 151 31 May:
2014 20.288 4th lowest
2013 20.498
2012 19.591 2nd lowest
2011 19.483 lowest
2010 20.229 3rd lowest
2009 22.431
2008 22.878
2007 21.891

Average for May 2014 21.872 also 4th lowest but behind 2011, 2012 and 2013

Neven

  • Administrator
  • First-year ice
  • Posts: 9433
    • View Profile
    • Arctic Sea Ice Blog
  • Liked: 1333
  • Likes Given: 617
Re: Latest PIOMAS update (May)
« Reply #249 on: June 04, 2014, 12:16:37 AM »
Latest update is on the ASIB, with a bonus from the NSIDC.
The enemy is within
Don't confuse me with him

E. Smith