Support the Arctic Sea Ice Forum and Blog

Author Topic: Latest PIOMAS Volume update  (Read 1909246 times)

Wipneus

  • Citizen scientist
  • Young ice
  • Posts: 4220
    • View Profile
    • Arctische Pinguin
  • Liked: 1025
  • Likes Given: 0
Re: Latest PIOMAS update (November)
« Reply #3500 on: November 04, 2020, 12:34:08 PM »
Thickness map for day 315, compart with previous years and their differences.

BornFromTheVoid

  • Nilas ice
  • Posts: 1339
    • View Profile
  • Liked: 679
  • Likes Given: 299
Re: Latest PIOMAS update (November)
« Reply #3501 on: November 04, 2020, 01:37:08 PM »
Thanks a lot Wipneus
A few graphs.
I recently joined the twitter thing, where I post more analysis, pics and animations: @Icy_Samuel

gerontocrat

  • Multi-year ice
  • Posts: 20587
    • View Profile
  • Liked: 5305
  • Likes Given: 69
Re: Latest PIOMAS update (November)
« Reply #3502 on: November 04, 2020, 03:57:30 PM »
PIOMAS data

I attach the October Monthly Average Volume  graph with the deviation from the linear trend.

At 4.96 thousand km3, the October 2020 monthly average is the lowest in the satellite record, justb 42 km3 less than the 2012 average of 5.00 thousand km3. The 2020 October Average volume is also 349 km3, or just over 1 year, below the linear trend value for 2020. That amazing 2012 is gradually being pushed aside to eventually become just another footnote in the story of the demise of the Arctic Sea ice.

Daily PIOMAS volume has been lowest in the satellite record since the 17th October - but only in the High Arctic. Peripheral sea volume is currently 4th lowest.

"Para a Causa do Povo a Luta Continua!"
"And that's all I'm going to say about that". Forrest Gump
"Damn, I wanted to see what happened next" (Epitaph)

Juan C. García

  • Young ice
  • Posts: 3359
    • View Profile
  • Liked: 1279
  • Likes Given: 1127
Re: Latest PIOMAS update (November)
« Reply #3503 on: November 04, 2020, 04:43:50 PM »
2020 Andy Lee Robinson video.
Arctic sea ice minimum volumes (1979-2020).

It ends with 4,030 km3 instead of 4,161 km3.

Which is the best answer to Sep-2012 ASI lost (compared to 1979-2000)?
50% [NSIDC Extent] or
73% [PIOMAS Volume]

Volume is harder to measure than extent, but 3-dimensional space is real, 2D's hide ~50% thickness gone.
-> IPCC/NSIDC trends [based on extent] underestimate the real speed of ASI lost.

gerontocrat

  • Multi-year ice
  • Posts: 20587
    • View Profile
  • Liked: 5305
  • Likes Given: 69
Re: Latest PIOMAS update (November)
« Reply #3504 on: November 04, 2020, 05:12:10 PM »
2020 Andy Lee Robinson video.
Arctic sea ice minimum volumes (1979-2020).

It ends with 4,030 km3 instead of 4,161 km3.
4,030 km3 is minimum of the daily volume,
4,161 km3 is the September Monthly average volume.
"Para a Causa do Povo a Luta Continua!"
"And that's all I'm going to say about that". Forrest Gump
"Damn, I wanted to see what happened next" (Epitaph)

oren

  • Moderator
  • First-year ice
  • Posts: 9817
    • View Profile
  • Liked: 3589
  • Likes Given: 3940
Re: Latest PIOMAS update (November)
« Reply #3505 on: November 05, 2020, 05:17:09 AM »
As expected, 2020 took the lead with record low volume throughout the second half of October. The CAB managed to remain at record territory despite a wobble by 2012 during the period. Making more headlines, the Siberian side finally started growing fast. However, with a two week delay from previous leaders 2012 and 2019, I can't say I'm impressed. Attempting to balance the scales is the Beaufort, rushing back up after its late minimum, trending ahead of 2012 and 2019 by two and a half weeks.
2020 finally joined the "lowest daily" trophies club, but eyeballing the volume chart I get the feeling it may not hold on to its leading position by the next reporting period.

Click to enlarge.

kaixo

  • New ice
  • Posts: 18
    • View Profile
  • Liked: 19
  • Likes Given: 4
Re: Latest PIOMAS update (November)
« Reply #3506 on: November 08, 2020, 11:46:29 AM »
Yesterday I posted below analysis in the comment and chatter thread because I wasn’t sure the length of it made it worth posting in this thread, but since first reactions were positive, here we go.
In the following I try to analyze some trends in volume growth during winter months. I worked from the following assumptions:

1. In 1979, at the start of the satellite era, the arctic was just getting out of a more or less stable situation regarding sea ice volume since it took some time until global warming was really making impact. By 1990 changes were well underway, so instead of taking 1979 as a starting point, I use PIOMAS volume data between 1990-2019. I think this is justifiable also because in climatology a three decade period is used as baseline.
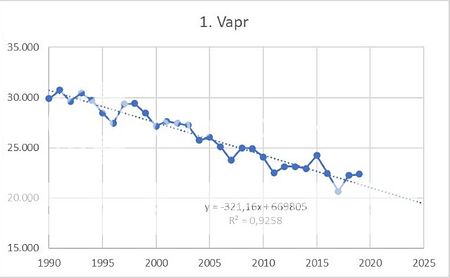
Graphs depicting monthly volumes over these years show a pretty constant decline. See for example this graphs of april volume over the years (any other month would do as well, although october and november show a bit more variance in recent years):


2. Since september ASI extent is getting lower over the years, there is more and more open water to refreeze. So you would expect ASI volume growth (Vgrowth) between october and april next spring to increase. And also that this above average Vgrowth occurs mainly in autumn. Once the arctic sea is frozen over and ice has somewhat thickened, Vgrowth will probably resume more normal growth rates. Lately it has been taking us more or less to the end of the year until all high arctic seas are frozen over again.
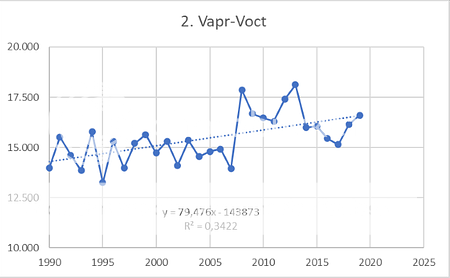
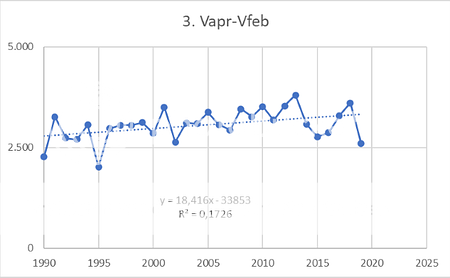
This is indeed what you see when you compare the linear trendline in the graph depicting Vgrowth in the october-april period for example with Vgrowth between februari and april.


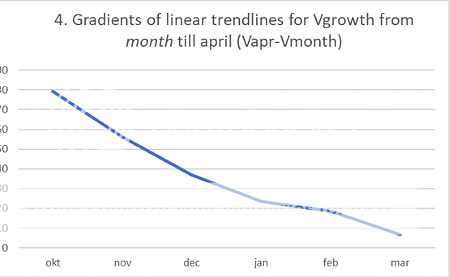
The linear trendline of Vgrowth in the october-april period has the biggest gradient and this gradient gets a bit smaller every month after that. If you put these gradients of the trendlines of Vgrowth from a specific month till the end of the freezing seasons (april) in a separate graph, it makes a good fit and corroborates nicely what is to be expected. Graph 4 is again for the 1990-2019 period.


3. Now for the main course and why this analysis may be relevant for this freezing season and ones to come. Many here on the ASIF regard 2007 as the year in which arctic sea ice extent and volume crashed in such a way that it brought about profound changes in sea ice state and dynamics. If this is correct and a threshhold was passed, then it makes sense to have a look at Vgrowth before and after 2007 separately.

Graph 2 above depicting Vgrowth between october-april indeed suggests something happened in 2007. As an extraordinary meltseason resulted in untill then unknown amounts of open water in september, Vgrowth in the following freezing season 2007-2008 was - rather unsurprisingly - at an all time high. The same can be said about the freezing season following the 2012 melt out. But interestingly, although there have been quite a few big melting seasons in the last decade, this effect of extra Vgrowth caused by huge swaths of open water in september, seems to be waning over the years. At least it looks like that when when you break up the 1990-2019 period in the time frames 1990-2007 and 2008-2019, see graph 5.


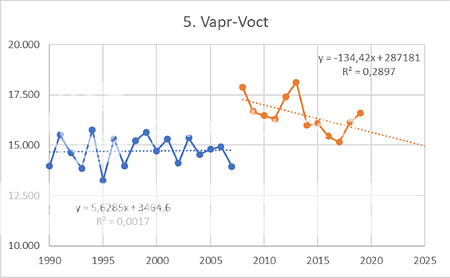
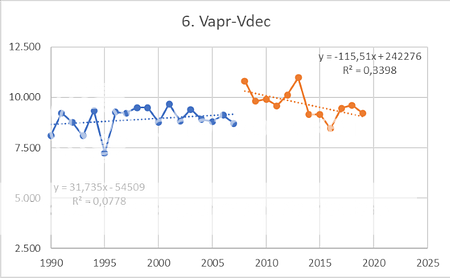
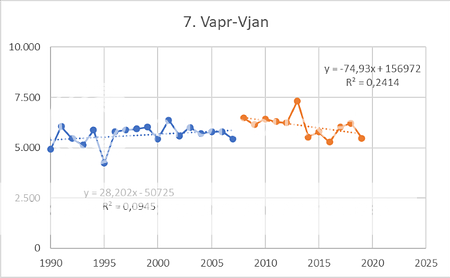
Admittedly, the 2008-2019 time period is short and the variance here is rather large. But lets first have a look at some other months-april freezing periods. This decline in extra Vgrowth over the 2008-2019 time frame clearly is most pronounced in autumn.


This is what you get when you plot the gradients of trendlines for volume growth in the different months-april periods:


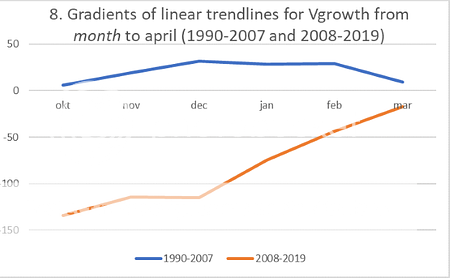
There was a slightly positive trend in Vgrowth for any month-april period in the 1990-2007 time frame, but this is definitely not the case for the years 2008-2019. And especially not for the october-april, nov-apr and dec-apr freezing periods. This suggests that the extra refreeze in autumn is more and more being hampered by other influences such as extra heat uptake in summer, atlantification and higher air temperatures. Since trendlines of Vgrowth over the jan-apr and feb-apr periods are negative also, it seems that these influences extend into the deep of winter.

Of course the outcome of this analysis is strongly influenced by taking 2007 as a kind of tipping point. Maybe this is not justified. And maybe the period 2008-2019 is too short for trustworthy trendlines. But all-in-all the results are remarkably consistent. So maybe we should expect much lower Vgrowth and thus Vmax in years to come.

Save another shift in dynamics like in 2007, which could worsen things considerably and is possibly happening as we speak, the 2008-2019 trendline for Vgrowth from oct-apr will be back at 15k km3 in 2025 (graph 5), just as it was in the years 1990-2007. Add these 15k to the max. 5k probably remaining at the end of october 2025 and you get 20k km3 in april (the simple Vapr lineair trendline in graph 1 predicts 19,5k for april 2025). Since summer melt is around 18 ± 1,5K since 2007, it looks like fascinating and frightening times are at our doorstep.
It wil be interesting to see what the monthly volumes will be this freezing season, but it is difficult to imagine they will not contribute strongly to these downward trends in Vgrowth.
« Last Edit: November 08, 2020, 11:55:12 AM by kaixo »

oren

  • Moderator
  • First-year ice
  • Posts: 9817
    • View Profile
  • Liked: 3589
  • Likes Given: 3940
Re: Latest PIOMAS update (November)
« Reply #3507 on: November 11, 2020, 03:42:59 PM »
Very good analysis kaixo, now that I finally had the time to read it... Very interesting concepts and results. I think it would also be interesting to separate the Arctic ocean proper (maybe with the CAA and Greenland Sea) from the peripheral seas (Barents, Bering, Hudson etc.). I would like to go through the definitions and retrace the calculations, and if I can I will also attempt to do the regional separation. When I have the time.
One thing that often befuddles analyses is the difference between delayed processes (e.g. Laptev freezing over in November instead of October) and processes that never happened, maybe because they were delayed too much (e.g. Bering not freezing to its usual extent). This can affect the trends in various months. The delays are important in themselves but the difference must be noted. I have had trouble with this in the past, but maybe with these new metrics the separation will be clearer.

gerontocrat

  • Multi-year ice
  • Posts: 20587
    • View Profile
  • Liked: 5305
  • Likes Given: 69
Re: Latest PIOMAS update (November)
« Reply #3508 on: November 11, 2020, 07:14:10 PM »
Always fascinating when someone comes up with a new way of looking at the data that might give us a new insight into what's going on.

There is a raft of graphs to indicate that 2007 did seem to be a sea-change in the behaviour of arctic Sea Ice. Here are two of them - the total Arctic October monthly average volume graph and the Central Arctic Basin October monthly average volume graph.

October 2020 was at the record low volume for the month, reflecting very low volume gains for most of the month. I am wondering if October might end up as the month of very low volume increases and November as a month of very high volume increases, as has happened for 2020 extent and area.
« Last Edit: November 12, 2020, 11:34:15 AM by gerontocrat »
"Para a Causa do Povo a Luta Continua!"
"And that's all I'm going to say about that". Forrest Gump
"Damn, I wanted to see what happened next" (Epitaph)

Tor Bejnar

  • Young ice
  • Posts: 4606
    • View Profile
  • Liked: 879
  • Likes Given: 826
Re: Latest PIOMAS update (November)
« Reply #3509 on: November 12, 2020, 12:30:13 AM »
I'm not a statistician, but I've read enough to understand that "arbitrarily" picking 2007 for state change analysis makes the analysis suspect.  If you do a 'change point analysis' of the entire data set and 2007 is the year of change, you've got something.  There are probably other ways to proceed.  I'm just guessing, but if you make graphs with each year from 1990 to 2010 as being the "arbitrarily" selected state change year, is there something special when 2007 is 'the' year? [I arbitrarily decided 10 data points on each side are necessary.  Surely there is an analysis to determine how many data points are needed for significance.  Again, all above my pay grade.]
Arctic ice is healthy for children and other living things because "we cannot negotiate with the melting point of ice"

binntho

  • Nilas ice
  • Posts: 2202
    • View Profile
  • Liked: 879
  • Likes Given: 236
Re: Latest PIOMAS update (November)
« Reply #3510 on: November 12, 2020, 05:44:56 AM »
I'm not a statistician, but I've read enough to understand that "arbitrarily" picking 2007 for state change analysis makes the analysis suspect.  If you do a 'change point analysis' of the entire data set and 2007 is the year of change, you've got something.  There are probably other ways to proceed.  I'm just guessing, but if you make graphs with each year from 1990 to 2010 as being the "arbitrarily" selected state change year, is there something special when 2007 is 'the' year? [I arbitrarily decided 10 data points on each side are necessary.  Surely there is an analysis to determine how many data points are needed for significance.  Again, all above my pay grade.]
I agree - it is not enough to say that it "looks like it" ... I would feel more comfortable if somebody who knew how could do the change-point analysis. On the other hand, I fear that a paucity of data points may make this difficult. Tor's suggestion of repeating kaixo's calculation with different years as "changepoint" is also good, I'm not sure how difficult this would be.
because a thing is eloquently expressed it should not be taken to be as necessarily true
St. Augustine, Confessions V, 6

kaixo

  • New ice
  • Posts: 18
    • View Profile
  • Liked: 19
  • Likes Given: 4
Re: Latest PIOMAS update (November)
« Reply #3511 on: November 12, 2020, 06:09:37 AM »
A decent change point analysis is way beyond my skills as well. What is in the realm of my possibilities though is simply breaking the 1990-2019 time frame in two at various years and calculate voor both sub-periods the trendline. I did this for Vgrowth data for the october – april period, not for the other month-apr Vgrowth periods.

I made sure there where at least 10 datapoints for each sub-set, so the first set is 1990-1999 / 2000-2019 and the last set is 1990-2009 / 2010-2019.
You get graphs like 1 - 3:

When you plot the gradients of the trendlines against the year in wich you break up the 1990-2019 period, you get graph 4:

To me it does suggest that in winter 2007-2008 something changed rather substantially.
As Oren wrote it would also be interesting to separate the arctic ocean proper from the peripheral seas and see what impact this has on the trendlines for Vgrowth. Anyone knows where i can find the data in Excel format? Those i used for above analysis i copied manually from a pdf file to excel, which is no option for all the separate seas.

Edit: Deleted the graphs linked via PhotoBucket and added them as attachments (thanks Glen!  :)).
« Last Edit: November 12, 2020, 07:15:55 AM by kaixo »

Glen Koehler

  • Grease ice
  • Posts: 931
    • View Profile
  • Liked: 738
  • Likes Given: 1414
Re: Latest PIOMAS update (November)
« Reply #3512 on: November 12, 2020, 06:40:41 AM »
       Tamino/Grant Foster is/was the king of change point analysis.  Grant, if you're listening we need you back!  Until he or someone else shows up, I can only relate that from many Tamino blog posts that used change point, one theme was that what looks like a valid change point is not when subjected to statistical testing.  Non-random significance (like beauty) is often in the eye of the beholder.  I'm not saying this to rain on the "2007 fundamental change" question, I am just noting that until we have a statistical test the eyeball view alone cannot be trusted.

       FWIW, my own opinion about 2007 is to agree with you from a different basis.  It seems to me that the loss of multi-year ice in 2007 either reflected or helped initiate systemic changes in the ASI system.  Various posts in the forum have described how, even though 2012 gets most of the attention since it holds the records, that when looked at from different points of view, 2007 was the Big Year.  I have no hope of remembering in which thread, but (I think it was) Oren or BFTV who put up a post this summer listing losses from September to September which showed that when viewed from that time frame, 2007 outdistanced every other year for losses.  So that's a second (but also not statistically validated) observation to lend weight to your proposition. 

       2012 had strong summer melt season weather topped off by perfectly timed and positioned cyclone to break up ice and pull subsurface heat to cause new low September minima.  I don't have 2007 summer melt weather in my head, but I don't think it was as forceful as 2012, and certainly did not have a storm like the GAC 2012 to push it over the edge.  Which leaves it up to other underlying changes that caused (at the time) new record lows. 

       My foggy recollection is that one contributing factor in 2007 was just enough extra floe mobility combined with conditions conducive for Farm or CAA export to send a lot of multi-year ice out of the central Arctic Ocean to its southern doom.  I also think that the Beaufort Gyre faltered as the nursery for multi-year ice in 2007.  Perhaps folks with a better handle on these fuzzy factoids can bolster or refute them, or add other lines of evidence about whether 2007 brought unique forces or outcomes to the ASI saga.  After the unprecedented losses in 2007, there were journal article autopsies about what caused the losses observed that year.  I don't have any specific links to share, but they exist.   

       As for photobucket.  It sounds like you have Excel.  You can make charts in Excel, save them as screen clips to Excel or Word, then click on the image and "Save as Image" to make a file copy on your hard drive.  With that done, then when you write an ASIF post, use the Attachment link below the text box on the Reply screen to upload those saved chart images. 

       Sorry if that it is so blindingly obvious that you are wondering why I would bother to mention it.  Here is why.  I was messing around with different image hosting services until somebody on ASIF reminded me about the Attachment link on the Reply post form.  I had not realized that was a way to upload images.  Yet another in a lifetime of dope-slap to forehead moments, i.e. making something difficult that did not have to be.  The Attachment link is how the ASIF forum platform provides its own image upload and hosting service.
« Last Edit: November 13, 2020, 12:18:47 AM by Glen Koehler »
“What is at stake.... Everything, I would say." ~ Julienne Stroeve

gerontocrat

  • Multi-year ice
  • Posts: 20587
    • View Profile
  • Liked: 5305
  • Likes Given: 69
Re: Latest PIOMAS update (November)
« Reply #3513 on: November 12, 2020, 12:40:47 PM »
To me it does suggest that in winter 2007-2008 something changed rather substantially.
As Oren wrote it would also be interesting to separate the arctic ocean proper from the peripheral seas and see what impact this has on the trendlines for Vgrowth. Anyone knows where i can find the data in Excel format?
Wipneus provides the data twice a month on this thread in two files. (You have to unzip the data as its in format .gz)

One file has monthly average volume by each sea going back to 1979. (attachment 1)
The other file has daily volume by each sea going back to 2000 (attachment2).
The daily total volume going back to 1979 is from http://psc.apl.uw.edu/research/projects/arctic-sea-ice-volume-anomaly/data/ (attachment 3)

I also attach the monthly data by each sea from 1979 with additional columns for the High Arctic (7 central seas) total and the 7 Peripheral Seas total (attachment 4)

"Para a Causa do Povo a Luta Continua!"
"And that's all I'm going to say about that". Forrest Gump
"Damn, I wanted to see what happened next" (Epitaph)

Oyvind Johnsen

  • New ice
  • Posts: 20
    • View Profile
  • Liked: 2
  • Likes Given: 0
Re: Latest PIOMAS update (November)
« Reply #3514 on: November 12, 2020, 01:59:08 PM »
       Tamino/Grant Foster is/was the king of change point analysis. 

And he did an anlysis in 2015, based on extent anomaly data. For sea ice minimum, he found one change point, in 1996 if I read the graph correctly.

 https://tamino.wordpress.com/2015/10/01/arctic-sea-ice-2/

Glen Koehler

  • Grease ice
  • Posts: 931
    • View Profile
  • Liked: 738
  • Likes Given: 1414
Re: Latest PIOMAS update (November)
« Reply #3515 on: November 12, 2020, 03:15:13 PM »
    Thanks Oyvind.  That post belongs in the Tamino Hall of Fame collection.  I miss that guy.  His site is still up but nothing new for months.
“What is at stake.... Everything, I would say." ~ Julienne Stroeve

uniquorn

  • First-year ice
  • Posts: 5132
    • View Profile
  • Liked: 2173
  • Likes Given: 388
Re: Latest PIOMAS update (November)
« Reply #3516 on: November 12, 2020, 03:44:24 PM »
Piomas 2006/7 every 5th day from the 40yr mp4 here.

added sep22, 1980-2020.
« Last Edit: November 13, 2020, 01:51:51 AM by uniquorn »

oren

  • Moderator
  • First-year ice
  • Posts: 9817
    • View Profile
  • Liked: 3589
  • Likes Given: 3940
Re: Latest PIOMAS update (November)
« Reply #3517 on: November 13, 2020, 02:40:21 AM »
       FWIW, my own opinion about 2007 is to agree with you from a different basis.  It seems to me that the loss of multi-year ice in 2007 either reflected or helped initiate systemic changes in the ASI system.  Various posts in the forum have described how, even though 2012 gets most of the attention since it holds the records, that when looked at from different points of view, 2007 was the Big Year.  I have no hope of remembering in which thread, but (I think it was) Oren or BFTV who put up a post this summer listing losses from September to September which showed that when viewed from that time frame, 2007 outdistanced every other year for losses.  So that's a second (but also not statistically validated) observation to lend weight to your proposition. 
Indeed, here is an expanded version of that post which is found upthread. As my PIOMAS Excel is built around Wipneus data, the following only looks at daily data since 2000.
For each year, I look at the volume gain over the preceding autumn and winter, starting at day 266 of the previous year (~Sep 23rd) and ending at day 121 of that year (~May 1st). Then I look at the volume loss over that year's spring and summer, until day 266. The four worst years in each column are bolded. The results are quite interesting.
Indeed, 2007 is the winner for total net loss. However, its main claim to fame should be the low winter gain. Its summer loss was high for its time but nothing much compared to later years. Looking at the data in chart form clearly shows that something was different after 2007, much higher losses and much higher gains as a larger part of the Arctic participated in the seasonal cycle. In my next post I will look at the various regions, and attempt to find out where the missing 2007 winter volume was located.
In general, high net losses typically occur in years that had a low winter gain compared to their surrounding neighbors, marked in the chart. Also marked is 2017, the year the Arctic dodged a cannonball despite poor winter gain, by having the lowest summer loss since 2004.
In addition, most top years for high summer losses were also top years for high early summer losses.

Click to enlarge images.
« Last Edit: November 13, 2020, 02:56:55 AM by oren »

Wipneus

  • Citizen scientist
  • Young ice
  • Posts: 4220
    • View Profile
    • Arctische Pinguin
  • Liked: 1025
  • Likes Given: 0
Re: Latest PIOMAS update (November mid-monthly update)
« Reply #3518 on: November 18, 2020, 09:33:25 AM »
PIOMAS has updated the gridded thickness data to day 320 (16th or 15th of November). Calculated volume on day 320 was 8.07 [1000km3], second lowest, slightly over the 8.00[1000km3] in 2016 .

Here is the animation for November so far.

Wipneus

  • Citizen scientist
  • Young ice
  • Posts: 4220
    • View Profile
    • Arctische Pinguin
  • Liked: 1025
  • Likes Given: 0
Re: Latest PIOMAS update (November mid-monthly update)
« Reply #3519 on: November 18, 2020, 09:41:20 AM »
Updated volume and volume-anomaly graphs.

Wipneus

  • Citizen scientist
  • Young ice
  • Posts: 4220
    • View Profile
    • Arctische Pinguin
  • Liked: 1025
  • Likes Given: 0
Re: Latest PIOMAS update (November mid-monthly update)
« Reply #3520 on: November 18, 2020, 09:45:19 AM »
Updated Fram volume export graph.

Wipneus

  • Citizen scientist
  • Young ice
  • Posts: 4220
    • View Profile
    • Arctische Pinguin
  • Liked: 1025
  • Likes Given: 0
Re: Latest PIOMAS update (November mid-monthly update)
« Reply #3521 on: November 18, 2020, 09:47:11 AM »
Some people have good use for the updated regional data files.

daily:
https://sites.google.com/site/arctischepinguin/home/piomas/data/PIOMAS-regional.txt.gz

oren

  • Moderator
  • First-year ice
  • Posts: 9817
    • View Profile
  • Liked: 3589
  • Likes Given: 3940
Re: Latest PIOMAS update (November mid-monthly update)
« Reply #3522 on: November 18, 2020, 01:14:03 PM »
Thanks a lot Wipneus for your important work with PIOMAS data.
.
A few charts showing that 2020 is unfortunately still leading in the important places, though it lags the total behind 2016 mainly thanks to a 140k surplus in the Greenland Sea.
CAB and Pacific side rates of growth seems to be following in parallel to the slower years, such as 2016. In the Siberian side the rate of growth has been following the faster years, though on a very delayed curve. Hopefully by the next update 2020 will be firmly above 2016.

Click to enlarge.
« Last Edit: November 18, 2020, 01:44:24 PM by oren »

BornFromTheVoid

  • Nilas ice
  • Posts: 1339
    • View Profile
  • Liked: 679
  • Likes Given: 299
Re: Latest PIOMAS update (November mid-monthly update)
« Reply #3523 on: November 18, 2020, 01:27:03 PM »
Cheers, Wipneus

I recently joined the twitter thing, where I post more analysis, pics and animations: @Icy_Samuel

gerontocrat

  • Multi-year ice
  • Posts: 20587
    • View Profile
  • Liked: 5305
  • Likes Given: 69
Re: Latest PIOMAS update (November mid-monthly update)
« Reply #3524 on: November 18, 2020, 02:12:26 PM »
PIOMAS  Volume as at 16 Nov 2020  8,066 KM3

- Volume gain from minimum on this date is 4,037 km3, 607 km3, (13%),  less than the 10 year average of 4,644 km3.

- Volume is at position #2 in the satellite record

- Volume is  158 km3 LESS than 2012
- Volume is  65 km3 MORE than 2016
- Volume is  573 km3 LESS than 2019

Projections.

Average remaining freeze (of the last 10 years) would produce a maximum volume in April 2021 of 21,401 km3, 619 km3 above the 2017 record low maximum volume of 20,782 km3.
____________________________________________________
In the first 10 days of November volume gain mostly above or very much above average, and now below average. Very much a reflection of sea ice area extent and area gains this month so far.
___________________________________________________________
N.B. Click on image  for full-size
"Para a Causa do Povo a Luta Continua!"
"And that's all I'm going to say about that". Forrest Gump
"Damn, I wanted to see what happened next" (Epitaph)

gerontocrat

  • Multi-year ice
  • Posts: 20587
    • View Profile
  • Liked: 5305
  • Likes Given: 69
Re: Latest PIOMAS update (November mid-monthly update)
« Reply #3525 on: November 18, 2020, 07:46:38 PM »
A bit more derived from the PIOMAS data downloaded by Wipneus
_____________________
I attach a look at the November monthly Average graph, which for 2020 uses actuals to 16 Nov and average (last 10 years) volume increases for the remainder of the month.

The result is an average of 7,991 km3, 2nd lowest (above 2016 by 156 km3) and 547km3 below the linear trend value for Nov 2020.
_____________________
With 2020 daily volume being below 2019 daily volume, the 365 day trailing average also declines, currently at 1.6 km3 per day, twice the 42 year linear trend average. A new record low at that rate would come in August 2022.

"Para a Causa do Povo a Luta Continua!"
"And that's all I'm going to say about that". Forrest Gump
"Damn, I wanted to see what happened next" (Epitaph)

Wipneus

  • Citizen scientist
  • Young ice
  • Posts: 4220
    • View Profile
    • Arctische Pinguin
  • Liked: 1025
  • Likes Given: 0
Re: Latest PIOMAS update (December)
« Reply #3526 on: December 06, 2020, 03:00:10 PM »
PIOMAS gridded data was updated upto day 335, which is 30th Nov or 1st of December depending on your calendar. On day 335 volume, calculated from this thickness, reached 9/86 [1000]km3], which is the lowest value except for 2016.

Here is the animation for November.

Wipneus

  • Citizen scientist
  • Young ice
  • Posts: 4220
    • View Profile
    • Arctische Pinguin
  • Liked: 1025
  • Likes Given: 0
Re: Latest PIOMAS update (December)
« Reply #3527 on: December 06, 2020, 03:01:31 PM »
The updated volume and volume-anomaly graphs.

Wipneus

  • Citizen scientist
  • Young ice
  • Posts: 4220
    • View Profile
    • Arctische Pinguin
  • Liked: 1025
  • Likes Given: 0
Re: Latest PIOMAS update (December)
« Reply #3528 on: December 06, 2020, 04:08:44 PM »
The updated Fram volume export graph.

Wipneus

  • Citizen scientist
  • Young ice
  • Posts: 4220
    • View Profile
    • Arctische Pinguin
  • Liked: 1025
  • Likes Given: 0
Re: Latest PIOMAS update (December)
« Reply #3529 on: December 06, 2020, 04:10:48 PM »
Thickness map for day 335, compart with previous years and their differences.

Wipneus

  • Citizen scientist
  • Young ice
  • Posts: 4220
    • View Profile
    • Arctische Pinguin
  • Liked: 1025
  • Likes Given: 0

bbr2315

  • Grease ice
  • Posts: 580
    • View Profile
  • Liked: 73
  • Likes Given: 77
Re: Latest PIOMAS update (December)
« Reply #3531 on: December 06, 2020, 04:24:03 PM »
It would appear that this year's volume in the Beaufort is the highest on record since 07, at least next to the CAA?

I think that the plunge in volume / extent / area in the ESS, Laptev, Kara, and Barentz = more wind impacts on sea ice, = more sea ice drifting into Beaufort / CAA during summertime. It looks very much like the ice that should be in the CAB or adjacent to CAA is now in the CAA or in Beaufort.

This trend could accelerate as the Siberian Seas continue warming.

gerontocrat

  • Multi-year ice
  • Posts: 20587
    • View Profile
  • Liked: 5305
  • Likes Given: 69
Re: Latest PIOMAS update (December)
« Reply #3532 on: December 06, 2020, 05:33:57 PM »
Wipneus' Fram export volume graph suggest that the export was below average in October and November. The NSIDC area graph seems to show area increase was overall more than avaerage.

However both graphs show a bit of a spike in late Oct / early Nov and another in late Nov


"Para a Causa do Povo a Luta Continua!"
"And that's all I'm going to say about that". Forrest Gump
"Damn, I wanted to see what happened next" (Epitaph)

gerontocrat

  • Multi-year ice
  • Posts: 20587
    • View Profile
  • Liked: 5305
  • Likes Given: 69
Re: Latest PIOMAS update (December)
« Reply #3533 on: December 06, 2020, 07:47:00 PM »
PIOMAS  Volume as at 01 Dec 2020  9,861 KM3

- Volume gain from minimum on this date is 5,832 km3, 598 km3, (9%),  less than the 10 year average of 6,430 km3.

- Volume is at position #2 in the satellite record

- Volume is  374 km3 LESS than 2012
- Volume is  350 km3 MORE than 2016
- Volume is  596 km3 LESS than 2019

Projections.

Average remaining freeze (of the last 10 years) would produce a maximum volume in April 2021 of 21,410 km3, 628 km3 above the 2017 record low maximum volume of 20,782 km3.
___________________________________________________________
N.B. Click on image  for full-size
___________________________________________________________
"Para a Causa do Povo a Luta Continua!"
"And that's all I'm going to say about that". Forrest Gump
"Damn, I wanted to see what happened next" (Epitaph)

gerontocrat

  • Multi-year ice
  • Posts: 20587
    • View Profile
  • Liked: 5305
  • Likes Given: 69
Re: Latest PIOMAS update (December)
« Reply #3534 on: December 06, 2020, 07:58:11 PM »
I also attach the November monthly graph and deviation from trend.

At 7,996 km3, the Nov 20 volume is 2nd lowest in the satellite record.
This is just 161 km3 more than the record for Nov in 2016, and 540 km3 (nearly 2 years) less than the trend value for Nov 20.

I also attach the 365 day trailing average table and graph. Although the daily 365 day trailing average is declining at around 1.6 km3 per day, which is about double the long-term average, at this rate of decline a new record low would not happen until mid 2022.
"Para a Causa do Povo a Luta Continua!"
"And that's all I'm going to say about that". Forrest Gump
"Damn, I wanted to see what happened next" (Epitaph)

gerontocrat

  • Multi-year ice
  • Posts: 20587
    • View Profile
  • Liked: 5305
  • Likes Given: 69
Re: Latest PIOMAS update (December)
« Reply #3535 on: December 06, 2020, 09:33:20 PM »
And the volume of the 7 central seas is lowest in the satellite record while the volume of the 7 peripheral seas is 7th lowest.
"Para a Causa do Povo a Luta Continua!"
"And that's all I'm going to say about that". Forrest Gump
"Damn, I wanted to see what happened next" (Epitaph)

oren

  • Moderator
  • First-year ice
  • Posts: 9817
    • View Profile
  • Liked: 3589
  • Likes Given: 3940
Re: Latest PIOMAS update (November mid-monthly update)
« Reply #3536 on: December 07, 2020, 06:30:25 AM »
Thanks a lot Wipneus for your important work with PIOMAS data.
.
A few charts showing that 2020 is unfortunately still leading in the important places, though it lags the total behind 2016 mainly thanks to a 140k surplus in the Greenland Sea.
CAB and Pacific side rates of growth seems to be following in parallel to the slower years, such as 2016. In the Siberian side the rate of growth has been following the faster years, though on a very delayed curve. Hopefully by the next update 2020 will be firmly above 2016.

Click to enlarge.
Looking at the same charts again, 2020 is still in a bad place.
Although the CAB has finally inched above 2016 with a tiny 90 km3 lead, the total of the Inner Basin still sees 2020 as lowest on record by a similar gap. This is due to disappointingly slow growth on both the Siberian side, where trouble brewed all summer and volume is still lowest on record, but also on the Pacific side, which is quickly losing its hard-won advantage. The Beaufort + Chukchi actually managed to lose net volume in the past four months, while most years add a net of several hundred km3.
2016 is still leading thanks to a 190 km3 gap in the Greenland Sea, and a 250 km3 advantage in the Peripheral seas. This lead can go on for quite a while but does not promise a safe melting season in any way. I remind that after the abysmal 2016 winter, 2017 "dodged a cannonball" with very lucky weather. This is not guaranteed to happen again, so hopefully 2020 will pull away above 2016 at some point.

Click to enlarge.

BornFromTheVoid

  • Nilas ice
  • Posts: 1339
    • View Profile
  • Liked: 679
  • Likes Given: 299
Re: Latest PIOMAS update (December)
« Reply #3537 on: December 07, 2020, 10:05:51 AM »
Overall graph and regional differences with 2012 and 2016
I recently joined the twitter thing, where I post more analysis, pics and animations: @Icy_Samuel

Wipneus

  • Citizen scientist
  • Young ice
  • Posts: 4220
    • View Profile
    • Arctische Pinguin
  • Liked: 1025
  • Likes Given: 0
Re: Latest PIOMAS update (December, mid-monthly update)
« Reply #3538 on: December 20, 2020, 05:39:50 PM »
PIOMAS gridded thickness data was updated up to day 350 (15th or 16th December). Volume calculated from this thickness was 11.8 [1000km3], second lowest for day 350.

The animation for December sofar is attached.

Wipneus

  • Citizen scientist
  • Young ice
  • Posts: 4220
    • View Profile
    • Arctische Pinguin
  • Liked: 1025
  • Likes Given: 0
Re: Latest PIOMAS update (December, mid-monthly update)
« Reply #3539 on: December 20, 2020, 05:41:23 PM »
Updated volume and volume anomaly graphs.

Wipneus

  • Citizen scientist
  • Young ice
  • Posts: 4220
    • View Profile
    • Arctische Pinguin
  • Liked: 1025
  • Likes Given: 0
Re: Latest PIOMAS update (December, mid-monthly update)
« Reply #3540 on: December 20, 2020, 05:42:17 PM »
Updated Fram volume export graph.

Wipneus

  • Citizen scientist
  • Young ice
  • Posts: 4220
    • View Profile
    • Arctische Pinguin
  • Liked: 1025
  • Likes Given: 0
Re: Latest PIOMAS update (December, mid-monthly update)
« Reply #3541 on: December 20, 2020, 05:43:51 PM »
Some people have good use for the updated regional data files.

daily:
https://sites.google.com/site/arctischepinguin/home/piomas/data/PIOMAS-regional.txt.gz

BornFromTheVoid

  • Nilas ice
  • Posts: 1339
    • View Profile
  • Liked: 679
  • Likes Given: 299
Re: Latest PIOMAS update (December, mid-monthly update)
« Reply #3542 on: December 21, 2020, 11:56:20 AM »
Total volume and regional differences with 2012 and 2016.
I recently joined the twitter thing, where I post more analysis, pics and animations: @Icy_Samuel

oren

  • Moderator
  • First-year ice
  • Posts: 9817
    • View Profile
  • Liked: 3589
  • Likes Given: 3940
Re: Latest PIOMAS update (December, mid-monthly update)
« Reply #3543 on: December 21, 2020, 03:31:23 PM »
2020 continues the slow dance around 2016. The CAB is a hair below 2016 and the Siberian sector is still lowest on record, while the Pacific sector has managed to make a nice advance.
In the Inner Basin aggregate both years are wrapped around each other, with 2016 currently in the lead. Should this go on until April, 2021 will get another roll of the dice towards a new record, which 2017 managed to avoid.
With 2016 heading towards a volume slowdown in the 2nd half of Dec., it is to be hoped that 2020 will manage to finally pull ahead.

Wipneus

  • Citizen scientist
  • Young ice
  • Posts: 4220
    • View Profile
    • Arctische Pinguin
  • Liked: 1025
  • Likes Given: 0
Re: Latest PIOMAS update (January)
« Reply #3544 on: January 05, 2021, 09:49:12 AM »
PIOMAS gridded data was updated. Last day is 2020, day 365 which is indeed in the PIOMAS data the last day of the year but in some graphs may be displayed as 30th of December.
Volume calculated from this thickness was 13.90 [1000km3], which is second lowest for day 365 (well behind 2016, but close to 2012).

Here is the animation of December.

Wipneus

  • Citizen scientist
  • Young ice
  • Posts: 4220
    • View Profile
    • Arctische Pinguin
  • Liked: 1025
  • Likes Given: 0
Re: Latest PIOMAS update (January)
« Reply #3545 on: January 05, 2021, 09:50:44 AM »
Here is the updated Fram volume export graph.

Wipneus

  • Citizen scientist
  • Young ice
  • Posts: 4220
    • View Profile
    • Arctische Pinguin
  • Liked: 1025
  • Likes Given: 0
Re: Latest PIOMAS update (January)
« Reply #3546 on: January 05, 2021, 09:54:38 AM »
Here are the update volume and volume-anomaly graphs.

Wipneus

  • Citizen scientist
  • Young ice
  • Posts: 4220
    • View Profile
    • Arctische Pinguin
  • Liked: 1025
  • Likes Given: 0

Wipneus

  • Citizen scientist
  • Young ice
  • Posts: 4220
    • View Profile
    • Arctische Pinguin
  • Liked: 1025
  • Likes Given: 0
Re: Latest PIOMAS update (January)
« Reply #3548 on: January 05, 2021, 09:58:48 AM »
Thickness map of day 365, a comparison with previous years and their diff's.

gerontocrat

  • Multi-year ice
  • Posts: 20587
    • View Profile
  • Liked: 5305
  • Likes Given: 69
Re: Latest PIOMAS update (January)
« Reply #3549 on: January 05, 2021, 11:26:04 AM »
Once again a big thankyou to the Polar Science Center and Wipneus.

PIOMAS  Volume as at 31 Dec 2020  13,901 KM3

- Volume gain from minimum on this date is 9,872 km3, 175 km3, (2%),  less than the 10 year average of 10,047 km3.

- Volume is at position #2 in the satellite record

- Volume is  20 km3 LESS than 2012
- Volume is  823 km3 MORE than 2016
- Volume is  618 km3 LESS than 2019

Projections.

Average remaining volume gain (of the last 10 years) would produce a maximum volume in April 2021 of 21,833 km3, 2nd lowest in the satellite record, but 1,051 km3 above the 2017 record low maximum volume of 20,782 km3.
___________________________________________________________
N.B. Click on image  for full-size
"Para a Causa do Povo a Luta Continua!"
"And that's all I'm going to say about that". Forrest Gump
"Damn, I wanted to see what happened next" (Epitaph)