Jai,
Let's just get the IPCC issue out of the way first. When I was in the process of changing my mind from being a sceptic of AGW I downloaded AR3 and selected some random chapters from the WG1 scientific basis. I then went through those chapters checking to see if the IPCC was correctly reporting the science, this took some time as I didn't know very much. I've not done the same since, but on reading the section I referred you to I have read all the references (and more) and it reads like a fair assessment of the science. I'm just an amateur but I do know sea ice science pretty well. So unless you can point out problems with that section that will educate me further, I think the IPCC is making a fair assessment there.
You said:
...this one study alone, indicates that our current radiative forcing from 402% PPMV is actually acting like 460 PPMV according to our previous models.
I said, "The result doesn't seem so significant as to affect the 1.5 to 4.5degC confidence interval for climate sensitivity, which is based on multiple lines of evidence." Note the
wide range of the pre-existing (basically Charney) estimate, and the
multiple lines of evidence that have gone into that. 402 to 460 rounds up to a 15% increase, 15% extra on 3degC is about 3.5degC, within the range of 1.5 to 4.5degC, assuming RF tends to linear over such a short range. My opinion remains that until I see significant research substantially revising upwards outside the Charney range. I don't think Durack et. al is strong enough to overturn that range, but it is useful.
June/July insolation: What have you got, a 100W/m^2 variation with lattitude? Or some 20%. Agreed?
How much variation in insolation do you think different pressure systems with attendant cloud variation (thick low cloud to clear sky) will cause? I said "Tietsche removed the ice on 1 July, near enough to the solstice to make little difference from 1 June." Maybe I should have said "Tietsche removed the ice on 1 July, near enough to the solstice to make little difference from 1 June,
bearing in mind the influence of weather"
I went on to refer to Schroeder & Connelly: "Schroeder & Connelly removed the ice on, 1 December, 1 March,
1 June, and 1 September, they found a very similar result." They also examined a warmed ocean due to open water, the results were that:
The impact is stronger when ocean temperature is
adjusted to ice-free conditions, but even then the differences
appearing between the sensitivity and Ctrl runs are clearly
smaller after a few years than the differences between
modelled and observed sea ice area."
You say:
How do you reconcile this with the ZHANG 2010 paper that states a largely summer ice free state with 4C regional (not NH) warming?
You seen to be getting mixed up. Actually Zhang et al 2010 shows virtually ice free with 2degC warming,
but this is in the summer. Armour et al find a collapse of
winter ice cover with between 4 and 6degC hemispheric annual average warming.
Sea ice formation is simply not inconsistent with an ocean warmed in the summer. Once the sun sets in winter temperatures drop. Over the ice free warmed ocean temperatures are held up lower in the atmosphere above the open water. But the net heat flux is upward, and as atmospheric temperatures cool it is
massive.
On the slow transition thread I have shown calculations with a simple thermodynamic model of sea ice growth. The following uses a synthesised daily 2m temperature dataset derived from NCEP/NCAR monthly data over the ESS.
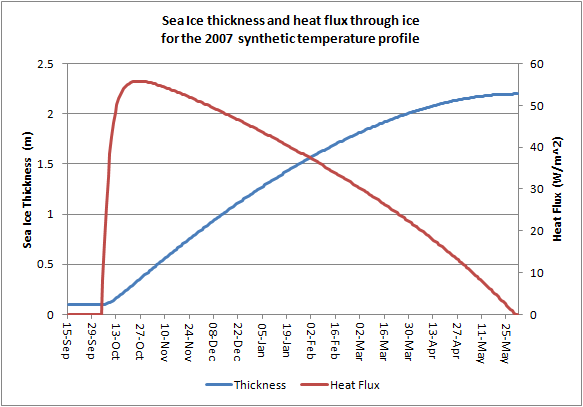
Heat flux is seen to be massive in the early autumn, with a delay to ice growth into mid October as the air temperatures exceed zero degC.
Consider the heat flux. The sum of heat flux for a 1m squared area from 6 October to 31 December is 4379W/m^2 over 92 days. 60x60x24x4379 = 378M joules for a 1m^2 area. 6 October being when the ice has formed.
The specific heat capacity of sea water near the surface is around 3985 J/kg K, the density is around 1027 kg/m^3, so to cool 1m cubed of sea water by 1degC (or Kelvin) you need to lose around 4M joules.
378MJ/m^3 K / 4MJ /m^3 = 94.5 metre depth cooled by 1 degC. And that is
after the ice has formed, so temperature is already at -1.8degC for the surface. Before the ice forms heat loss is even greater, in winter over leads heat fluxes can exceed 400W/m^2 (Andreas 1979 via Alam & Curry). Bear in mind that the peak heat flux through ice is only 1/8 of such figures for open water in winter.
Alam & Curry.
http://curry.eas.gatech.edu/currydoc/Alam_JGR100.pdfOnce incoming solar radiation is gone the heat budget for the Arctic is upwards, cooling will occur. Over open water it is massive. Hence ice
will form.
Using the same simple physical model it is possible to reformulate in terms of Freezing Degree Days (FDDs). Using such a formulation one can combine the impact of shortened melt season and winter warming.

Currently over the East Siberian Sea FDD is around 4000, in the 1980s it was about 5000, over the Central Arctic it is higher (over 5000). Over most of the pack you'd need to more than halve FDD to around 2000 to get out of the linear range of FDD/peak thickness. If winter ice only grows to around 1.5m across the pack then by that stage thickness will be such that summer thinning will largely wipe out the ice (apart from mechanically deformed ice off Canada). We have a long way to go before that happens and winter thickness falls enough such that regular total melt outs become the norm.
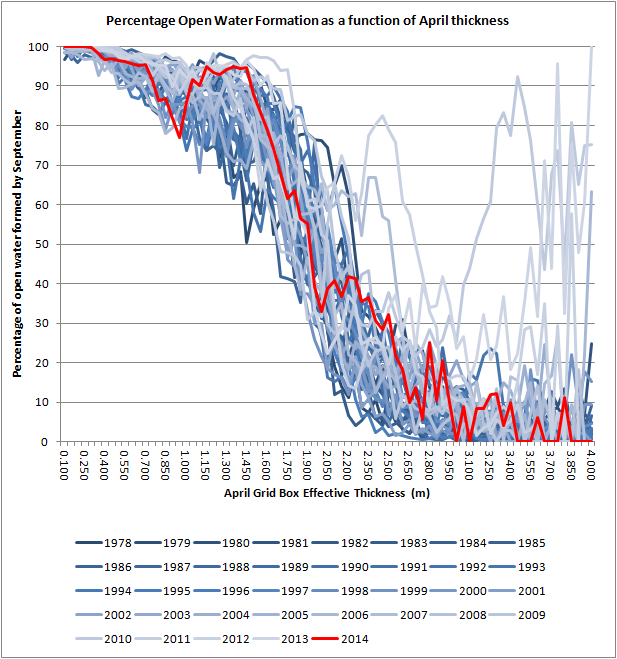
Note that in PIOMAS of grid boxes with an effective thickness of around 2m in April, only around 15% to 70% meltout totally to give open water. By 1.75m, this is 40% to 85%, which corresponds to 2000 FDDs. As mentioned above, the Central Arctic is currently around 5000 FDD and the ESS has fallen from 5000 FDD in the 1980s to 4000 FDD in recent years. There remains a lot of winter warming and later start to melting before we can expect to see winter thickness drop to levels where massive (85%) area loss is to be expected.