Support the Arctic Sea Ice Forum and Blog

Author Topic: The 2016 melting season  (Read 2286390 times)

Tor Bejnar

  • Young ice
  • Posts: 4606
    • View Profile
  • Liked: 879
  • Likes Given: 826
Re: The 2016 melting season
« Reply #3200 on: July 11, 2016, 09:13:07 PM »
A little heat in the DMI 80 North temperature chart again (finally!)  Not as "hot" as 2012 on this date, but warm none-the-less.
Arctic ice is healthy for children and other living things because "we cannot negotiate with the melting point of ice"

Paladiea

  • Frazil ice
  • Posts: 106
    • View Profile
  • Liked: 13
  • Likes Given: 4
Re: The 2016 melting season
« Reply #3201 on: July 11, 2016, 09:17:37 PM »
I think it should be noted that while the ice does look like last year in some places, 2015 and 2016 are noticeably different than previous years in terms of ice integrity with the possible exception of 2012.
The most enjoyable way to think about heat transfer through radiation is to picture a Star Wars laser battle, where every atom and molecule is constantly firing at every other atom and molecule.

Hugabufallo

  • New ice
  • Posts: 4
    • View Profile
  • Liked: 0
  • Likes Given: 0
Re: The 2016 melting season
« Reply #3202 on: July 11, 2016, 09:33:27 PM »
I think that the main trend I see over the past few years is an increasing mobility of the ice pack. Presumably the main driver of this is an increased fragility of the pack due to a decrease in the average age of the ice. How much this is having an effect and the extent to which it is actually happening is hard to quantify at this point in my opinion.
This I think is changing how weather patterns and systems might impact the ice and leading to an increase in unpredictability of how melt seasons pan out. The more unpredictable it becomes the larger potential difference there is likely to be between those who are perhaps more cautious/conservative in their predictions and those who might be deemed more reactionary. Again this is just my opinion as a layman.

I think that it is quite obvious that there isn't any disagreement on this forum that the arctic has been changing extremely rapidly in the past few decades (remember our human perceived timescales are very short). However the points of disagreement between people appear to be amplified within this environment and therefore perceived to be greater than they actually are. I feel that it is a little unnecessary for this discussion to become as heated as it does at times. I think that if someone expresses an opinion or judgement that seems diametrically opposed to what you think/perceive don't immediately reach the conclusion that the other person is being deliberately antagonistic. In science what we don't know is always far greater than the limited knowledge we actually possess as a species and so we are always learning. Don't let your interactions deteriorate on a personal level as potential for learning could be lost.

P.S. I find much of what a lot of you contribute to this forum in terms of content, analysis and opinion both fascinating and very informative and so for that I thank you.

epiphyte

  • Frazil ice
  • Posts: 387
    • View Profile
  • Liked: 22
  • Likes Given: 21
Re: The 2016 melting season
« Reply #3203 on: July 11, 2016, 09:39:16 PM »
Hardly any holes can be seen for 2015 - 2016 looks much worse.

Would anybody care to speculate which is 2012, 2015 and 2016?

I'll bite... Selection 760 is from yesterday, 10th July 2016...

... There's more to those images than meets the eye :)

Viz:


seaicesailor

  • Guest
Re: The 2016 melting season
« Reply #3204 on: July 11, 2016, 10:16:39 PM »
A-Teams images in the AMSR2 thread is a must-see. The melting that is going on in the Atlantic side under our nose.

I think people should realize that the missing ice of the CAB holes is in reality ice melting in the Atlantic side (big melting), the Beaufort and Chukchi. Per se, these holes have only relative importance, as not so much melting potential there. The importance is the divergence caused by the storms that have pushed the ice to the sides
So many storms, and, although slowed down, 2016 kept pace? The ice is melting from the periphery inwards.
Add the ESS bite, this one was indeed opened by the storms and may advance later.
The ice may suffer a second below 2007 clearly.
« Last Edit: July 11, 2016, 10:25:32 PM by seaicesailor »

Michael Hauber

  • Nilas ice
  • Posts: 1116
    • View Profile
  • Liked: 168
  • Likes Given: 16
Re: The 2016 melting season
« Reply #3205 on: July 11, 2016, 10:47:25 PM »
Some pretty healthy ice in the Siberian region.  What consequences will this have for the rest of the melt season?  Considering the weakness from Beaufort to Laptev, and the current forecast of a reverse dipole set up I could imagine the ESS split off from the rest of the pack as it was in 2012.  But the ice here is looking very healthy compared to recent years, so I think there is a pretty decent chance of some of this ice surviving to minimum.
Climate change:  Prepare for the worst, hope for the best, expect the middle.

bbr2314

  • Nilas ice
  • Posts: 1817
    • View Profile
  • Liked: 158
  • Likes Given: 53
Re: The 2016 melting season
« Reply #3206 on: July 11, 2016, 11:14:52 PM »
I think Jim Hunt has been very clear that he sees little discernible difference in the main pack between Beaufort and the pole among various years.  He has posted images of multiple resolutions as evidence.  Regardless of anyone's definition of rubble, I have yet to encounter a post containing consistent visual imagery supporting the claim that ice state between Beaufort and the pole is worse in 2016 than in recent years.  Until that happens, at least refrain from calling Jim willfully ignorant, or otherwise rudely dismissing him.
Concur.  In fact, I'm seeing similarities between what the CAB looks like currently as compared to 2013.  I'm not convinced we'll slow down that much - there's a lot more heat around than in 2013 - but the state of the ice strikes me as comparable.

Really?


Neven

  • Administrator
  • First-year ice
  • Posts: 9518
    • View Profile
    • Arctic Sea Ice Blog
  • Liked: 1337
  • Likes Given: 618
Re: The 2016 melting season
« Reply #3207 on: July 11, 2016, 11:29:00 PM »
I've just noticed on Andrew Slater's website that at the top of the SIC comparison page with 2015, it says:

Differences in NASA Team Sea Ice Concentration and Extent from 2015 (F-18 data in use)

At the top of the 2013 page (and every other year), it says:

Differences in NASA Team Sea Ice Concentration and Extent from 2013

Could that explain the large difference with 2013 on the SIC comparison page? Maybe Slater hasn't updated the maps yet after the switch to F18? I don't know, but 2013 also had quite a bit of dispersal going, what with all the cyclones.
The enemy is within
Don't confuse me with him

E. Smith

Michael Hauber

  • Nilas ice
  • Posts: 1116
    • View Profile
  • Liked: 168
  • Likes Given: 16
Re: The 2016 melting season
« Reply #3208 on: July 11, 2016, 11:31:19 PM »
That chart shows an area between NP and Beaufort that is more than 30% lower concentration than last year.  Looking at MODIS as best I can match up is here and I call nonsense.
Climate change:  Prepare for the worst, hope for the best, expect the middle.

Darvince

  • Frazil ice
  • Posts: 318
    • View Profile
  • Liked: 31
  • Likes Given: 7
Re: The 2016 melting season
« Reply #3209 on: July 11, 2016, 11:34:54 PM »
The Beaufort is really heating up now.


Source: http://www.ospo.noaa.gov/data/sst/contour/global.c.gif

I don't know how reliable OSPO SST data is in the Arctic, and especially under sea ice, as back in April it showed the Lincoln Sea soaring to temps as high as 6C and kept it near 3-4C for several weeks.

jdallen

  • Young ice
  • Posts: 3412
    • View Profile
  • Liked: 651
  • Likes Given: 244
Re: The 2016 melting season
« Reply #3210 on: July 11, 2016, 11:36:40 PM »
I think Jim Hunt has been very clear that he sees little discernible difference in the main pack between Beaufort and the pole among various years.  He has posted images of multiple resolutions as evidence.  Regardless of anyone's definition of rubble, I have yet to encounter a post containing consistent visual imagery supporting the claim that ice state between Beaufort and the pole is worse in 2016 than in recent years.  Until that happens, at least refrain from calling Jim willfully ignorant, or otherwise rudely dismissing him.
Concur.  In fact, I'm seeing similarities between what the CAB looks like currently as compared to 2013.  I'm not convinced we'll slow down that much - there's a lot more heat around than in 2013 - but the state of the ice strikes me as comparable.

Really?

Yes, Really

The granularity, dispersion and general lack of coherent pack in many areas under discussion bears considerable similarity to 2013.  I'm not comparing areas which have melted out with areas which did not in 2013.

What saved 2013 was a long stretch of cool, cloudy and *calm* weather.

You need to stop trying to pick fights.


Here's an image of the Beaufort and part of the CAB and Chukchi from Worldview.  The lower left hand corner is anchored on the "Big Block". 

The dispersion and granularity is similar to 2013, and to a similar degree 2015.

What is worth noting is the color - there is very extensive surface melt visible even on the smaller floes.  If it is thinner - under 1.75M as was seen over large areas earlier in the season - it is under serious threat.
This space for Rent.

Paladiea

  • Frazil ice
  • Posts: 106
    • View Profile
  • Liked: 13
  • Likes Given: 4
Re: The 2016 melting season
« Reply #3211 on: July 11, 2016, 11:45:17 PM »
Quote
You need to stop trying to pick fights.

I was just about to type that very thing. Bbr, I get you're enthusiastic but please:

You need to stop trying to pick fights.
The most enjoyable way to think about heat transfer through radiation is to picture a Star Wars laser battle, where every atom and molecule is constantly firing at every other atom and molecule.

seaicesailor

  • Guest
Re: The 2016 melting season
« Reply #3212 on: July 12, 2016, 01:04:24 AM »
Ugh ugly SSTs all around
Slater's 925hPa temp also jumped over +1 sigma.
Weather otoh seems decided to keep that heat out of the Arctic, exception made this time Laptev and ESS

jai mitchell

  • Nilas ice
  • Posts: 2370
    • View Profile
  • Liked: 208
  • Likes Given: 61
Re: The 2016 melting season
« Reply #3213 on: July 12, 2016, 01:08:47 AM »
first image:

 July 13, 2013 - Approximately 120km X 120km square between NP and toward Nares on the east and toward Ellesmere Island.  Top of picture is approximately 30km from the north pole

second image:

July 10, 2016 - Approximately same location and size.

Analysis- July 2013 image has much larger floes and contiguous ice.  The area shown has far greater numbers of fractures and much higher relative ice mobility as compared to 2013.   

your interpretation of the two comparative images may vary. . .
Haiku of Futures Passed
My "burning embers"
are not tri-color bar graphs
+3C today

Jim Hunt

  • First-year ice
  • Posts: 6273
  • Don't Vote NatC or PopCon, Save Lives!
    • View Profile
    • The Arctic sea ice Great White Con
  • Liked: 894
  • Likes Given: 87
Re: The 2016 melting season
« Reply #3214 on: July 12, 2016, 01:18:51 AM »
I'll bite... Selection 760 is from yesterday, 10th July 2016...

Very good. You win a packet of peanuts!

With the aid of this clue can you work out the other two?
"The most revolutionary thing one can do always is to proclaim loudly what is happening" - Rosa Luxemburg

magnamentis

  • Guest
Re: The 2016 melting season
« Reply #3215 on: July 12, 2016, 01:30:44 AM »
first image:

 July 13, 2013 - Approximately 120km X 120km square between NP and toward Nares on the east and toward Ellesmere Island.  Top of picture is approximately 30km from the north pole

second image:

July 10, 2016 - Approximately same location and size.

Analysis- July 2013 image has much larger floes and contiguous ice.  The area shown has far greater numbers of fractures and much higher relative ice mobility as compared to 2013.   

your interpretation of the two comparative images may vary. . .

congrats, well documented :-) first i thought, what's coming now but that's what we mean  when we say fragmented and bad condition while i think it's a bit thinner as well due to high winter temps but that cannot be seen from above LOL

Jim Hunt

  • First-year ice
  • Posts: 6273
  • Don't Vote NatC or PopCon, Save Lives!
    • View Profile
    • The Arctic sea ice Great White Con
  • Liked: 894
  • Likes Given: 87
Re: The 2016 melting season
« Reply #3216 on: July 12, 2016, 01:45:06 AM »
Just in case anybody's interested in such esoteric matters the snow around ice mass balance buoy 2015F has finally melted. The buoy reports 3 cm of surface melt plus 3 cm of bottom melt over the last 24 hours or so:

Pos: 82.78 N, 137.48 W
Air Temp: 0.49 C
Air Pres: 1013.88 mb
Water Temp: ~ -1.5 C

Here's some recent temperature profiles:
"The most revolutionary thing one can do always is to proclaim loudly what is happening" - Rosa Luxemburg

Michael Hauber

  • Nilas ice
  • Posts: 1116
    • View Profile
  • Liked: 168
  • Likes Given: 16
Re: The 2016 melting season
« Reply #3217 on: July 12, 2016, 02:45:46 AM »
In some ways I see significant similarities between this season and 2008 - very strong melt in Beaufort and weak melt in Laptev.  This resulted in a strong finish in 2008 when the ESS became undermined late in the season as the Laptev eventually melted out anyway and the Beaufort melt, with the help of Beaufort Gyre transport really ate into this region.  This was the first season I watched and I remember 2008 looked to be hopelessly short of the pace earlier in the season and it was somewhat exciting as it suddenly looked to narrow the gap towards the end, but just when it looked a realistic chance of actually catching 2007 it stalled again.

Perhaps similar will happen this year.  We are currently 900k ahead of 2008 in ADS.  Might a similar strong finish this year put us 900k ahead at minimum?  Putting us midway between 2007 and 2012?  I've been surprised that 2007 has yet to be beaten more than once so far.  Each year since 2012 I've been expecting the ice melt to beat 2007 again, and once speculated that 2011 may be the last year that we didn't beat 2007, but so far this has not happened.  Will this be the year that beating the once amazing 2007 becomes commonplace?
Climate change:  Prepare for the worst, hope for the best, expect the middle.

FishOutofWater

  • Nilas ice
  • Posts: 1088
    • View Profile
  • Liked: 696
  • Likes Given: 333
Re: The 2016 melting season
« Reply #3218 on: July 12, 2016, 03:10:11 AM »
Jim: That buoy plot is very interesting. It took a long time for the heat to affect that location which is pretty much where the pack looks the strongest. I doubt it will see more than a meter of melting over the short melt season in that area so it seems like you have found a region the will become multi year ice. However, the overall conditions in the Arctic this year look a lot worse than 2013 to me, especially on the Atlantic side. We'll see. It has been a strange year in the Arctic.

JimboOmega

  • Frazil ice
  • Posts: 140
    • View Profile
  • Liked: 2
  • Likes Given: 0
Re: The 2016 melting season
« Reply #3219 on: July 12, 2016, 03:39:46 AM »
Just in case anybody's interested in such esoteric matters the snow around ice mass balance buoy 2015F has finally melted. The buoy reports 3 cm of surface melt plus 3 cm of bottom melt over the last 24 hours or so:

Pos: 82.78 N, 137.48 W
Air Temp: 0.49 C
Air Pres: 1013.88 mb
Water Temp: ~ -1.5 C

Here's some recent temperature profiles:

What is the X axis here?

Tigertown

  • Nilas ice
  • Posts: 1678
    • View Profile
  • Liked: 24
  • Likes Given: 20
Re: The 2016 melting season
« Reply #3220 on: July 12, 2016, 04:15:39 AM »
Does this look normal? Asking sincerely,because I don't know.
"....and the appointed time came for God to bring to ruin those ruining the earth." Revelation 11:18.

Michael Hauber

  • Nilas ice
  • Posts: 1116
    • View Profile
  • Liked: 168
  • Likes Given: 16
Re: The 2016 melting season
« Reply #3221 on: July 12, 2016, 05:17:50 AM »
Archive here

Quickly checking same date in 2012 shows quite a similar pattern, but noticeable differences.  What if anything these differences might mean I have no idea.
Climate change:  Prepare for the worst, hope for the best, expect the middle.

Rob Dekker

  • Nilas ice
  • Posts: 2386
    • View Profile
  • Liked: 120
  • Likes Given: 119
Re: The 2016 melting season
« Reply #3222 on: July 12, 2016, 06:06:26 AM »
What is the X axis here?

It is thermistor count.
Left side is the surface, right side is the bottom of the ice.
What you are looking at is the temperature profile through the ice.

That 2015F buoy is very interesting to watch, see how its melt proceeds.
Especially since it is in the middle of the pack, with not much sources of heat that cause bottom-melt other than the less well understood melting mechanisms : conduction through the ice, and sunlight shining through the ice.
This is our planet. This is our time.
Let's not waste either.

Rob Dekker

  • Nilas ice
  • Posts: 2386
    • View Profile
  • Liked: 120
  • Likes Given: 119
Re: The 2016 melting season
« Reply #3223 on: July 12, 2016, 06:49:48 AM »
Dr. Slater's probabilistic model (based on ice concentration AFAIK) is giving this projection for the last days of August :
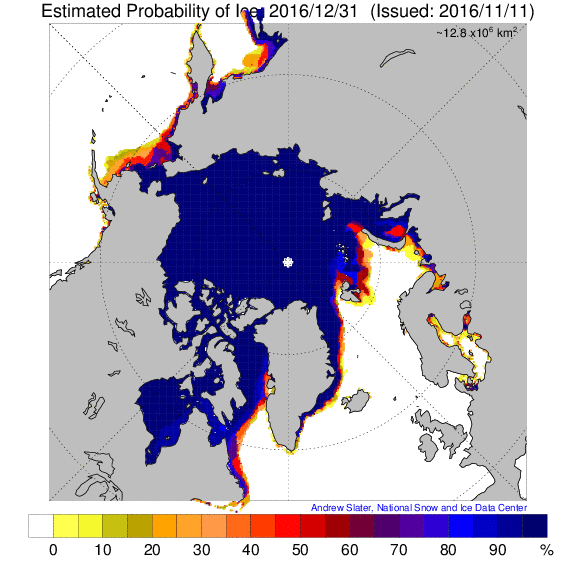


Couple of interesting observations from this projection based on this model :
- There is about 50% chance that the North-West passage will open up at the end of August
- There is less than 20% chance that the North-East passage will open up at the end of August
- There appears to be about 70% chance that a large chunk of ice in the ESS may be cut off from the main pack
- Looks like we are going into September with 4.3 M km^2 ice left, which hints at a September minimum of about 4.1 or 4.2.
- And really cool : That little red spot in the Beaufort is A-team's "Big Block" and Slater's model gives it 50% of surviving August  :)

Of course, this is a model and, to quote Nils Bohr, predictions are hard to make, especially when pertaining to the future.
But Dr. Slater's model was spot-on last year.

P.S. Newbee question : How do I upload a picture in a forum post (rather than inserting it as a link) ?

[edit] I think I figured it out. You can upload a picture in a forum post using the "Attachments and other options" tag. But the picture will appear at the end of your post, and you cannot add any text after that. Did I get that right ?
« Last Edit: July 12, 2016, 09:51:47 AM by Rob Dekker »
This is our planet. This is our time.
Let's not waste either.

RoxTheGeologist

  • Grease ice
  • Posts: 625
    • View Profile
  • Liked: 188
  • Likes Given: 149
Re: The 2016 melting season
« Reply #3224 on: July 12, 2016, 07:02:42 AM »
Dr. Slater's probabilistic model (based on ice concentration AFAIK) is giving this projection for the last days of August :


Couple of interesting observations from this projection based on this model :
- There is about 50% chance that the North-West passage will open up at the end of August
- There is less than 20% chance that the North-East passage will open up at the end of August
- There appears to be about 70% chance that a large chunk of ice in the ESS may be cut off from the main pack
- Looks like we are going into September with 4.3 M km^2 ice left, which hints at a September minimum of about 4.1 or 4.2.
- And really cool : That little red spot in the Beaufort is A-team's "Big Block" and Slater's model gives it 50% of surviving August  :)

Of course, this is a model and, to quote Nils Bohr, predictions are hard to make, especially when pertaining to the future.
But Dr. Slater's model was spot-on last year.

P.S. Newbee question : How do I upload a picture in a forum post (rather than inserting it as a link) ?

It seems that in parts of the CAA predictions have already been exceeded. The temperature anomalies over the last week or so over Banks island are causing fairly rapid melt of the ice. On Worldview it looks like the land and shallows are heating up quickly and causing the adjacent ice to
melt.

Tigertown

  • Nilas ice
  • Posts: 1678
    • View Profile
  • Liked: 24
  • Likes Given: 20
Re: The 2016 melting season
« Reply #3225 on: July 12, 2016, 07:14:49 AM »
      He was remarkably close last year

"....and the appointed time came for God to bring to ruin those ruining the earth." Revelation 11:18.

Jim Hunt

  • First-year ice
  • Posts: 6273
  • Don't Vote NatC or PopCon, Save Lives!
    • View Profile
    • The Arctic sea ice Great White Con
  • Liked: 894
  • Likes Given: 87
Re: The 2016 melting season
« Reply #3226 on: July 12, 2016, 08:52:58 AM »
What is the X axis here?

Like Rob said. A more detailed FAQ can be found at:

http://GreatWhiteCon.info/resources/ice-mass-balance-buoys/
"The most revolutionary thing one can do always is to proclaim loudly what is happening" - Rosa Luxemburg

binntho

  • Nilas ice
  • Posts: 2209
    • View Profile
  • Liked: 881
  • Likes Given: 239
Re: The 2016 melting season
« Reply #3227 on: July 12, 2016, 09:04:14 AM »
I do find it interesting that I've heard a few times now about how its not sunny but cloudy or windy conditions that melt the most snow from people who have direct experience with local snow melt.  I do not doubt this, and the question is why?

I think its a case of scale.  The Arctic is big enough that when high moisture winds hit the edge they will condense all their moisture out reasonably quickly.  Perhaps more ice melts on the edge under cloudy/windy conditions than sunny.  But the wind loses its melting power for the rest.  In contrast sunny conditions might not be as fast as the wind at the edge of the Arctic, but cause melt over a much larger area.
Sounds like a very reasonable explanation!
because a thing is eloquently expressed it should not be taken to be as necessarily true
St. Augustine, Confessions V, 6

Quantum

  • Frazil ice
  • Posts: 101
    • View Profile
  • Liked: 0
  • Likes Given: 0
Re: The 2016 melting season
« Reply #3228 on: July 12, 2016, 09:56:08 AM »
DMI is predicting significant cooling of SSTs in the beaufort this week and a corresponding warming in the ESS.


Jim Hunt

  • First-year ice
  • Posts: 6273
  • Don't Vote NatC or PopCon, Save Lives!
    • View Profile
    • The Arctic sea ice Great White Con
  • Liked: 894
  • Likes Given: 87
Re: The 2016 melting season
« Reply #3229 on: July 12, 2016, 09:56:32 AM »
The current state of the sea ice at ~ 74N, 160W via USCGC Healy

"The most revolutionary thing one can do always is to proclaim loudly what is happening" - Rosa Luxemburg

Rob Dekker

  • Nilas ice
  • Posts: 2386
    • View Profile
  • Liked: 120
  • Likes Given: 119
Re: The 2016 melting season
« Reply #3230 on: July 12, 2016, 10:15:01 AM »
Thanks Jim !
That is so cool. I did not know the Healy was in the Arctic (I thought it was in Hawaii  :P).
Their web cam is a great resource, with pictures taken every hour :
http://icefloe.net/Aloftcon_Photos/index.php?album=2016
This is our planet. This is our time.
Let's not waste either.

Jim Hunt

  • First-year ice
  • Posts: 6273
  • Don't Vote NatC or PopCon, Save Lives!
    • View Profile
    • The Arctic sea ice Great White Con
  • Liked: 894
  • Likes Given: 87
Re: The 2016 melting season
« Reply #3231 on: July 12, 2016, 10:32:57 AM »
"The most revolutionary thing one can do always is to proclaim loudly what is happening" - Rosa Luxemburg

Neven

  • Administrator
  • First-year ice
  • Posts: 9518
    • View Profile
    • Arctic Sea Ice Blog
  • Liked: 1337
  • Likes Given: 618
Re: The 2016 melting season
« Reply #3232 on: July 12, 2016, 11:29:58 AM »
[edit] I think I figured it out. You can upload a picture in a forum post using the "Attachments and other options" tag. But the picture will appear at the end of your post, and you cannot add any text after that. Did I get that right ?

That's right, Rob.
The enemy is within
Don't confuse me with him

E. Smith

Archimid

  • Young ice
  • Posts: 3511
    • View Profile
  • Liked: 899
  • Likes Given: 206
Re: The 2016 melting season
« Reply #3233 on: July 12, 2016, 01:08:19 PM »
Attached is the latest IPCC projections for September sea ice minimum.

If the minimum is about 4.5 million then projections are smack in the middle of observations.

At about 3.5 million, observations hit the 2sd of the projections.  Anything below that become "outliers" like 2007, 2012.


I am an energy reservoir seemingly intent on lowering entropy for self preservation.

Jim Hunt

  • First-year ice
  • Posts: 6273
  • Don't Vote NatC or PopCon, Save Lives!
    • View Profile
    • The Arctic sea ice Great White Con
  • Liked: 894
  • Likes Given: 87
Re: The 2016 melting season
« Reply #3234 on: July 12, 2016, 01:20:40 PM »
Area between the Pole and Prince Patrick Island

That's bordering on the "Beaufort Gyre in Overdrive" though. Are there any other suggestions? Does this help at all?


Or this?


Or this?

http://go.nasa.gov/29Eg8o8
"The most revolutionary thing one can do always is to proclaim loudly what is happening" - Rosa Luxemburg

Richard Rathbone

  • Nilas ice
  • Posts: 1738
    • View Profile
  • Liked: 388
  • Likes Given: 24
Re: The 2016 melting season
« Reply #3235 on: July 12, 2016, 01:21:12 PM »
Dr. Slater's probabilistic model (based on ice concentration AFAIK) is giving this projection for the last days of August :

- Looks like we are going into September with 4.3 M km^2 ice left, which hints at a September minimum of about 4.1 or 4.2.


Its being going down quite fast this month. Slater's model sees whats happened during July so far as fairly bad for retention chances. I'm right on the edge of dropping a bin on the July polls from my initial vote due to the way its moved.

plinius

  • Frazil ice
  • Posts: 403
    • View Profile
  • Liked: 0
  • Likes Given: 0
Re: The 2016 melting season
« Reply #3236 on: July 12, 2016, 01:26:10 PM »
Do we have any verification supporting Slater's approach. I do not want to be bashful, but I have quite some reservations to an approach that casts >20% survival probability for ice in southern Hudson. I assume this "model" is just some statistically derived equation relating ice concentration to survival?

Nick_Naylor

  • Frazil ice
  • Posts: 291
    • View Profile
  • Liked: 0
  • Likes Given: 0
Re: The 2016 melting season
« Reply #3237 on: July 12, 2016, 01:31:13 PM »
At about 3.5 million, observations hit the 2sd of the projections.  Anything below that become "outliers" like 2007, 2012.

4.5 million is consistent with the observed trend on the IJIS decadal averages, so no surprise there.

On the other hand, the fact that 3.5 million is at 2 standard deviations simply reflects uncertainty in the projection - not an attempt to show year-to-year variation in the extent. By now, we know essentially for certain that the average minimum has not yet fallen to 3.5 million.

Shared Humanity

  • Guest
Re: The 2016 melting season
« Reply #3238 on: July 12, 2016, 02:27:43 PM »
Given the the anomalously warm temperatures in the Barents, the highly fractured state of the CAB on the Atlantic side and the month long pattern (most of June) for this ice to just shift around instead of being transported through the Fram or into the Barents east of Svalbard, I still feel ice transport out of the CAB on the Atlantic side holds the key to this melt season. If a high sets up over Greenland/CAA with a low over on the Russian side, watch out. As many on this site have pointed out to me, it all depends on the weather.

Tigertown

  • Nilas ice
  • Posts: 1678
    • View Profile
  • Liked: 24
  • Likes Given: 20
Re: The 2016 melting season
« Reply #3239 on: July 12, 2016, 03:07:10 PM »
Jim Hunt if you are trying to say there is going to be some kind of core of multi-year ice left, then I hope you are right. How large that area will be only time will tell. I personally am not trying to say every crystal of ice in the Arctic will melt this year. The thing is the ice looked so good overall and everything appeared to be in an incredible stall, but then what did go down, went down fast. I could care less about a stupid record. I just see what is in front of my eyes. This year is going to be worse than the June "stall" made it appear it would be.
"....and the appointed time came for God to bring to ruin those ruining the earth." Revelation 11:18.

Archimid

  • Young ice
  • Posts: 3511
    • View Profile
  • Liked: 899
  • Likes Given: 206
Re: The 2016 melting season
« Reply #3240 on: July 12, 2016, 03:26:03 PM »
Quote
On the other hand, the fact that 3.5 million is at 2 standard deviations simply reflects uncertainty  in the projection  not an attempt to show year-to-year variation in the extent.

Very true. But I would like to point out the significance of another record low have in the next set of projections. As it is, because no year before has been higher than projections, instead they have been consistently  and outlyingly low,  even a 4.5 may warrant  another downward adjustment to the projections.

Quote
By now, we know essentially for certain that the average minimum has not yet fallen to 3.5 million.

3.5 million sounds great when compared with the decaying  trend of the arctic of the last decade. When compared to the arctic of the 80's the difference is  significant.


« Last Edit: July 12, 2016, 04:37:10 PM by Archimid »
I am an energy reservoir seemingly intent on lowering entropy for self preservation.

Jim Hunt

  • First-year ice
  • Posts: 6273
  • Don't Vote NatC or PopCon, Save Lives!
    • View Profile
    • The Arctic sea ice Great White Con
  • Liked: 894
  • Likes Given: 87
Re: The 2016 melting season
« Reply #3241 on: July 12, 2016, 03:35:19 PM »
I just see what is in front of my eyes.

Likewise, although to some extent that does of course depend on where one looks.

Amongst other things I'm trying to say that personally I find BBR's style strangely reminiscent of David Rose & Co.

"Has The Ice Clearly Broken Completely In Two Now?"

Quote
If you are trying to say there is going to be some kind of core of multi-year ice left, then I hope you are right.

Likewise.
"The most revolutionary thing one can do always is to proclaim loudly what is happening" - Rosa Luxemburg

plinius

  • Frazil ice
  • Posts: 403
    • View Profile
  • Liked: 0
  • Likes Given: 0
Re: The 2016 melting season
« Reply #3242 on: July 12, 2016, 03:57:28 PM »
If I was on the payroll of Heartland or Koch, I would do exactly that - go to places like the arctic sea ice forum and quench any conducive debate with irrational howling about invented catastrophes. If you can't beat your enemy, make a puppet become your enemy.

Richard Rathbone

  • Nilas ice
  • Posts: 1738
    • View Profile
  • Liked: 388
  • Likes Given: 24
Re: The 2016 melting season
« Reply #3243 on: July 12, 2016, 04:07:17 PM »
Do we have any verification supporting Slater's approach. I do not want to be bashful, but I have quite some reservations to an approach that casts >20% survival probability for ice in southern Hudson. I assume this "model" is just some statistically derived equation relating ice concentration to survival?

I thought that. Then I checked how long ice lasted in the Hudson in the past few years. The model has it right. There is a non-zero chance of ice into September there.

The methodology was presented (poster) at AGU 2013 and its beaten every other method in SIPN over the past three years for predicting minimum extent from 50 days out. Predicting what it will say in 3 weeks time is fairly dodgy, but what it says the minimum will be once we get to August is not worth betting against.

Ajpope85

  • New ice
  • Posts: 41
    • View Profile
  • Liked: 8
  • Likes Given: 0
Re: The 2016 melting season
« Reply #3244 on: July 12, 2016, 05:21:21 PM »
      He was remarkably close last year


What is anomaly persistence?

Tigertown

  • Nilas ice
  • Posts: 1678
    • View Profile
  • Liked: 24
  • Likes Given: 20
Re: The 2016 melting season
« Reply #3245 on: July 12, 2016, 06:00:12 PM »
The best that I can tell you is that it is an adjustment for extrapolating based on an expected anomaly. If someone can do better,please?
"....and the appointed time came for God to bring to ruin those ruining the earth." Revelation 11:18.

plinius

  • Frazil ice
  • Posts: 403
    • View Profile
  • Liked: 0
  • Likes Given: 0
Re: The 2016 melting season
« Reply #3246 on: July 12, 2016, 06:01:57 PM »
I thought that. Then I checked how long ice lasted in the Hudson in the past few years. The model has it right. There is a non-zero chance of ice into September there.

The methodology was presented (poster) at AGU 2013 and its beaten every other method in SIPN over the past three years for predicting minimum extent from 50 days out. Predicting what it will say in 3 weeks time is fairly dodgy, but what it says the minimum will be once we get to August is not worth betting against.

Richard - I am not aware of _any_ sea ice surviving in the main Hudson Bay over the past 30 years. Are you possibly mixing this up with the Foxe Basin?

Peter Ellis

  • Grease ice
  • Posts: 619
    • View Profile
  • Liked: 33
  • Likes Given: 14
Re: The 2016 melting season
« Reply #3247 on: July 12, 2016, 06:02:33 PM »
"Anomaly persistence" is simply assuming that because we are X km^2 below average today, we will still be X km^2 below average at the end of the season.  It's pretty much a null hypothesis - if your preferred prediction method can't do better than that, you're in trouble.

Tigertown

  • Nilas ice
  • Posts: 1678
    • View Profile
  • Liked: 24
  • Likes Given: 20
Re: The 2016 melting season
« Reply #3248 on: July 12, 2016, 06:48:22 PM »
I take it that Slater simply includes it in his graph for a comparison.
"....and the appointed time came for God to bring to ruin those ruining the earth." Revelation 11:18.

Neven

  • Administrator
  • First-year ice
  • Posts: 9518
    • View Profile
    • Arctic Sea Ice Blog
  • Liked: 1337
  • Likes Given: 618
Re: The 2016 melting season
« Reply #3249 on: July 12, 2016, 07:01:09 PM »
Some more info in my latest blog post: 2016 Melting momentum, part 3

Melting momentum is really low according to Dr. Schröder's melt pond fraction simulation:

The enemy is within
Don't confuse me with him

E. Smith