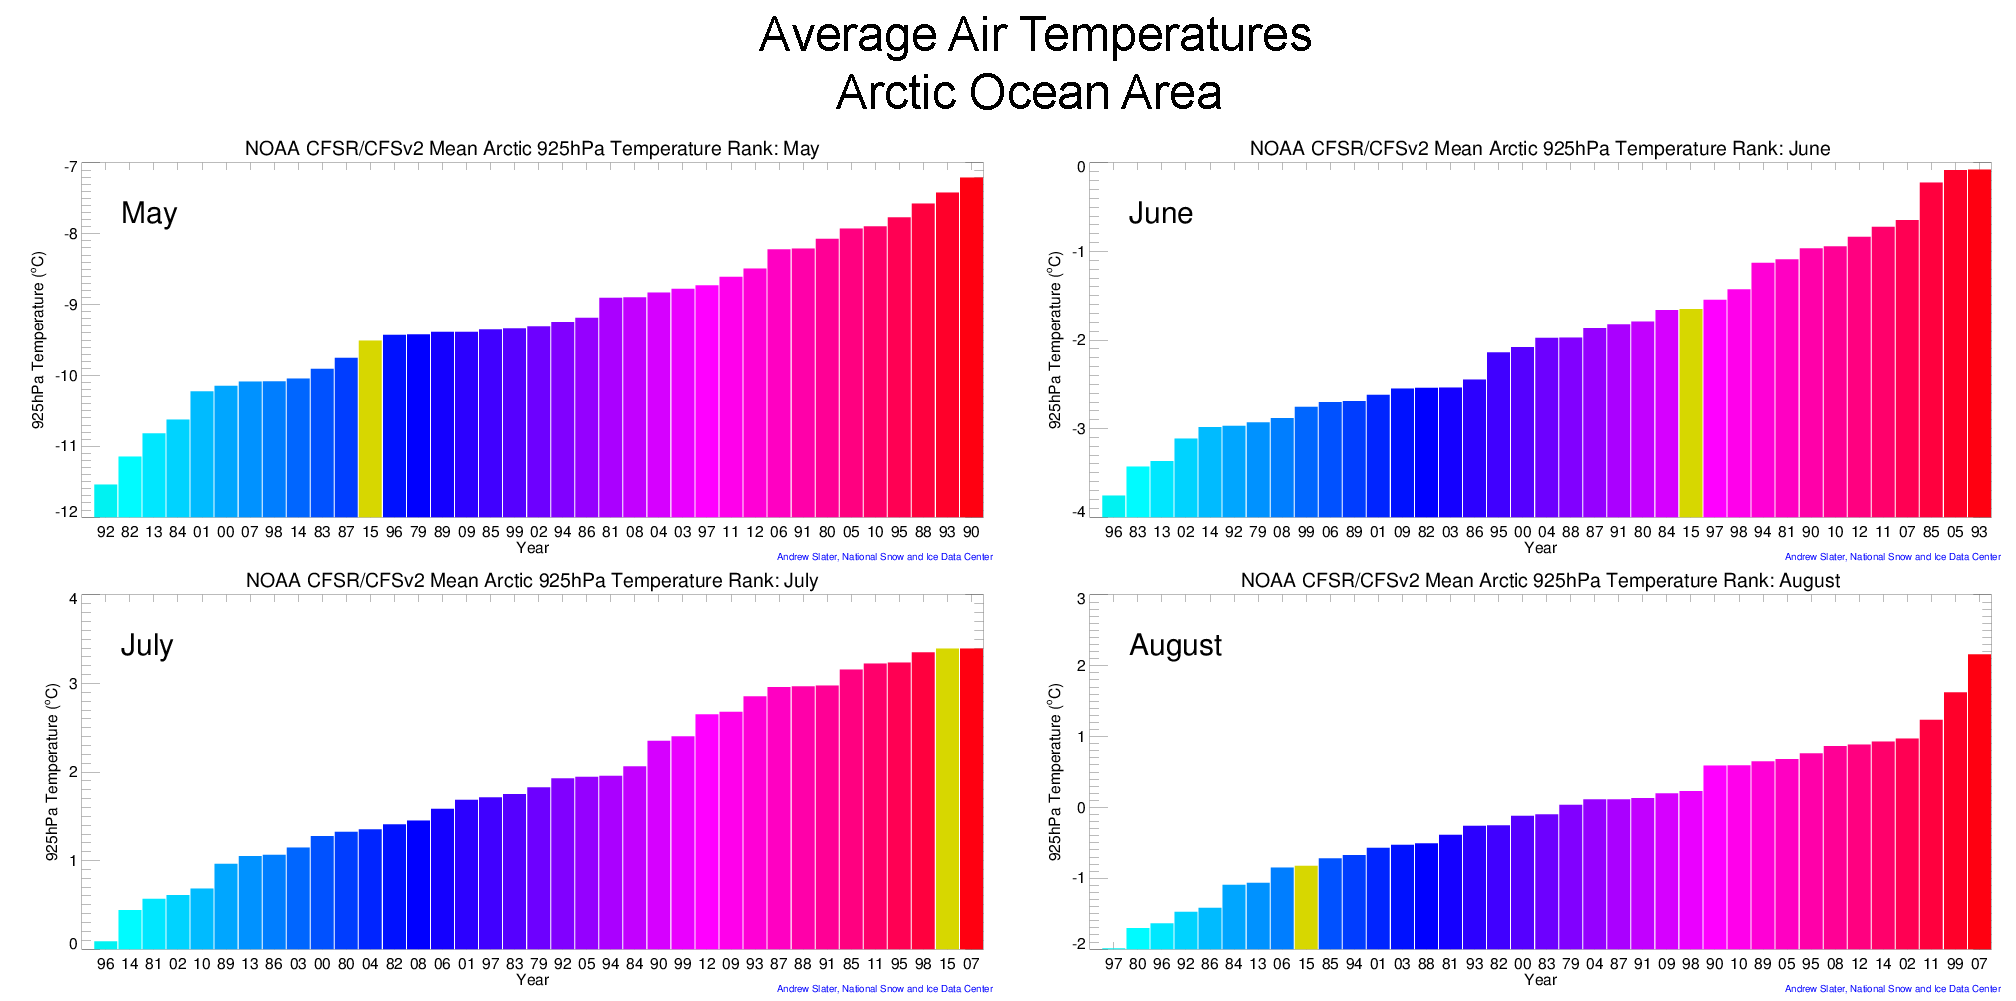
Here you go, from NSIDC summarizing of melt season 2015, courtesy National Snow and Ice Data Center. http://nsidc.org/arcticseaicenews/files/1999/10/airtemp.png
Was it sarcasm? If so, disregard the following... /blush
Ain't summarizing no melt season, this thing, in any significant part to talk of. It's about air temperatures, and this is why it does not relate any ice melt season to any other melt season any reliably, except it would - somewhat, - for any melt seasons which have very close or same sea ice extent and area for every week (at least; or better every day) of the whole season. But we don't have any such seasons on record, do we.
Why? Because as most people here know very well, amount and speed of melt of Arctic sea ice depends on several major variables, air temperatures being only one of them; not even the main of them. Years of talk about winds, pressure, water currents, salinity, albedo, waviness/storms, temperature profiles, thickness, "quality" of ice and other things, - everyone who have been here for any long can tell: extremely very different melt seasons can be while air temperature would remain very much the same. Especially when those melt seasons have massively different ice cover at any given date.
Which those graphs themselves clearly confirm: we know early 80s' melt seasons were different from 2010s' seasons in the "less and slower melt" way generally, yet we see many of them 80s' and 2010s' melt seasons happened with rather similar air temperatures. Take for example '79 and '14; the latter was "colder air" for all 4 months presented except August, and so what - 2014 melt season had less melt than '79? Gee. It hadn't. Checked CT interactive just to be sure - yep, 2014 melt season had significantly larger area lost during it, and over way shorter time frame. So those graphs defeats their own "purpose" (of being any indication of "a melt season") with their own data. Funny.
And then look at '13! Cold (relatively to most other years on these graphs) air for all 4 months presented for '13. Should be way slower melt than most other years, then? Way slower than most 80's? It just doesn't work that way, there is no correlation to speak of...
And i believe, if we take a glass with some ice cubes, have it at room temperature, and put a lid on it, - the air under the lid will be remain nearly 0°C both when ice cubes start to melt, and when ice cubes are nearly gone. Courtesy of specific heat of melt, - as long as there is small yet significant amount of solid ice at the surface, incoming heat (which goes in from the room through the glass' walls) is spent to melt the ice 1st, not to warm up air and surface water.
P.S. I suspect they think something like "oh look, August 2015 had real cool air in Arctic, that's why the melt in August was damn slow". Wrong. It was damn slow melt because of whole complex of causes, and cold air temperatures IMHO was more a consequence than a cause, whole process considered... Air temperature is not proper thing to be any indicator here, as demonstrated just above with '79 vs '14 and '13 example.


