Support the Arctic Sea Ice Forum and Blog

Author Topic: Quantifying albedo effect / Rating daily area values  (Read 45676 times)

Tealight

  • Frazil ice
  • Posts: 490
    • View Profile
    • CryosphereComputing
  • Liked: 176
  • Likes Given: 17
Quantifying albedo effect / Rating daily area values
« on: May 14, 2016, 10:12:18 PM »
I wanted to investigate if the arctic albedo is the main factor during a melting season or if warmth from lower latitudes and weather is a bigger factor. On the forum we always talk about preconditioning from melt ponds and ice free areas leading to self-reinforcing melt.

Another motivation was to give each daily area value a weight. A low value in June should be more significant than a low value in September, since most sunlight is already gone by then.

To estimate the albedo I used Cryosphere Today area data, which is prone to show low concentrations in low albedo areas. Normally this is bad to estimate the true sea ice area, but for my calculations it gives a good albedo value. The first image shows an example from 2nd July 2012.

Currently the model is only able to calculate with one latitude for the entire arctic and doesn’t give a perfect representation. However the error isn’t huge since the sea ice area value is most important. A gridded concentration dataset would improve accuracy, but might not be possible in Excel because it requires millions of calculations steps. If I develop a second version, it will consider gridded concentration.

The model calculates the following every half hour for each day: solar zenith angles, the atmospheric reduction (Air mass), Projection effect and albedo for water and snow surfaces.
The final value (kWh/m2) is then multiplied with the water or ice area respectively. See Block diagram for an overview of the calculations.

For simplicity the model assumes clear sky all the time and no energy loss to space. It is not a weather model, just a surface albedo rating.

Bibliography:
A review of snow and ice albedo and the development of a new physically based broadband albedo parameterization, Alex S. Gardner and Martin J. Sharp -https://www.researchgate.net/publication/228755070_A_review_of_snow_and_ice_albedo_and_the_development_of_a_new_physically_based_broadband_albedo_parameterization
http://pveducation.org/
https://en.wikipedia.org/wiki/Solar_irradiance
https://upload.wikimedia.org/wikipedia/en/7/7f/Water_reflectivity.jpg


Tealight

  • Frazil ice
  • Posts: 490
    • View Profile
    • CryosphereComputing
  • Liked: 176
  • Likes Given: 17
Re: Quantifying albedo effect / Rating daily area values
« Reply #1 on: May 14, 2016, 10:13:44 PM »
The results:
Data: Cryosphere Today until 4th April 2016
After 4th April 2016 data calculated by Wipneus, (accurate to a few thousand km2)

For now only years 2007-2016 are shown, because previous years would only distort every recent year into a positive anomaly and make even 2009/2013 look like an average season. In terms of Albedo this is true, but it decreases the models ability for forecasting melt under post 2007 ice conditions.

The daily absorption graph shows a peak in July, when the solar declination is still high and the sea ice has melting ponds. At the end of July the decreasing solar declination outweighs the sea ice loss and the absorption goes down again.

The Sum graph adds all daily values together. If all ice were to be evenly distributed and no heat loss occurs then the ice could be melted by mid-June at 2041 PWh. (Energy for 2016 max ice volume)


Most useful in my opinion are the anomaly graphs, because the actual energy value has no real scientific meaning.

As can be seen 2007 and 2011 started with high positive anomaly and continued to do so until the rest of the melting season. 2009 and 2013 show the opposite behaviour starting with negative anomaly and continued to drop until the end of the season. 2010 and even more so 2012 had a negative anomaly until June, but then shot upwards due to extreme low albedo in June/July. No year managed to do the opposite from a strong positive anomaly to negative anomaly. Only 2008 and 2014 went from average to negative anomaly. 2015 stayed at slightly positive all the time and 2016 seems to shoot into unknown territory for positive anomaly.

As a conclusion it can be said that albedo plays a major role in the melting season, but until now June/July is the time that defines if a year has a strong melting season or a weak one.  Maybe 2016 will show that May can be just as important.

Feel free to use it as a tool to predict the September minimum, add your knowledge about the reasons why individual years turned out the way they did or suggest general improvements.

bbr2314

  • Nilas ice
  • Posts: 1817
    • View Profile
  • Liked: 158
  • Likes Given: 53
Re: Quantifying albedo effect / Rating daily area values
« Reply #2 on: May 14, 2016, 11:56:26 PM »
This is fascinating and begs an additional question: could you apply this model to the NHEM land areas as well and calculate albedo/changes over past years? I would think a relationship exists and I am very curious to see what it specifically looks like. This would be affected by both changes in vegetation and yearly snowcover, and would be particularly helpful if we could break it down by continent.

Tealight

  • Frazil ice
  • Posts: 490
    • View Profile
    • CryosphereComputing
  • Liked: 176
  • Likes Given: 17
Re: Quantifying albedo effect / Rating daily area values
« Reply #3 on: May 15, 2016, 01:50:18 AM »
After I found out how to use gridded data, the basic model can be used for the entire surface of earth. The problem is to get reliable data. Especially the land surface has numerous different  surfaces  (forest, field, desert, cities,...)

If there is a site that publishes surface albedo, then I guess we can could get a reasonable result. At mid latitudes the albedo vs angle isn't as important as in the arctic.

DavidR

  • Grease ice
  • Posts: 740
    • View Profile
  • Liked: 36
  • Likes Given: 3
Re: Quantifying albedo effect / Rating daily area values
« Reply #4 on: May 15, 2016, 04:19:45 AM »
Great piece of work Tealight.  Using the single latitude 75N seems a good choice as it covers the main Arctic rather than periperal seas.  It is also a latitude where the ice extent varies over the entire season.

Like so many measures this year, the graphs emphasise the exceptionalness of this year. The planet  is not so much creating records as smashing records. The fact that the graphs show the effect of the rapid ice loss in June 2012 indicates they provide a useful indicator of how the year may pan out based on albedo effects.
Toto, I've a feeling we're not in Kansas anymore

mmghosh

  • New ice
  • Posts: 62
    • View Profile
  • Liked: 2
  • Likes Given: 63
Re: Quantifying albedo effect / Rating daily area values
« Reply #5 on: May 15, 2016, 04:32:10 AM »
Really fascinating.  Scary, if confirmed.

Tealight

  • Frazil ice
  • Posts: 490
    • View Profile
    • CryosphereComputing
  • Liked: 176
  • Likes Given: 17
Re: Quantifying albedo effect / Rating daily area values
« Reply #6 on: May 15, 2016, 11:15:44 AM »
Great piece of work Tealight.  Using the single latitude 75N seems a good choice as it covers the main Arctic rather than periperal seas.  It is also a latitude where the ice extent varies over the entire season.

Thanks

I wanted to publish it as soon as possible because 2016 is so exceptional. Otherwise I would have waited until I get the gridded calculations done. For latitudes above 75N the June 2012 anomaly is even more pronounced, but the affected area gets really small. The last degree of latitude 89N to 90N for example  is just 77,694 km2
.
75N was the center line for my arctic ocean area estimate.

Tealight

  • Frazil ice
  • Posts: 490
    • View Profile
    • CryosphereComputing
  • Liked: 176
  • Likes Given: 17
Re: Quantifying albedo effect / Rating daily area values
« Reply #7 on: May 23, 2016, 06:25:39 PM »
Small update

I added an approximate heat loss to space to give a further indication of what the values mean. The heat loss to space is based on black-body radiation for average 80N DMI temperatures.
The main unknown component in the heat loss calculation is the effect of greenhouse gases for the Arctic Ocean. I couldn't find an equation or tables of back radiation for different water vapour, CO2 or methane levels, only average radiation values for the entire earth.

So I approximated it by finding out how much back radiation the Persian Gulf needs to sustaing a summer surface temperature of 32 degrees. The Gulf has almost never cloud cover like my model and has similar water vapor concentrations as the Arctic Ocean. Only the evaporation heat loss is different.

In the end I came up with a back radiation value of 40% compared to the global average of 62.5%.

The graphs now show negative energy values, because the snow reflects most of the solar radiation back to space. It makes more sense because temperatures can still fall in May/June even with 24h daylight.

The anomaly graph is still the same as before.

Andreas T

  • Nilas ice
  • Posts: 1149
    • View Profile
  • Liked: 18
  • Likes Given: 4
Re: Quantifying albedo effect / Rating daily area values
« Reply #8 on: May 23, 2016, 08:30:10 PM »
some PROMICE weatherstations http://www.promice.org/CurrentWeatherMap.html give measured values for incoming shortwave and longwave radiation. The curve for incoming LW shows how much this varies. This is why clouds can make up for lost incoming SW with increased incoming LW.
Also have a look at what is being done for CERES https://ceres-tool.larc.nasa.gov/ord-tool/jsp/EBAFSFCSelection.jsp
I have started to collect information on a thread in arctic background which is called OLR in the arctic http://forum.arctic-sea-ice.net/index.php/topic,749.msg20402.html#msg20402. Not a good title I should have called it "radiation radiative balance"
« Last Edit: May 24, 2016, 02:34:41 PM by Andreas T »

Rob Dekker

  • Nilas ice
  • Posts: 2386
    • View Profile
  • Liked: 120
  • Likes Given: 119
Re: Quantifying albedo effect / Rating daily area values
« Reply #9 on: May 24, 2016, 07:27:56 AM »
Tealight, that is great work !
Albedo effect on sea ice melt is my favorite topic, and I've done some work on that in the past :
http://neven1.typepad.com/blog/2013/07/problematic-predictions-2.html

What I found there is that, yes, sea ice "area" plays an important role in albedo effect and ice melt, but other factors are also involved :

1) The influence of "land snow cover" is crucial. Not only does "snow cover" serve as a sort of "thermometer" of the Arctic (if it is warmer, there is less snow) but equally important is it's albedo effect, which works as a "feedback". For example : In June, with insolation averaging at 280 W/m^2, just a 1 M km^2 of snow cover anomaly generates a whopping 2,800 TW heat source very close to the ice.

2) The influence of dark ocean right next to the ice is important : For polynia and melting ponds, the sun's energy goes right into the ice, almost certainly directly causing ice melt.
I fingured that Extent - Area is a reasonable variable to consider as this "open water right next to the ice", which has a stronger, more direct influence to sea ice melt than "area" or "land snow cover" itself.

So, I figured that there are different parameters to these variables (snow cover and "extent-area" and "area") which combined produce a formula that is indicative of how these albedo-varying variables affect sea ice melt.

Result is that (using linear regression) these 'albedo' variables combined serve as a pretty good "predictor" of final sea ice extent in September :
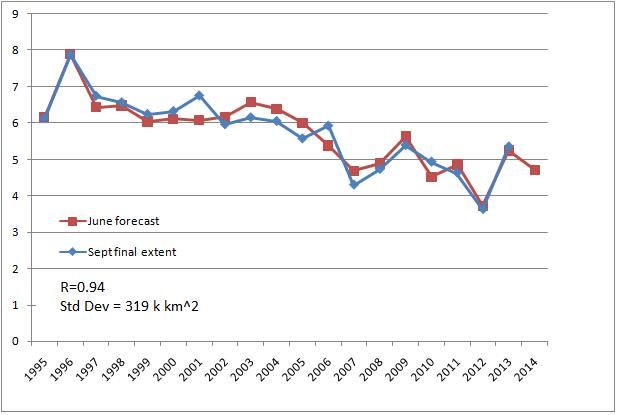

What I have not done yet, and which is where you are ahead of me, is to produce a "day-to-day" model of how these variables ultimately affect sea ice melt.

Maybe we can combine forces and produce a prediction model that works on day-to-day basis ?
Caveat : There does not seem to be any day-to-day "land snow" data available.
Only monthly data from Rutgers Snow Lab.
This is our planet. This is our time.
Let's not waste either.

Rob Dekker

  • Nilas ice
  • Posts: 2386
    • View Profile
  • Liked: 120
  • Likes Given: 119
Re: Quantifying albedo effect / Rating daily area values
« Reply #10 on: May 24, 2016, 07:30:39 AM »
Sorry, that 1 M km^2 snow cover anomaly is a 280 TW heat source. Still an awesome amount of heat.
This is our planet. This is our time.
Let's not waste either.

Tealight

  • Frazil ice
  • Posts: 490
    • View Profile
    • CryosphereComputing
  • Liked: 176
  • Likes Given: 17
Re: Quantifying albedo effect / Rating daily area values
« Reply #11 on: May 24, 2016, 10:59:19 PM »
some PROMICE weatherstations http://www.promice.org/CurrentWeatherMap.html give measured values for incoming shortwave and longwave radiation. The curve for incoming LW shows how much this varies. This is why clouds can make up for lost incoming SW with increased incoming LW.
Also have a look at what is being done for CERES https://ceres-tool.larc.nasa.gov/ord-tool/jsp/EBAFSFCSelection.jsp
I have started to collect information on a thread in arctic background which is called OLR in the arctic http://forum.arctic-sea-ice.net/index.php/topic,749.msg20402.html#msg20402. Not a good title I should have called it "radiation radiative balance"

Thanks for the links. I have a look and see what I can use.


...
Maybe we can combine forces and produce a prediction model that works on day-to-day basis ?

Sure I would love to. At the moment my main objective is to convert my current model with a single latitude to a gridded model, because the insolation varies significantly with latitude around the equinox.

It is also a step to move away from Excel to a better suited program. When I created a huge table to calculate daily kWh for latitudes 40-90N, using 0.25 degree steps and 15min time steps for solar zenith angle it took ages to load the file. For reference it had around 4 million values with over 100 million calculations steps. The final table has just 37,386 values and loads within a fraction of a second.


Rob Dekker

  • Nilas ice
  • Posts: 2386
    • View Profile
  • Liked: 120
  • Likes Given: 119
Re: Quantifying albedo effect / Rating daily area values
« Reply #12 on: May 25, 2016, 07:57:28 AM »
Sure I would love to. At the moment my main objective is to convert my current model with a single latitude to a gridded model, because the insolation varies significantly with latitude around the equinox.

Going gridded is a commendable effort, but remember that insolation does not vary THAT much with latitude around the equinox. Just some 10%, and within the ice margin (70-80deg) only some 5%.
https://tamino.files.wordpress.com/2012/10/insol.jpg

That variation is negligent variation compared to the actual insolation on the ground, as Andreas' links and graphs suggest.

Please let me know when you want to include land snow cover or polynia/melting ponds into your calculations. I'd love to help out.
This is our planet. This is our time.
Let's not waste either.

Tealight

  • Frazil ice
  • Posts: 490
    • View Profile
    • CryosphereComputing
  • Liked: 176
  • Likes Given: 17
Re: Quantifying albedo effect / Rating daily area values
« Reply #13 on: May 25, 2016, 03:42:04 PM »
...remember that insolation does not vary THAT much with latitude around the equinox. Just some 10%, and within the ice margin (70-80deg) only some 5%.
https://tamino.files.wordpress.com/2012/10/insol.jpg
...
what you described is the summer solstice in June and not the equinox in March/September. I extra looked up the correct terminology before posting my comment.


Adding snow cover to my model is no problem. even with only monthly values linear interpolation should give reasonable results. Your (Extent minus Area) figure is kind of already included. I just need to get all daily extent data and replace my constant maximum extent (14*106 km2) with these values.

What I'm not exactly sure about is how to transform my model into a numerical forcast for the September minimum. At the moment it is just a heat accumulation model, which quantifies the thermal energy in the Arctic. It doesn't calculate if the energy is used for melting more ice or if it increases water temperature which delays refreezing and limits ice thickening in winter.

Rob Dekker

  • Nilas ice
  • Posts: 2386
    • View Profile
  • Liked: 120
  • Likes Given: 119
Re: Quantifying albedo effect / Rating daily area values
« Reply #14 on: May 26, 2016, 07:59:44 AM »
what you described is the summer solstice in June and not the equinox in March/September. I extra looked up the correct terminology before posting my comment.

I'm sorry. I got confused.
I thought you meant the summer solstice.
Yet, the insolation around the equinox (on the latitudes where there is sea ice) is so small that even wide variation doesn't seem to matter much for your albedo energy calculations.

What to do next depends on where you want to take this.

If you want to just calculate for Arctic albedo, then using sea ice "area" (and land snow cover) will give you a good metric. (No need to get 'extent' involved).

If you want to actually calculate (estimate) (day-to-day, or accumulated) how much more energy the Northern Hemisphere absorbs due to reduced ice cover (and snow cover) than you would need to estimate how much of that TOA insolation makes it to the ground, and what the difference in albedo is between open water and sea ice, and between open ground and land snow cover.
For that, Hudson 2011 may be a good reference.
Tamino uses that too with his model, and he gets to an estimated 0.2 factor (reduction of insolation w.r.t. TOA).
https://tamino.wordpress.com/2012/10/01/sea-ice-insolation/

Let me note that Tamino's goal was to calculate albedo 'forcing' (global), so in that respect your calculations (day-to-day and calculating albedo energy input into the Arctic) are already more refined.

But if your goal is to build a sea-ice extent (at end of season) estimation model, then you would need to consider the influence of these albedo factors (like sea ice "area" and land snow cover) on how they affect sea ice melt. To do that, I came up with some parameters for these factors, set them to "educated guesses" and then refine them based on linear regressions. There, you may also want to include something like "extent - area" since that represents open water right next to the ice, which almost certainly has a rather direct effect on ice melt.

All in all, I like your approach and it has a lot of potential for developing a 'running' sea ice extent estimation model. But let me know how far you want to go.
This is our planet. This is our time.
Let's not waste either.

Paddy

  • Nilas ice
  • Posts: 1074
    • View Profile
  • Liked: 166
  • Likes Given: 185
Re: Quantifying albedo effect / Rating daily area values
« Reply #15 on: May 26, 2016, 03:39:05 PM »
Will be very interesting to see how long 2016 stays ahead of the curve on albedo. Forecasts would seem to suggest it won't stop soon.

JimboOmega

  • Frazil ice
  • Posts: 140
    • View Profile
  • Liked: 2
  • Likes Given: 0
Re: Quantifying albedo effect / Rating daily area values
« Reply #16 on: May 27, 2016, 12:11:56 AM »
This is great work.  Wish I'd seen this before going on about not knowing the scale in the main thread.

How do these values, regardless of scale, compare to say ocean heat transport variation (in Svedrups, usually?, atmospheric heat transport and river outflow heat transport?  Those seem to be the big 4, and I'd like to get a sense of how they compare, so we can stop worrying about minor things (or decide all 4 are significant at the large scale)

JimboOmega

  • Frazil ice
  • Posts: 140
    • View Profile
  • Liked: 2
  • Likes Given: 0
Re: Quantifying albedo effect / Rating daily area values
« Reply #17 on: May 27, 2016, 12:20:16 AM »
Incidentally, 100 PWh / 333.55(J/g) * 1 cm^3/g = 1 079.29846 km^3

(Just using the heat of fusion of pure water, and its density, so very ballpark). 

That actually seems reasonable scale for the contribution to volume loss?

Rob Dekker

  • Nilas ice
  • Posts: 2386
    • View Profile
  • Liked: 120
  • Likes Given: 119
Re: Quantifying albedo effect / Rating daily area values
« Reply #18 on: May 27, 2016, 07:44:22 AM »
Hi Jimbo,
I've seen you ask these questions about perspective on the various heat sources into the Arctic at several forum sites now.

Here is some idea :
- River runoff : At another forum thread, I estimated that (even with 6 C water) a major river like the McKenzie inserts something like 1 TW of heat into the Arctic.
- Ocean currents : Neven's blog here
http://neven1.typepad.com/blog/2012/06/ocean-heat-flux.html
suggests that a major current like the one flowing through Bering Strait inserts about 10 - 20 TW.
- Albedo feedback on open water :
I have suggested here :
http://neven1.typepad.com/blog/2016/05/beaufort-final-update.html?cid=6a0133f03a1e37970b01b8d1ea5de2970c#comment-6a0133f03a1e37970b01b8d1ea5de2970c
that the open water in the Beaufort (some 200,000 km^2 at this point) absorbs something like 50 - 90 TW of solar power.
- Snow albedo :
Using an estimated 250 W/m^2 of on-the-ground insolation this time of year, and a 0.5 difference in albedo between no-snow and snow cover, a 1 M km^2 of land snow anomaly will absorb about 125 TW extra solar power. Some of that will go into warming the ground, but much of it will go to warming the atmosphere, some of which (probably half) will go north and thus enter the Arctic.
- Atmospheric heat input.
This varies quite a bit, with little heat entering in the early stages of the melting season, but quite a bit at the end (think August). I'd have to dig-up the paper, but I've seen estimates of some 200 W/m^2 heat input in the later parts of the melting season. Over the full 10 M km^2 of the Arctic, that is something like 2000 TW.

Does this provide some perspective... ?
This is our planet. This is our time.
Let's not waste either.

timallard

  • Frazil ice
  • Posts: 142
  • designer
    • View Profile
  • Liked: 2
  • Likes Given: 0
Re: Quantifying albedo effect / Rating daily area values
« Reply #19 on: May 27, 2016, 09:19:34 AM »
After I found out how to use gridded data, the basic model can be used for the entire surface of earth. The problem is to get reliable data. Especially the land surface has numerous different  surfaces  (forest, field, desert, cities,...)

If there is a site that publishes surface albedo, then I guess we can could get a reasonable result. At mid latitudes the albedo vs angle isn't as important as in the arctic.
On this consider open-water albedo vs snow is one value the 0.9 vs less that is now shades of gray, like a melt-pool has another, yet the heat-transfer coefficient is much different to the water below for this variation thus it's an integration.

Integrations require identities to validate actual sea-ice conditions for the variance there being a new one called "rotten" with unique structural & thermal properties.

From my research basal melting is the main factor as it reduces multi-year ice from a thermal-mass acquired for the length of the open-water gain, that is the main concern as this can be more heat than can be released in fall, that's the switch thermally.

My take from this that thickness is no longer very consistent anymore thus needs a empirically correlated equation vs albedo with the rotten ice that got cored last fall at freeze-up. It's really junky with a lot of tubes & hollows, dirty and doesn't transmit light well.

APL-UW may have datasets they did the voyages. Algorithms for this perhaps non-existent? Another view remote sensing resolution to identify the old-ice inclusions in the fast-ice thus "rotten" sections and other strategies to identify significant factors to use.

« Last Edit: May 27, 2016, 09:41:06 AM by timallard »
-tom

Tealight

  • Frazil ice
  • Posts: 490
    • View Profile
    • CryosphereComputing
  • Liked: 176
  • Likes Given: 17
Re: Quantifying albedo effect / Rating daily area values
« Reply #20 on: May 27, 2016, 02:45:16 PM »
But let me know how far you want to go.

It depends on my motivation and how much my computer can cope with. I don't have a supercomputer at home which can calculate complete physics for each km2, so it has to stay relatively simple with some correction factors.

I created a new file for melt prediction, with daily data for sea ice volume, extent, area, northern snow cover and my albedo (energy) calculations. Maybe I can create something useful from all of this for short to medium forcasts.

The absorbed energy in July (ocean only so far) for example has some correlation with the September minimum

JimboOmega

  • Frazil ice
  • Posts: 140
    • View Profile
  • Liked: 2
  • Likes Given: 0
Re: Quantifying albedo effect / Rating daily area values
« Reply #21 on: May 27, 2016, 09:23:00 PM »
Hi Jimbo,
I've seen you ask these questions about perspective on the various heat sources into the Arctic at several forum sites now.

Here is some idea :

(...)

It does sound like currents and especially rivers are small fry compared to atmosphere and insolation

So the next question I'd have is... to what extent are these subject to anomaly?  You gave the anomaly number for insolation (it's the "easiest" to ballpark), but the overall number for atmosphere.

But both peak (as heat sources) in the ~200 W/m^2 range, so as a very rough ballpark, I can say "both matter".  And of course as we talk about all the time, weather impacts insolation in non-albedo ways.

I also assumed in my calculation above (which I've thought about a good deal) that heat transport is perfect, so that any marginal heat added gets applied at the water/ice interface.  From what I've seen, the ice isn't all that cold, so heat getting transferred to it shouldn't matter as much as the heat of fusion.

Granted in contrast to your model just knowing that number (of marginal ice volume melted because of albedo) doesn't have predictive power because it doesn't directly give you an extent number, and so the feedback effect is lost, but it's still a cool number to know.

And btw, good luck on figuring out albedo variation versus all the different possible types and conditions of ice.  I figure that sort of thing is a nightmare to calculate but easier (with a satellite) to measure?

For that matter, if we have a good satellite photo, can't we just average the reflectivity of the entire area - clouds and all? If our satellite can measure longwave, so much the better, we can see exactly how much outbound radiation there is (reflected or emitted), and we know how much it receives, 

Rob Dekker

  • Nilas ice
  • Posts: 2386
    • View Profile
  • Liked: 120
  • Likes Given: 119
Re: Quantifying albedo effect / Rating daily area values
« Reply #22 on: May 28, 2016, 07:46:42 AM »
The absorbed energy in July (ocean only so far) for example has some correlation with the September minimum

Yes. Now you are seeing some of the correlation that I found in the monthly data.
Just be careful : If you correlate absorbed energy (mainly judged by ice "area") then there will be implicit correlation with September ice extent (low area in July means low area in September).
A better metric may be to correlate ice LOSS (after July) against absorbed energy. But there you need to be careful since some of the absorbed energy until July already caused ice losses until July.
So this is not easy.
This is our planet. This is our time.
Let's not waste either.

Rob Dekker

  • Nilas ice
  • Posts: 2386
    • View Profile
  • Liked: 120
  • Likes Given: 119
Re: Quantifying albedo effect / Rating daily area values
« Reply #23 on: May 28, 2016, 07:50:32 AM »
For that matter, if we have a good satellite photo, can't we just average the reflectivity of the entire area - clouds and all? If our satellite can measure longwave, so much the better, we can see exactly how much outbound radiation there is (reflected or emitted), and we know how much it receives,

That is a GREAT suggestion, and it could be done by analyzing the MODIS images (available daily).
I have not seen anyone actually trying that, although MODIS does not have much history (they also had a disk-crash in 2010 IIRC, which wiped out much of the prior years of observation).
This is our planet. This is our time.
Let's not waste either.

Andreas T

  • Nilas ice
  • Posts: 1149
    • View Profile
  • Liked: 18
  • Likes Given: 4
Re: Quantifying albedo effect / Rating daily area values
« Reply #24 on: May 28, 2016, 08:29:21 AM »
For that matter, if we have a good satellite photo, can't we just average the reflectivity of the entire area - clouds and all? If our satellite can measure longwave, so much the better, we can see exactly how much outbound radiation there is (reflected or emitted), and we know how much it receives,

That is a GREAT suggestion, and it could be done by analyzing the MODIS images (available daily).
I have not seen anyone actually trying that, although MODIS does not have much history (they also had a disk-crash in 2010 IIRC, which wiped out much of the prior years of observation).
It would be interesting to have this TOA (top of atmosphere) balance of radiation flux as a quick homemade version of what CERES is doing. But you have to keep in mind that what you see there is not what happens at the surface. IR emission at cloud top level is not necessarily the same as the balance of emission and absorption at the surface. You can have clouds radiating heat which comes from latent heat brought there by humid air from elsewhere.
There are also issues about daily variation of clouds (MODIS images are taken around midday) and not all reflected shortwave radiation being seen by MODIS. CERES / EBAF is taking these things into account for example by making use of data from geostationary satellites  AFAIK.
But maybe this can be factored in on the basis of a limited range of surface types (open water, snow, ponded ice)

Rob Dekker

  • Nilas ice
  • Posts: 2386
    • View Profile
  • Liked: 120
  • Likes Given: 119
Re: Quantifying albedo effect / Rating daily area values
« Reply #25 on: May 28, 2016, 10:13:08 AM »
Granted in contrast to your model just knowing that number (of marginal ice volume melted because of albedo) doesn't have predictive power because it doesn't directly give you an extent number, and so the feedback effect is lost, but it's still a cool number to know.

Most of the ice that melts will be First Year Ice, which does not vary that much in thickness (square-root of FDD, as Chris Reynolds explained).

In fact, now that most of the MYI is out of the picture, FYI will be a better estimate for thickness of ice that will melt out than in the past, so in fact makes predictions easier.
This is our planet. This is our time.
Let's not waste either.

Frivolousz21

  • Nilas ice
  • Posts: 1918
  • Live in Belleville, IL..15 miles SE of St. Louis.
    • View Profile
  • Liked: 608
  • Likes Given: 7
Re: Quantifying albedo effect / Rating daily area values
« Reply #26 on: May 28, 2016, 10:55:54 AM »
Will be very interesting to see how long 2016 stays ahead of the curve on albedo. Forecasts would seem to suggest it won't stop soon.

The upper level ridging looks much more ominous than what is forecast at the low to mid levels.

However this isn't much different from many huge years.

But if we are going to see a historic melt season in the CAB having a massive GIS ridge with huge CAA WAA and sunny CAB is paramount right now.

That's how 2012 broke the mold.

The models hose the chuchki, ESS, and Atlantic side.

That will give record drops but come August when the CAB is doing ok it wont be enough.

2015 had the warmest July on record.  Huge WAA INTO THE CAB. 

wasn't even close to 2011-or 2012 there
I got a nickname for all my guns
a Desert Eagle that I call Big Pun
a two shot that I call Tupac
and a dirty pistol that love to crew hop
my TEC 9 Imma call T-Pain
my 3-8 snub Imma call Lil Wayne
machine gun named Missy so loud
it go e-e-e-e-ow e-e-e-e-e-e-blaow

JimboOmega

  • Frazil ice
  • Posts: 140
    • View Profile
  • Liked: 2
  • Likes Given: 0
Re: Quantifying albedo effect / Rating daily area values
« Reply #27 on: May 31, 2016, 09:28:38 PM »
It would be interesting to have this TOA (top of atmosphere) balance of radiation flux as a quick homemade version of what CERES is doing. But you have to keep in mind that what you see there is not what happens at the surface. IR emission at cloud top level is not necessarily the same as the balance of emission and absorption at the surface. You can have clouds radiating heat which comes from latent heat brought there by humid air from elsewhere.

True, you could have heat that comes in via atmospheric transport, and then leaves via longwave radiation, without interacting with the ice/sea/atmosphere interface.  But that's still heat lost from the overall arctic system, and I imagine it'd be small.

But my imagination is not science, and I'd be curious to know how much extra longwave is getting sent up to space by a warm wet cloud. 

In my ideal world we bound the arctic system and look at the overall heat balance, but I realize that is impractical, especially when we consider deeper ocean stuff (deeper than the Bering straight, anyway), heat absorbed by land itself (not just its snowpack), etc.

Also FWIW I don't see 2016 reverting to the mean on albedo, because there are positive feedback effects. At least until we get past the peak insolation period.

Andreas T

  • Nilas ice
  • Posts: 1149
    • View Profile
  • Liked: 18
  • Likes Given: 4
Re: Quantifying albedo effect / Rating daily area values
« Reply #28 on: May 31, 2016, 09:57:53 PM »
...
True, you could have heat that comes in via atmospheric transport, and then leaves via longwave radiation, without interacting with the ice/sea/atmosphere interface.  But that's still heat lost from the overall arctic system, and I imagine it'd be small.

But my imagination is not science, and I'd be curious to know how much extra longwave is getting sent up to space by a warm wet cloud. 
...

I can't quantify this but what is striking is looking at the IR (band31) images on worldview during the winter. The ice surface is recognizable by the (frozen over but warmer) cracks which obviously clouds don't have  ;). Clouds (which move when clicking to the next day or from terra to aqua satellite passes) are colder when they are high or warmer when they are low. And this warmth comes from elsewhere. The ice surface will be warmer under the cloud than under clear sky but this warmth reduces the heat transfer through the ice from the ocean, clouds warm the ice not the other way round.
There is an interaction but it requires external input.

Tealight

  • Frazil ice
  • Posts: 490
    • View Profile
    • CryosphereComputing
  • Liked: 176
  • Likes Given: 17
Re: Quantifying albedo effect / Rating daily area values
« Reply #29 on: May 31, 2016, 10:34:31 PM »
Also FWIW I don't see 2016 reverting to the mean on albedo, because there are positive feedback effects. At least until we get past the peak insolation period.

True, last week wasn't great metling weather and 2016 continued at average losses. On my graphs 2016 stands out more and more.

According to Earth System research labotory clouds always reduce the outgoing longwave radiation. If you open this site next worldview, you can see that low loss areas correlate to cloudy or very cold spots.
http://www.esrl.noaa.gov/psd/map/clim/olr.shtml


JimboOmega

  • Frazil ice
  • Posts: 140
    • View Profile
  • Liked: 2
  • Likes Given: 0
Re: Quantifying albedo effect / Rating daily area values
« Reply #30 on: June 01, 2016, 12:52:49 AM »
According to Earth System research labotory clouds always reduce the outgoing longwave radiation. If you open this site next worldview, you can see that low loss areas correlate to cloudy or very cold spots.
http://www.esrl.noaa.gov/psd/map/clim/olr.shtml

These two statements seem to be at odds with each other - if by "low loss" you mean "low ice loss" and not "low heat loss".

If outgoing radiation is reduced, then less heat is lost to space.  Unless the magnitude of outgoing shortwave radiation also increases (via reflection or whatever). 

Rob Dekker

  • Nilas ice
  • Posts: 2386
    • View Profile
  • Liked: 120
  • Likes Given: 119
Re: Quantifying albedo effect / Rating daily area values
« Reply #31 on: June 01, 2016, 08:19:00 AM »
If outgoing radiation is reduced, then less heat is lost to space.  Unless the magnitude of outgoing shortwave radiation also increases (via reflection or whatever).

Since clouds have a high albedo, yes, they increase reflected shortwave radiation.
Outgoing IR radiation from clouds depends on their altitude : high altitude clouds are cold at the to, low altitude clouds are warm. That affects total NET effect of clouds, as (coarsely) depicted in this image :


That is off course as long as there is incoming shortwave (sunlight) radiation.
So in summer clouds cool (especially low clouds), in winter they warm (especially high clouds).
This is our planet. This is our time.
Let's not waste either.

JimboOmega

  • Frazil ice
  • Posts: 140
    • View Profile
  • Liked: 2
  • Likes Given: 0
Re: Quantifying albedo effect / Rating daily area values
« Reply #32 on: June 01, 2016, 05:28:58 PM »

Since clouds have a high albedo, yes, they increase reflected shortwave radiation.
Outgoing IR radiation from clouds depends on their altitude : high altitude clouds are cold at the to, low altitude clouds are warm. That affects total NET effect of clouds, as (coarsely) depicted in this image :
(...)
That is off course as long as there is incoming shortwave (sunlight) radiation.
So in summer clouds cool (especially low clouds), in winter they warm (especially high clouds).

Makes total sense.  I know the higher the clouds, the colder (I know this more from the context of tropical cyclones). But that temperature doesn't include the reflection of sunlight, only the amount of radiation they emit. 

Still from a balance perspective it makes sense.

Here's a question; is this a negative feedback mechanism?  More heat -> more open water -> more evaporated water -> more clouds (especially low) -> Less heat absorbed?

marcel_g

  • Frazil ice
  • Posts: 127
    • View Profile
    • Art by Marcel Guldemond
  • Liked: 54
  • Likes Given: 425
Re: Quantifying albedo effect / Rating daily area values
« Reply #33 on: June 01, 2016, 05:40:00 PM »
Jimbo, there was a recent paper that went over how estimates for cloud albedo and heat reflection were way off, because of the estimates in % of ice crystals in the clouds. I don't have a reference link handy though. Researchers discovered that previous studies had overestimated the % of ice to water droplets in clouds (globally I believe), so they were significantly overestimating the albedo of cloud cover.

I can't remember if the ice / water ratio in clouds also has an effect on the clouds' heat trapping ability too, but I suspect it does.

Andreas T

  • Nilas ice
  • Posts: 1149
    • View Profile
  • Liked: 18
  • Likes Given: 4
Re: Quantifying albedo effect / Rating daily area values
« Reply #34 on: June 01, 2016, 06:08:33 PM »
This graphic is not right. The way the clouds are drawn, there should be a smaller red arrow pointing down from the high clouds than from the low clouds. The IR radiation down could only be smaller from the bottom of the cloud if the clouds are colder at the bottom than at the top. Which could happen if there is a strong inversion but what would then keep the top of the cloud warm enough to radiate?
The reason the high cloud "traps more heat" is that (in the graphic) the cloud is thin and more shortwave radiation reaches the surface (which in this case is not reflecting it)
To emit as much IR as shown in the graphic the bottom of the high cloud would have to be almost as warm as the surface which is not likely at high altitude.

Tealight is right (and Rob), the ESRL charts show Top Of Atmosphere values (seen by AVHRR sensor on a satellite) so low OLR means cold surface (as the surface which is seen by the satellite). That is ice in Antactica or Greenland  and  (thick) cloud tops in the western pacific which reach high into the atmosphere where the air which is moving them to that height has cooled by expansion.
One problem may be the ambivalence of the word "warming". Here "warming" mostly means reduce cooling compared to clear sky. Only when clouds are warmer than the ground can they actually transfer heat more heat down to it than they receive coming up. That of course reduces the heat content of the cloud for example by depleting its latent heat reservoir by condensing water vapour.
The best way for clouds to reduce heat loss is by being warm at the bottom and cold at the top acting like a thermal blanket. They would have to be very thick to avoid convection overturning that temperature gradient (meteorologists please correct me if I am wrong)

bbr2314

  • Nilas ice
  • Posts: 1817
    • View Profile
  • Liked: 158
  • Likes Given: 53
Re: Quantifying albedo effect / Rating daily area values
« Reply #35 on: June 01, 2016, 07:27:33 PM »
It is pretty crazy that this year's summed anomaly is now larger than any year on record's besides 2012 through the end of the yr!

seaicesailor

  • Guest
Re: Quantifying albedo effect / Rating daily area values
« Reply #36 on: June 01, 2016, 07:34:57 PM »
This is from NASA

Rob Dekker

  • Nilas ice
  • Posts: 2386
    • View Profile
  • Liked: 120
  • Likes Given: 119
Re: Quantifying albedo effect / Rating daily area values
« Reply #37 on: June 02, 2016, 07:39:55 AM »
Thanks seaicesailor. That is a better graph.
Of course, even that picture is not correct (since it looks like these high altitude clouds are warmed up by IR from the surface. So in reality the picture is more complex, since GHG in the atmosphere (mostly CO2 and water vapor) reduces IR intensity on the way up, and increases on the way down.
But the essence of cloud radiation influence is very well captured in the NASA picture.
This is our planet. This is our time.
Let's not waste either.

Rob Dekker

  • Nilas ice
  • Posts: 2386
    • View Profile
  • Liked: 120
  • Likes Given: 119
Re: Quantifying albedo effect / Rating daily area values
« Reply #38 on: June 02, 2016, 07:49:22 AM »
Here's a question; is this a negative feedback mechanism?  More heat -> more open water -> more evaporated water -> more clouds (especially low) -> Less heat absorbed?

If the causality would be like that, then yes, that would be a negative feedback.
However, I am not aware of any scientific paper that has shown this causality.

The papers I've read do not detect any significant change in cloud coverage over the Arctic, despite significant ice variance over long term (multi decadal), and short-term (such as summer 2007 and 2012) time scales.
This is our planet. This is our time.
Let's not waste either.

JimboOmega

  • Frazil ice
  • Posts: 140
    • View Profile
  • Liked: 2
  • Likes Given: 0
Re: Quantifying albedo effect / Rating daily area values
« Reply #39 on: June 02, 2016, 09:10:58 PM »
Here's a question; is this a negative feedback mechanism?  More heat -> more open water -> more evaporated water -> more clouds (especially low) -> Less heat absorbed?

If the causality would be like that, then yes, that would be a negative feedback.
However, I am not aware of any scientific paper that has shown this causality.

The papers I've read do not detect any significant change in cloud coverage over the Arctic, despite significant ice variance over long term (multi decadal), and short-term (such as summer 2007 and 2012) time scales.

Makes sense again.

I'm still trying to figure out what (if any) negative feedback there is given that we've established (if I read this thread correctly) there is significant positive feedback in the form of albedo. I'm especially interested on the whole-season scale.

The only thing I'm aware of is that warmer anything radiates more black body radiation, but that effect is pretty "meh" compared to albedo.  If I didn't mess up the math on Stefan–Boltzmann, OC to 10C means that about 15% more radiation is generated per unit area. But the arctic cannot warm nearly as much as it can melt ice, since it tries to equilibriate, so the temperature gains are likely to be much less - until the ice melts, anyway.

I'm tempted to say there has to be something because we've been relatively stable in this state where the feedback condition (ice) is present, and not ping-ponging between extremes (as you'd expect with a system with positive feedback loops)... but then on geological time scales (10K years), maybe the system does ping pong from ice age to climate optimum in response to relatively small forcing conditions (Milankovitch cycles, etc).

On one end, you have the no-ice summer condition, beyond which heating causes no albedo change.  The other end is more vague, wikipedia has a few ideas, but I think the aridity is the big one. Heat transport efficacy decreases with less and colder open water, which allows what heat remains at lower latitudes to remain there as ice advances. This would only start to matter as ice sheets start to cover continents, I'd think.

*IF* all that is true, and that it is fundamentally a system that experiences positive feedback in the regime we're in, then what matters, really, is the inertia of the system and the power of the effects relative to that inertia.

Which is what this thread is trying to calculate, right?

Rob Dekker

  • Nilas ice
  • Posts: 2386
    • View Profile
  • Liked: 120
  • Likes Given: 119
Re: Quantifying albedo effect / Rating daily area values
« Reply #40 on: June 03, 2016, 06:09:32 AM »
Hi Jimbo,
That latest post brings up a lot of issues, but if I see it correctly, you seem to struggle with these positive and negative feedbacks.
Specifically this :

Quote
I'm tempted to say there has to be something because we've been relatively stable in this state where the feedback condition (ice) is present, and not ping-ponging between extremes (as you'd expect with a system with positive feedback loops)

Not all positive feedbacks create a "ping-pong" between extremes.
Think of a system that has a positive feedback of 0.5.
So if you increase the input by 1, then it feeds back 0.5. Which creates total input increase of 1.5, which feeds back 0.75, which leads to an input increase of 1.75, which feeds back .. etc. Complete the series, and you will see that the output will increase by 2.
So effectively, this positive feedback "amplifies" the input stimuli by a factor of 2.

The albedo effect in the Arctic works the same way : It "amplifies" a temperature increase from lower altitudes latitudes. That's why they call it "Arctic amplification".

Does that make sense ?
« Last Edit: June 03, 2016, 06:23:06 AM by Rob Dekker »
This is our planet. This is our time.
Let's not waste either.

JimboOmega

  • Frazil ice
  • Posts: 140
    • View Profile
  • Liked: 2
  • Likes Given: 0
Re: Quantifying albedo effect / Rating daily area values
« Reply #41 on: June 03, 2016, 07:14:27 PM »
Hi Jimbo,
That latest post brings up a lot of issues, but if I see it correctly, you seem to struggle with these positive and negative feedbacks.
Specifically this :

Quote
I'm tempted to say there has to be something because we've been relatively stable in this state where the feedback condition (ice) is present, and not ping-ponging between extremes (as you'd expect with a system with positive feedback loops)

Not all positive feedbacks create a "ping-pong" between extremes.
Think of a system that has a positive feedback of 0.5.
So if you increase the input by 1, then it feeds back 0.5. Which creates total input increase of 1.5, which feeds back 0.75, which leads to an input increase of 1.75, which feeds back .. etc. Complete the series, and you will see that the output will increase by 2.
So effectively, this positive feedback "amplifies" the input stimuli by a factor of 2.

The albedo effect in the Arctic works the same way : It "amplifies" a temperature increase from lower altitudes latitudes. That's why they call it "Arctic amplification".

Does that make sense ?

True, if that is the coefficient. It'd be interesting to know what it actually is.  As you know, I'm always interested in season-to-season retained heat.

Incidentally yes, I should know better, since I spend a lot of my workday trying to push a (very non-geophysical) system into the positive feedback > 1 state.
« Last Edit: June 03, 2016, 08:38:56 PM by JimboOmega »

Tealight

  • Frazil ice
  • Posts: 490
    • View Profile
    • CryosphereComputing
  • Liked: 176
  • Likes Given: 17
Re: Quantifying albedo effect / Rating daily area values
« Reply #42 on: June 04, 2016, 03:17:50 PM »
I made the first step towards a prediction model by modeling past years. It probably derserves another thread to be discussed in detail, since it is only based on my albedo calculations and serves another purpose.

The model works great for average years, but needs some kind of extra predictor for the amount of heat transported from land to the ice. If the start day is set to mid July and not March, the errors are much smaller. Most coastal ice has melted by then and any heat from land goes primarily into increasing the water temperature of ice free areas.

The best results so far are with the following formula:
Daily area loss = {[(extent - area)*daily kWh*0.75+(snowfree area below 15 million km2)*(daily kWh - outgoing kWh)]/(heat of fusion)}/ (daily average thickness)

Edit: previously in the formula was a factor 0.000001, which just compensated an error made in the calculation of snow free area.

in units: [kWh]/(kWh/1000km3)/(m) = million km2

To make an actual prediction model, the ice thickness needs to be calculated by a daily volume change and not historic data. Likewise the 'extent to area' ratio needs an ensemble forcast instead of historical data.

Attached are the years 2008 and 2011 which divergerd most, one above and the other below the prediction line. 2015 was an average year and fits the prediction curve very good.
« Last Edit: June 05, 2016, 08:21:29 PM by Tealight »

Rob Dekker

  • Nilas ice
  • Posts: 2386
    • View Profile
  • Liked: 120
  • Likes Given: 119
Re: Quantifying albedo effect / Rating daily area values
« Reply #43 on: June 05, 2016, 05:19:36 AM »
Tealight, that looks very promising.
Great work !

The best results so far are with the following formula:
Daily area loss = {[(extent - area)*daily kWh*0.75+(snowfree area below 15 million km2)*(daily kWh - outgoing kWh)*0.000001]/(heat of fusion)}/ (daily average thickness)

Question : what is that "outgoing kWh" variable and how did you determine it ?
Also, which period did you analyze to determine "the best results so far" ?

Quote
To make an actual prediction model, the ice thickness needs to be calculated by a daily volume change and not historic data.

I did not find any significant change in fit by just assuming that thickness does not change. After all, most of the ice that will melt out in any given melting season is FYI, which does not change much over the years.
But I like your idea of looking at volume losses.

Quote
Attached are the years 2008 and 2011 which divergerd most, one above and the other below the prediction line. 2015 was an average year and fits the prediction curve very good.

Nice ! It is surprising how accurate some of these fits are.
As for 2011 and 2008, in my formulas I did not find them to be exceptional.
I wonder where the difference comes from, since we are using the same variables...

[edit] I'm confused about your 0.000001 factor for snow cover compared to 0.75 for extent-area.
In my experience the snow cover factor should be about 1/4 of the extent-area factor.
Or am I misinterpreting the units on each variable ?
« Last Edit: June 05, 2016, 05:34:57 AM by Rob Dekker »
This is our planet. This is our time.
Let's not waste either.

Tealight

  • Frazil ice
  • Posts: 490
    • View Profile
    • CryosphereComputing
  • Liked: 176
  • Likes Given: 17
Re: Quantifying albedo effect / Rating daily area values
« Reply #44 on: June 05, 2016, 06:54:05 PM »
First of all I have to tidy up my excel sheets and create a block diagram like in my previous albedo calculations to get a grip of everything together. At the moment its a huge mess with real data tables, calculated tables and modifiers all over the place. I don't think anyone else could follow the calculations from start to finish without a navigation system.

Edit: I created this thread in the Developers Corner where we can discuss the model in more Detail and improve it.

http://forum.arctic-sea-ice.net/index.php/topic,1575.0.html#new
« Last Edit: June 05, 2016, 08:14:32 PM by Tealight »

Tealight

  • Frazil ice
  • Posts: 490
    • View Profile
    • CryosphereComputing
  • Liked: 176
  • Likes Given: 17
Re: Quantifying albedo effect / Rating daily area values
« Reply #45 on: June 20, 2016, 07:41:04 PM »
This and the following post show the albedo for different ice types. Measurements are taken from a Sentinel 2A image, since MODIS resolution is too low to show the large variety of sea ice types during the melting season.

While the results aren’t ground-breaking I think no one else did measurements on so many ice types with example images for different wavelengths. Maybe it’s time to start a catalogue.

All values should be seen as albedo relative to the darkest and brightest features in the image. Deep ocean water has an absolute albedo is 0.05 or lower so very close to true zero albedo. Snow has an absolute albedo of 0.85-0.9, quite a bit lower than true 1. So values above 0.9 for snow mean the true albedo is close to 0.9.

S2A Image details
13th June Beaufort Sea, 3-4 degrees C air temperature
Military grid tile: 8>W>NE
around: 71.5N, 133W

The first attachment shows all used S2A bands on top of the solar spectrum. All red shaded areas indicate radiation at sea level.
The second attachment shows ice types and their respective albedo.

S2A band order
Band 2 > Blue
Band 3 > Green
Band 4 > Red
Band 8 > Near Infrared

Tealight

  • Frazil ice
  • Posts: 490
    • View Profile
    • CryosphereComputing
  • Liked: 176
  • Likes Given: 17
Re: Quantifying albedo effect / Rating daily area values
« Reply #46 on: June 20, 2016, 07:43:31 PM »
The next images show a wider view of all types and their occurance.

In the first attachment is a closeup of a crack/splitting ice flow. The ice doesn't breakup clean like a cut with a knife, but is rather torn apart leaving thinner ice behind.

The second attachment shows lots of grey, almost black ice, but it doesn't seem as thin as the break up ice. I don't know how it is formed. Interestingly its reflectivity for infrared wavelengths doesn't drop as much as for other ice types. It stays grey over the entire spectrum.

The third attachment shows a melt pond area. The melt ponds aren't continuous so the overall albedo isn't as low as for the smooth grey ice.

Click to open with full resolution
« Last Edit: June 20, 2016, 07:59:05 PM by Tealight »

epiphyte

  • Frazil ice
  • Posts: 387
    • View Profile
  • Liked: 22
  • Likes Given: 21
Re: Quantifying albedo effect / Rating daily area values
« Reply #47 on: June 20, 2016, 09:29:21 PM »
@tealight - Most informative... Thanks for taking the trouble. One question - does (1 - the overall albedo number for each surface type) map directly to the proportion of solar energy absorbed (given no clouds) or does that need to be summed across the spectrum?

Andreas T

  • Nilas ice
  • Posts: 1149
    • View Profile
  • Liked: 18
  • Likes Given: 4
Re: Quantifying albedo effect / Rating daily area values
« Reply #48 on: June 21, 2016, 08:34:20 AM »
I can't quickly find the source now but there are extensive measurements of reflections on sea surfaces and on ice at different angles. The old image from Obuoy3 shows how the water which reflects almost no light straight up to the satellite reflects some light at the incident angle, so does the ice surface, but the snow scatters roughly equally in all directions so that in that case what the satellite sees is representative of the outgoing shortwave radiation, in the case of water and ice it isn't. For your purposes you could probably factor that in with a fixed percentage, although I think radiative balance models take sun angle and surface roughness (waves) into account.

timallard

  • Frazil ice
  • Posts: 142
  • designer
    • View Profile
  • Liked: 2
  • Likes Given: 0
Re: Quantifying albedo effect / Rating daily area values
« Reply #49 on: June 21, 2016, 10:50:06 AM »
Sent an email to NSIDC requesting info on albedo and they sent a nice paper with a wide variety, more than posted above, sharing; 16-page pdf: JOURNAL OF GEOPHYSICAL RESEARCH, VOL. 109, C08007, doi:10.1029/2003JC001989, 2004, "Hydraulic controls of summer Arctic pack ice albedo", H. Eicken et al.
-tom