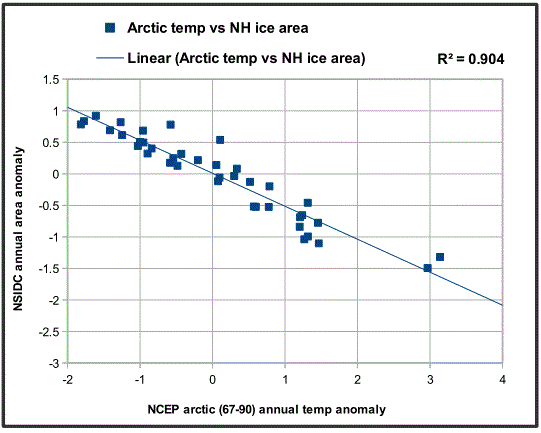
Here's a chart I made. I like it when R^2 is above .90... don't like the implications for ice melting.
It's the annual average of temperatures north of the Arctic circle, compared to the annual average sea ice. Temps from NCEP reanalysis, ice area from NSIDC. Both temps and ice area are shown as their anomalies from the 1979 to 2016 average.
2017 has only two months data, it is the last point to the far lower right, slightly above the trend line.
To get ice free summers... considering that summers have been declining faster than winter... I'm going to guess about 3-4 more degreesC of Arctic warming will give us ice free Aug, Sept and Oct.
With Arctic amplification running about 6 times the global average (using the same NCEP reanalysis data), we need only about 0.5 to 0.7C more globally averaged warming to get us there. Maybe 20 years at the current accelerating rate.
The first ice free minimum would happen much earlier... and that's important as a warning signal... but I see albedo feedback as the real killer here. The regular appearance of blue Arctic Ocean in August when the sun is still shining 24 hours per day... that's going to be awful to see.
