Thanks guys, for your response to the 'optimistic' projection of my statistical model.
Response to your comments below:
Rob
A 5.41m km2 September minimum implies an average decline of <50k/day between now and mid-September. We have not seen losses that would support an average of that low a magnitude as yet.
2010 comes pretty close : In June it had ice 'area' 8.30 (which is considerably lower than the 2017 June 'area' of 8.51) yet it resulted in 4.93 extent in September.
You are right that it is a pretty unprecedented projection, but then again, the 3.5 million km^2 land snow anomaly that Rutgers posted for June is also unprecedented over the past decade or two.
Sterks said :
I was expecting the model had yielded a reduced prediction this month, but it is what it is.
That's how I look at it : "it is what it is", and let's not forget it is a model. And all models are wrong, but some are useful. If my model is useful will be decided at the end of September 2017.
Your model has proven to get the right value and/or tendency of the melting season in most if not all years since you have used it (including rebound years as 2013). Correct me if I am wrong.
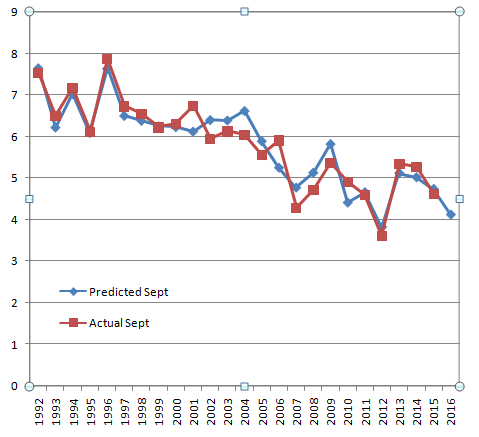
It is correct that my current model quite nicely reproduces the 2013 and 2014 'rebound' years in 'hindcast' mode :
However, if we only use data available until 2012 (forecast mode), the optimal formula changes a bit and the rebound of 2013 and 2014 is still reproduced, but not that accurately. Let me run the numbers and show you later.
I only have a "but" with June snow cover: in many of the satellital images, the snow cover over land has been showing a "grey" appearance during June, in other words, that it is only a partial or a thin cover with many spots (trees, tundra vegetation, valleys void of ice) showing a much lowered albedo, as opposed to the absolutely white covers during much of May.
Very good point.
I would love to get my hands on the land snow 'area' numbers (not just 'extent') and then preferably daily, and even better : gridded. And of course with the full history (20-30 years or so).
I have a feeling that I can come up with an even better correlation between land snow cover and September ice extent if I had that kind of data available.
Unfortunately, Rutgers Snow Lab produces only the monthly land snow 'extent' numbers, and I have not been able to find their source feed.
In Dutch we have a saying : "Je moet roeien met de riemen die je hebt", freely translated to : You need to work with what you have available.
And I'm already impressed with the nice correlation that Rutgers Snow Lab produces for June with the September SIE numbers.
Furthermore, may I ask what your model would yield should the snow cover be essentially the same as 2016? Just a curious experiment.
Sure. In my formula, every 1 million km^2 of land snow cover in June correlates to about 160 k km^2 of SIE in September. So if the June land snow cover this year would be the same as last year, the prediction would be some 3.5 * 0.16 = 0.56 lower, which means the projection would be 4.85 or so. That is mostly because ice 'area' in June this year was pretty high.
I've also played with reducing the influence of snow cover in the regression formula. That gains a lower number too (but it's hard to get it to go below 4.9) and the standard deviation of the residuals increases. That suggests it's really not a good idea, and I should just stick with the model, and as you said : "it is what it is".


