Support the Arctic Sea Ice Forum and Blog

Author Topic: 2018 sea ice area and extent data  (Read 849696 times)

Juan C. García

  • Young ice
  • Posts: 3359
    • View Profile
  • Liked: 1279
  • Likes Given: 1127
Re: 2018 sea ice area and extent data
« Reply #1900 on: October 13, 2018, 05:41:11 AM »
[ADS-NIPR-JAXA] ASI Extent.

October 12th:
   2018: 5,259,824 km2, an increase of 77,628 km2
   2010's Avg.: 5,879,597 km2, an increase of 99,913 km2

2018 is the 3rd lowest on record.

PS: I will be travelling for 3 days, so it is possible that I will not make the posts until Tuesday.
Which is the best answer to Sep-2012 ASI lost (compared to 1979-2000)?
50% [NSIDC Extent] or
73% [PIOMAS Volume]

Volume is harder to measure than extent, but 3-dimensional space is real, 2D's hide ~50% thickness gone.
-> IPCC/NSIDC trends [based on extent] underestimate the real speed of ASI lost.

Pmt111500

  • Guest
Re: 2018 sea ice area and extent data
« Reply #1901 on: October 13, 2018, 08:32:00 AM »
Definitely looks like Arctic is generating ice. The two last days have had so much increase it can't be ice dropping from Greenland or dismantling in Fram.

gerontocrat

  • Multi-year ice
  • Posts: 20635
    • View Profile
  • Liked: 5308
  • Likes Given: 69
Re: 2018 sea ice area and extent data
« Reply #1902 on: October 13, 2018, 10:34:25 AM »
JAXA ARCTIC EXTENT 5,259,824 km2(October 12, 2018)

- Extent increase a lower than average 137k 78k km2, (Whoops again)
- Extent is 697 k  (11.7 %) below the 2010's average extent on this date,
- Extent is 848 k (13.9 %) below 2017 on this date.
- freezing to date from minimum is 848k (51.4%) less than the 10 year average extent gain,
- on average 16.6% (1/6th) bof the increase in extent is done.

An extra line in the table based on average extent increase in the last 5 years has been added. This is because extent gain in 2012-13 was so large (rebound from record low minimum) that it distorts the average. The outcome from using the 10 year average extent gain from now is a maximum of 13.48 million km2 (400k < 2017). Using the previous 5 years's average extent gain, the resulting maximum is 13.12 million km2, some 760,000 km2 less than the 2017 record low maximum of 13.88 million km2. 

From the GFS maps it looks like North of 80 will go through a cold patch  to Sunday, but return to strong +ve temp anomalies by Monday. Is this the cold needed to kick-start strong freezing? On the other hand GFs maps also indicate that overall the Arctic is going to stay at above average temperatures, the +ve anomaly at a maximum of around 5 degrees celsius on Sunday and around +4.5 celsius after that.

Perhaps extent gain will rebound. But maybe the delay in freezing will also reduce thickening of the ice. There is a still a good chance that in a week or so 2018 extent will be at a record low, which is a surprise (at least to me).

ps: The opposite is happening in the Antarctic - melting has barely started, very, very slowly underway.
[/quote]
« Last Edit: October 13, 2018, 12:53:17 PM by gerontocrat »
"Para a Causa do Povo a Luta Continua!"
"And that's all I'm going to say about that". Forrest Gump
"Damn, I wanted to see what happened next" (Epitaph)

be cause

  • Nilas ice
  • Posts: 2449
    • View Profile
  • Liked: 1017
  • Likes Given: 1048
Re: 2018 sea ice area and extent data
« Reply #1903 on: October 13, 2018, 12:38:13 PM »
Hi Gerontocrat,
Jaxa extent has an interesting few days ahead .. by the 20th it is as likely to be 5th as 1st ..
extraordinary times .. thank goodness we still have you providing facts ..most of our main informative posters seem to have abandoned the ASI ship . Appreciate the seperate sea info .. your graphs speak volumes ..
ps .. 137000 again today ?

b.c.
There is no death , the Son of God is We .

gerontocrat

  • Multi-year ice
  • Posts: 20635
    • View Profile
  • Liked: 5308
  • Likes Given: 69
Re: 2018 sea ice area and extent data
« Reply #1904 on: October 13, 2018, 12:55:54 PM »

ps .. 137000 again today ?

b.c.
Another whoops - corrected.
"Para a Causa do Povo a Luta Continua!"
"And that's all I'm going to say about that". Forrest Gump
"Damn, I wanted to see what happened next" (Epitaph)

gerontocrat

  • Multi-year ice
  • Posts: 20635
    • View Profile
  • Liked: 5308
  • Likes Given: 69
Re: 2018 sea ice area and extent data
« Reply #1905 on: October 13, 2018, 03:07:06 PM »
NSIDC Total Area as at 12 October (5 day trailing average) =  3,718,365 km2

Total Area gain on this day 60 k, 32k below average area gain, area now 727 k less than 2017 (was 325 k on 5th October).

Peripheral Seas gain       19 k, of which 15 k in the Greenland Sea
Central Seas     gain       43 k,                                 
Other Seas       loss         1 k, (Okhotsk)
CAB Seas
Beaufort Sea                 gain    9 k
Canadian Archipelago    gain     8 k
East Siberian Sea (ESS) gain    15 k ,
Central Arctic Sea           gain    5 k,

Arctic temperature anomaly staying at around 4 celsius until.....? But as darkness descends temperatures drop like a stone. Freezing taking hold, but may very well continue to be below average. Attention switches to the pace of that freezing and where it is happening. On this day gain in the CAB seas and the Greenland Sea.
« Last Edit: October 13, 2018, 04:32:30 PM by gerontocrat »
"Para a Causa do Povo a Luta Continua!"
"And that's all I'm going to say about that". Forrest Gump
"Damn, I wanted to see what happened next" (Epitaph)

FishOutofWater

  • Nilas ice
  • Posts: 1088
    • View Profile
  • Liked: 696
  • Likes Given: 333
Re: 2018 sea ice area and extent data
« Reply #1906 on: October 13, 2018, 05:11:18 PM »
As expected sea ice extent is rapidly returning to the normal of the past few years. The fresh water layer that forms from rivers flowing into the Arctic has had weeks of cooling and it is beginning to freeze up. The arm of sea ice that held out through the summer north of the ESS is rapidly gaining area. This ice arm is a near surface pathway for poleward fresh water flow. The freeze up pattern we are seeing now is what we should have expected.

bbr2314

  • Nilas ice
  • Posts: 1817
    • View Profile
  • Liked: 158
  • Likes Given: 53
Re: 2018 sea ice area and extent data
« Reply #1907 on: October 13, 2018, 05:23:13 PM »
As expected sea ice extent is rapidly returning to the normal of the past few years. The fresh water layer that forms from rivers flowing into the Arctic has had weeks of cooling and it is beginning to freeze up. The arm of sea ice that held out through the summer north of the ESS is rapidly gaining area. This ice arm is a near surface pathway for poleward fresh water flow. The freeze up pattern we are seeing now is what we should have expected.
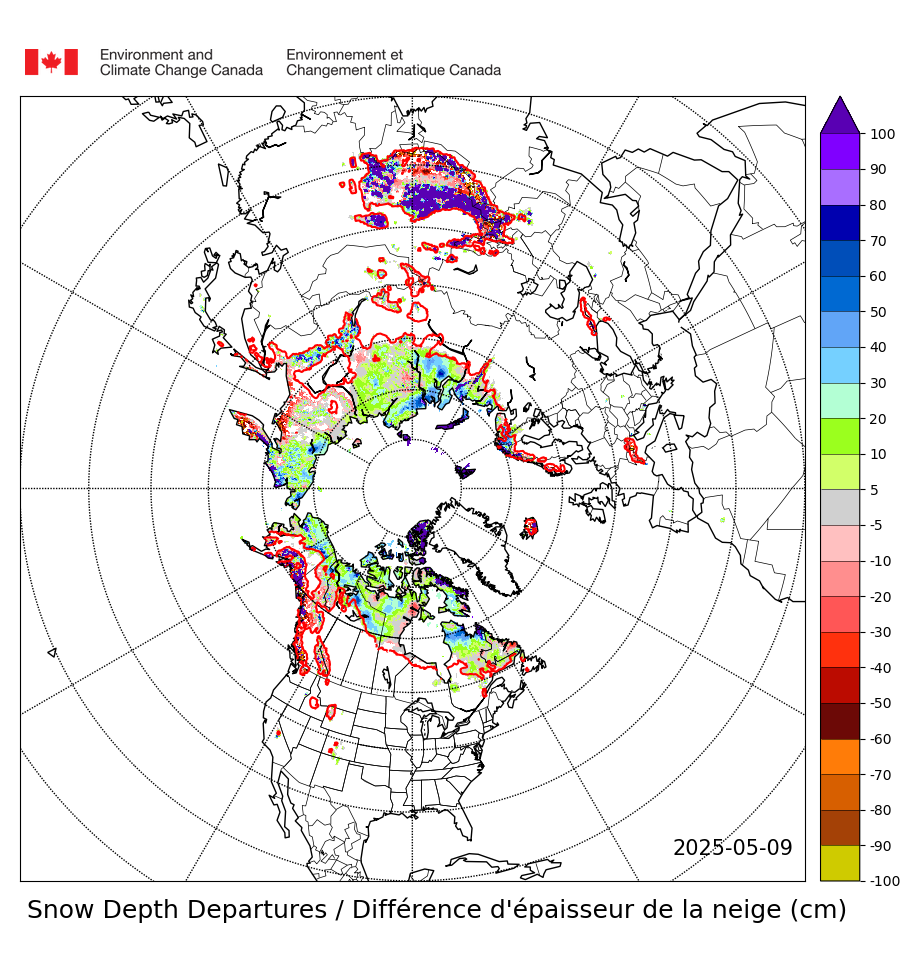
The large area of +SSTs north of Siberia has also led to the major polar vortex being stuck in Greenland / CAA / North America, with the only snows over Asia contained to the Himalayas / Tibetan Plateau and Northeast Siberia. This has partially been responsible for the worsening +500MB anomalies over much of western Russia (no snow = low albedo, + adjacent warm SSTs nearby = WAY warmer vs. normal snow-covered values).

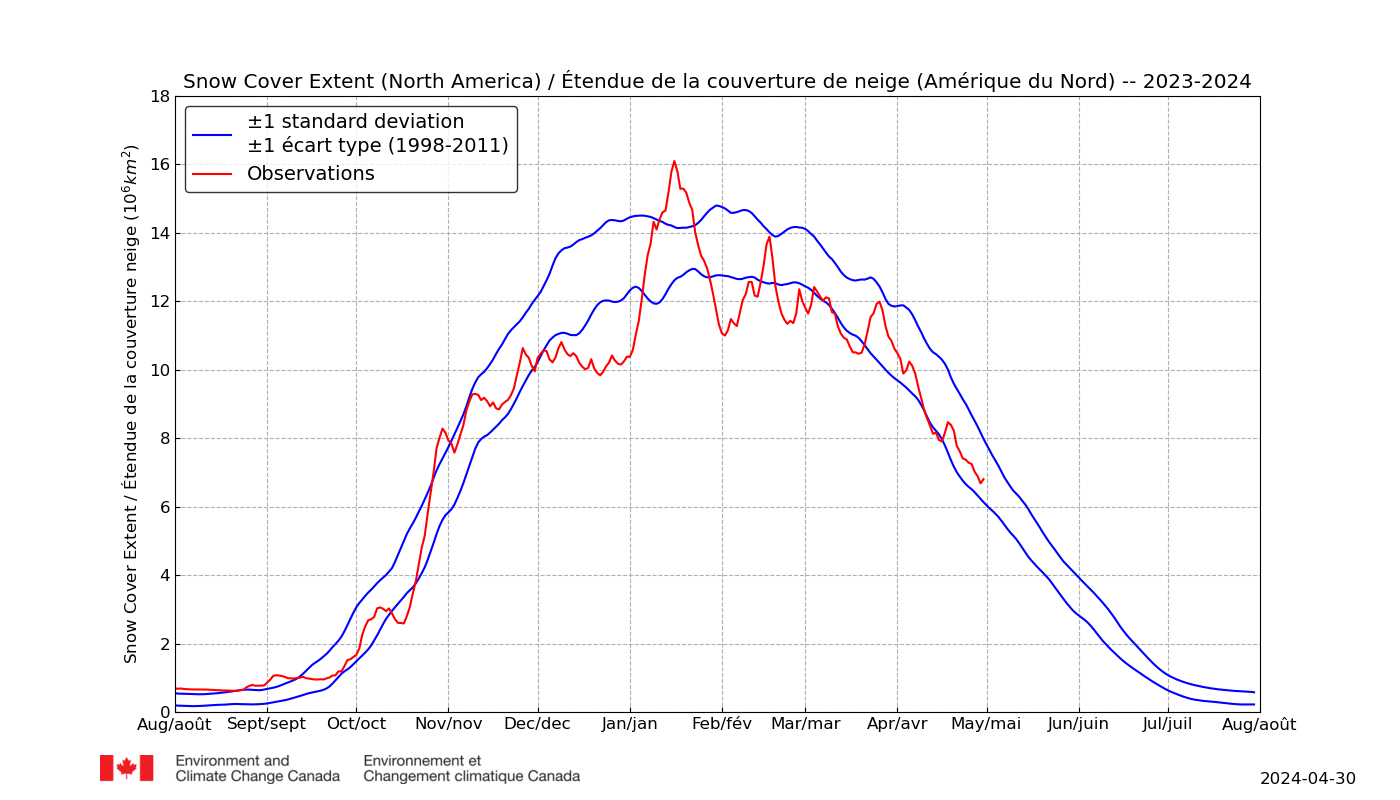
North America's extent is now above Eurasia's, and is quite likely to set an all-time October record. 6M KM^2 of continental extent on 10/12 does way more in terms of deflecting insolation than 5M KM^2 of sea ice wayyyy up north btw. I think this helps illustrates how, when oceanic heat accumulates to significant enough quantities AND large ice sheets remain extent, continental heat sinks become much more effective at resolving the planetary heat budget vs. oceanic ice caps.

While the see-saw of winter may temporarily be heavily favoring North America, I think Siberia will soon respond to all the open ocean with massive snowfall as well, so +500MB anoms are imminently likely to become much more focused over the Arctic proper vs. the distribution we have seen so far this October.

Final note: the least but perhaps most potent impact of the lack of snow in Western Siberia this autumn has been way less melt / way warmer temps / *no* coastal refreeze! Refreeze was well underway at all other points in history. The delayed coastal refreeze in Siberia and FRAM transport of the remaining sea ice could result in a springtime Laptev situation that mirrors what unfolded this year in Bering (which will also repeat the same in 2019). The refreeze season this year in Laptev will, IMO, be curtailed worse than any prior year.


...and PPS: I also just realized this may be the first point in autumnal history that North American snowcover has equaled / surpassed Eurasian. The difference to date this fall has been very dramatic.

The discrepancy can only get so bad as North America's smaller landmass means it runs out of area to cover quicker, however, with SWE building so early over such a wide area, 2018-2019 looks to be gunning for springtime North America volume numbers that are perhaps substantially even more impressive than 2017-2018 (which saw nothing like what has unfolded in Sept / Oct 2018 in the lead-up to record Mar / Apr / May #s).


« Last Edit: October 13, 2018, 05:29:04 PM by bbr2314 »

magnamentis

  • Guest
Re: 2018 sea ice area and extent data
« Reply #1908 on: October 13, 2018, 10:21:25 PM »
Sea stores heat for a month or two.

This refreeze season I think will be slow to get going but will probably end up close to min max next year.

It seems that the minimum and maximum dates are now only 2 eventful days in 365 eventful days

i think that the sea stores heat for centuries and not a few months.

oren

  • Moderator
  • First-year ice
  • Posts: 9819
    • View Profile
  • Liked: 3589
  • Likes Given: 3943
Re: 2018 sea ice area and extent data
« Reply #1909 on: October 13, 2018, 11:21:46 PM »
Sea stores heat for a month or two.

This refreeze season I think will be slow to get going but will probably end up close to min max next year.

It seems that the minimum and maximum dates are now only 2 eventful days in 365 eventful days

i think that the sea stores heat for centuries and not a few months.
Normally true, but under winter conditions the top mixed layer of the arctic ocean will eventually lose (most of) its heat. The deep unmixed layer below, where there is enough depth, may well keep its heat for many years.
The arctic ocean is very different from a normal ocean.

gerontocrat

  • Multi-year ice
  • Posts: 20635
    • View Profile
  • Liked: 5308
  • Likes Given: 69
Re: 2018 sea ice area and extent data
« Reply #1910 on: October 13, 2018, 11:40:04 PM »
Sea stores heat for a month or two.

This refreeze season I think will be slow to get going but will probably end up close to min max next year.

i think that the sea stores heat for centuries and not a few months.
Normally true, but under winter conditions the top mixed layer of the arctic ocean will eventually lose (most of) its heat. The deep unmixed layer below, where there is enough depth, may well keep its heat for many years.
The arctic ocean is very different from a normal ocean.
That assumes the stratification which traps the deep unmixed layer is not compromised. But we don't know if there are changes afoot - e.g. recent paper that caused a bit of a storm -

Quote
Warming of the interior Arctic Ocean linked to sea ice
losses at the basin margins
Mary-Louise Timmermans, John Toole, Richard Krishfield

Arctic Ocean measurements reveal a near doubling of ocean heat content relative to the freezing temperature in the Beaufort Gyre halocline over the past three decades (1987–2017). This warming is linked to anomalous solar heating of surface waters in the northern Chukchi Sea, a main entryway for halocline waters to join the interior Beaufort Gyre. Summer solar heat absorption by the surface waters has increased fivefold over the same time period, chiefly because of reduced sea ice coverage. It is shown that the solar heating, considered together with subduction rates of surface water in this region, is sufficient to account for the observed halocline
warming. Heat absorption at the basin margins and its subsequent accumulation in the ocean interior, therefore, have consequences for Beaufort Gyre sea ice beyond the summer season.
"Para a Causa do Povo a Luta Continua!"
"And that's all I'm going to say about that". Forrest Gump
"Damn, I wanted to see what happened next" (Epitaph)

magnamentis

  • Guest
Re: 2018 sea ice area and extent data
« Reply #1911 on: October 14, 2018, 03:25:11 AM »
Sea stores heat for a month or two.

This refreeze season I think will be slow to get going but will probably end up close to min max next year.

It seems that the minimum and maximum dates are now only 2 eventful days in 365 eventful days

i think that the sea stores heat for centuries and not a few months.
Normally true, but under winter conditions the top mixed layer of the arctic ocean will eventually lose (most of) its heat. The deep unmixed layer below, where there is enough depth, may well keep its heat for many years.
The arctic ocean is very different from a normal ocean.

true and i'm aware of that , it was the term "the seas" that caught my eyes, IMO we should be as precise as possible, something along the line you just explained. flapsy statements won't take us far because there is too much room for denial.

in short, the way you put it is how things are.

magnamentis

  • Guest
Re: 2018 sea ice area and extent data
« Reply #1912 on: October 14, 2018, 03:27:55 AM »
Sea stores heat for a month or two.

This refreeze season I think will be slow to get going but will probably end up close to min max next year.

i think that the sea stores heat for centuries and not a few months.
Normally true, but under winter conditions the top mixed layer of the arctic ocean will eventually lose (most of) its heat. The deep unmixed layer below, where there is enough depth, may well keep its heat for many years.
The arctic ocean is very different from a normal ocean.
That assumes the stratification which traps the deep unmixed layer is not compromised. But we don't know if there are changes afoot - e.g. recent paper that caused a bit of a storm -

Quote
Warming of the interior Arctic Ocean linked to sea ice
losses at the basin margins
Mary-Louise Timmermans, John Toole, Richard Krishfield

Arctic Ocean measurements reveal a near doubling of ocean heat content relative to the freezing temperature in the Beaufort Gyre halocline over the past three decades (1987–2017). This warming is linked to anomalous solar heating of surface waters in the northern Chukchi Sea, a main entryway for halocline waters to join the interior Beaufort Gyre. Summer solar heat absorption by the surface waters has increased fivefold over the same time period, chiefly because of reduced sea ice coverage. It is shown that the solar heating, considered together with subduction rates of surface water in this region, is sufficient to account for the observed halocline
warming. Heat absorption at the basin margins and its subsequent accumulation in the ocean interior, therefore, have consequences for Beaufort Gyre sea ice beyond the summer season.

also correct which is why i like to say "something along that line" because there are so many unknowns that an absolute statement is not possible while generally it is true what oren says with a few more things to say that would make a post a book or an entire library without significant enlightenment.

however, of course you have a point ;)

Juan C. García

  • Young ice
  • Posts: 3359
    • View Profile
  • Liked: 1279
  • Likes Given: 1127
Re: 2018 sea ice area and extent data
« Reply #1913 on: October 14, 2018, 05:45:10 AM »
[ADS-NIPR-JAXA] ASI Extent.

October 13th:
   2018: 5,360,941 km2, an increase of 101,117 km2
   2010's Avg.: 5,979,729 km2, an increase of 100,133 km2

2018 is the 3rd lowest on record.
Which is the best answer to Sep-2012 ASI lost (compared to 1979-2000)?
50% [NSIDC Extent] or
73% [PIOMAS Volume]

Volume is harder to measure than extent, but 3-dimensional space is real, 2D's hide ~50% thickness gone.
-> IPCC/NSIDC trends [based on extent] underestimate the real speed of ASI lost.

gerontocrat

  • Multi-year ice
  • Posts: 20635
    • View Profile
  • Liked: 5308
  • Likes Given: 69
Re: 2018 sea ice area and extent data
« Reply #1914 on: October 14, 2018, 10:01:43 AM »
JAXA ARCTIC EXTENT 5,360,941 km2(October 13, 2018)

- Extent increase an average 101k km2,
- Extent is 696 k  (11.5 %) below the 2010's average extent on this date,
- Extent is 853 k (13.7 %) below 2017 on this date.
- freezing to date from minimum is 851k (48.5%) less than the 10 year average extent gain,
- on average 17.6% (>1/6th) of the increase in extent is done.

An extra line in the table based on average extent increase in the last 5 years has been added. This is because extent gain in 2012-13 was so large (rebound from record low minimum) that it distorts the average. The outcome from using the 10 year average extent gain from now is a maximum of 13.48 million km2 (400k < 2017). Using the previous 5 years's average extent gain, the resulting maximum is 13.12 million km2, some 760,000 km2 less than the 2017 record low maximum of 13.88 million km2. 

From the GFS maps it looks like North of 80 will stay a cold patch on Sunday (today), but return to strong +ve temp anomalies by Monday. GFs maps also indicate that overall the Arctic is going to stay at above average temperatures, the +ve anomaly at a maximum of around 5 degrees celsius today and around +4 to +4.5 celsius after that. But even with this high anomaly, temperatures over most of the Arctic will be well below the freezing point of sea ice of circa -1.8 degrees celsius.
"Para a Causa do Povo a Luta Continua!"
"And that's all I'm going to say about that". Forrest Gump
"Damn, I wanted to see what happened next" (Epitaph)

Stephan

  • Young ice
  • Posts: 2669
    • View Profile
  • Liked: 759
  • Likes Given: 459
Re: 2018 sea ice area and extent data
« Reply #1915 on: October 14, 2018, 11:36:12 AM »
May I make a proposal for us all:
Many people here follow ASI extent, area and volume (monthly and daily), some of us even "sea wise" and use NSIDC, JAXA, PIOMAS or other sources to feed their personal excel sheets for further calculations and extrapolations.
Wouldn't it be good to share a common and open data basis where some of us add the necessary information on a daily basis that is open for everyone. This would avoid multiple individual data acquisition and processing.
What do you think about this proposal?
It is too late just to be concerned about Climate Change

Archimid

  • Young ice
  • Posts: 3511
    • View Profile
  • Liked: 899
  • Likes Given: 206
Re: 2018 sea ice area and extent data
« Reply #1916 on: October 14, 2018, 12:39:43 PM »
I love the idea. Maybe a set of editable google spreadsheets might work for that purpose.
I am an energy reservoir seemingly intent on lowering entropy for self preservation.

gerontocrat

  • Multi-year ice
  • Posts: 20635
    • View Profile
  • Liked: 5308
  • Likes Given: 69
Re: 2018 sea ice area and extent data
« Reply #1917 on: October 14, 2018, 01:21:43 PM »
I love the idea. Maybe a set of editable google spreadsheets might work for that purpose.
Google spreadsheets have limitations. I tried it once on one of my smaller spreadsheets - it did not know all the formula so came up with garbage. Also, I believe, very restricted on number of rows and columns (and sheets?).

ps: My personal collection of data is, like Topsy, growing and growing. Managing it is now taking up quite some time. This Forum would need a full-time database administrator to look after what would be a vast collection of inter-connected data - which, it is true, does not yet exist.

pps: I am not volunteering for the rôle.
« Last Edit: October 14, 2018, 01:29:46 PM by gerontocrat »
"Para a Causa do Povo a Luta Continua!"
"And that's all I'm going to say about that". Forrest Gump
"Damn, I wanted to see what happened next" (Epitaph)

Archimid

  • Young ice
  • Posts: 3511
    • View Profile
  • Liked: 899
  • Likes Given: 206
Re: 2018 sea ice area and extent data
« Reply #1918 on: October 14, 2018, 01:47:29 PM »
Yeah, I've dabbled with google sheets and find them wonky and not as powerful as excel, but their sharing features seem excellent.

Just as a test I've created a new account, and uploaded the excel sheets I'm currently working on. I set it to share with anyone with the link.

https://docs.google.com/spreadsheets/d/1T46iX6HYG3j1umPZFlxRrjDudGmfccg3cHparR7OOgw/edit?usp=sharing

Maybe something like this can be useful?
I am an energy reservoir seemingly intent on lowering entropy for self preservation.

gerontocrat

  • Multi-year ice
  • Posts: 20635
    • View Profile
  • Liked: 5308
  • Likes Given: 69
Re: 2018 sea ice area and extent data
« Reply #1919 on: October 14, 2018, 02:44:18 PM »
NSIDC Total Area as at 13 October (5 day trailing average) =  3,801,247 km2

Total Area gain on this day 83 k, 14k less than the 2010's average, area now 740 k less than 2017.

Peripheral Seas gain        3 k,
Central Seas     gain       81 k,                                 
Other Seas       loss         0.7 k, (Okhotsk)
CAB Seas
Beaufort Sea                 gain    17 k
Canadian Archipelago    gain     18 k
East Siberian Sea (ESS) gain    18 k ,
Central Arctic Sea           gain    18 k,

Arctic temperature anomaly staying at around 4 celsius until.....? But as darkness descends temperatures drop like a stone. See attached image. Freezing taking hold, but may very well continue to be below average. Attention switches to the pace of that freezing and where it is happening. On this day strong gain in the CAB seas while the Greenland Sea gain down from 15k to 1k (warm weather coming in?).
[/quote]
"Para a Causa do Povo a Luta Continua!"
"And that's all I'm going to say about that". Forrest Gump
"Damn, I wanted to see what happened next" (Epitaph)

Stephan

  • Young ice
  • Posts: 2669
    • View Profile
  • Liked: 759
  • Likes Given: 459
Re: 2018 sea ice area and extent data
« Reply #1920 on: October 14, 2018, 09:51:50 PM »
Yeah, I've dabbled with google sheets and find them wonky and not as powerful as excel, but their sharing features seem excellent.

Just as a test I've created a new account, and uploaded the excel sheets I'm currently working on. I set it to share with anyone with the link.

https://docs.google.com/spreadsheets/d/1T46iX6HYG3j1umPZFlxRrjDudGmfccg3cHparR7OOgw/edit?usp=sharing

Maybe something like this can be useful?
This is very useful. Thanks.
Which sea is meant in row C "Ocean"?
It is too late just to be concerned about Climate Change

Juan C. García

  • Young ice
  • Posts: 3359
    • View Profile
  • Liked: 1279
  • Likes Given: 1127
Re: 2018 sea ice area and extent data
« Reply #1921 on: October 15, 2018, 05:47:48 AM »
[ADS-NIPR-JAXA] ASI Extent.

October 14th:
   2018: 5,522,819 km2, an increase of 161,878 km2
   2010's Avg.: 6,103,884 km2, an increase of 124,155 km2

2018 is the 3rd lowest on record.
Which is the best answer to Sep-2012 ASI lost (compared to 1979-2000)?
50% [NSIDC Extent] or
73% [PIOMAS Volume]

Volume is harder to measure than extent, but 3-dimensional space is real, 2D's hide ~50% thickness gone.
-> IPCC/NSIDC trends [based on extent] underestimate the real speed of ASI lost.

oren

  • Moderator
  • First-year ice
  • Posts: 9819
    • View Profile
  • Liked: 3589
  • Likes Given: 3943
Re: 2018 sea ice area and extent data
« Reply #1922 on: October 15, 2018, 05:57:05 AM »
Finally moving up. Seems the remaining 2007 records are safe for another year.

Juan C. García

  • Young ice
  • Posts: 3359
    • View Profile
  • Liked: 1279
  • Likes Given: 1127
Re: 2018 sea ice area and extent data
« Reply #1923 on: October 15, 2018, 06:35:42 AM »
Finally moving up. Seems the remaining 2007 records are safe for another year.

Even though 2018 is starting to have important freezing, I am not sure that is going to have more ASI than 2007, at the end of October.

2007 had also big increases on the following two weeks. The lowest leader to beat will be 2016.
Which is the best answer to Sep-2012 ASI lost (compared to 1979-2000)?
50% [NSIDC Extent] or
73% [PIOMAS Volume]

Volume is harder to measure than extent, but 3-dimensional space is real, 2D's hide ~50% thickness gone.
-> IPCC/NSIDC trends [based on extent] underestimate the real speed of ASI lost.

oren

  • Moderator
  • First-year ice
  • Posts: 9819
    • View Profile
  • Liked: 3589
  • Likes Given: 3943
Re: 2018 sea ice area and extent data
« Reply #1924 on: October 15, 2018, 07:21:56 AM »
I am not referring to end-Oct but to this post by gregcharles and the follow-up by Phil.

Quote
lowest NIPR extent records for October 16 to 19 belong to 2007, the only remaining year before 2010 to have any of its days be the lowest extent. 2018 has a decent chance of ending that though.

gerontocrat

  • Multi-year ice
  • Posts: 20635
    • View Profile
  • Liked: 5308
  • Likes Given: 69
Re: 2018 sea ice area and extent data
« Reply #1925 on: October 15, 2018, 08:36:43 AM »
JAXA ARCTIC EXTENT 5,522,819 km2(October 14, 2018)

- Extent increase a well above average 162k km2,
- Extent is 696 k  (11.5 %) below the 2010's average extent on this date,
- Extent is 853 k (12.0 %) below 2017 on this date.
- freezing to date from minimum is 818k (43.4%) less than the 10 year average extent gain,
- on average 18.9% (nearly 1/5th) of the increase in extent is done.

An extra line in the table based on average extent increase in the last 5 years has been added. This is because extent gain in 2012-13 was so large (rebound from record low minimum) that it distorts the average. The outcome from using the 10 year average extent gain from now is a maximum of 13.51 million km2 (370k < 2017). Using the previous 5 years's average extent gain, the resulting maximum is 13.16 million km2, some 720,000 km2 less than the 2017 record low maximum of 13.88 million km2. 

From the GFS maps it looks like North of 80 will stay at strong +ve temp anomalies from Monday to Friday.. GFS also indicates that overall the Arctic is going to stay at around +4 above average temperatures. But even with this high anomaly, temperatures over most of the Arctic will be well below the freezing point of sea ice of circa -1.8 degrees celsius.

ps: The 2010's average figure used in Juan's table includes 2018 while the figure I use in the attached table excludes 2018.
"Para a Causa do Povo a Luta Continua!"
"And that's all I'm going to say about that". Forrest Gump
"Damn, I wanted to see what happened next" (Epitaph)

Phil42

  • New ice
  • Posts: 74
    • View Profile
  • Liked: 89
  • Likes Given: 1021
Re: 2018 sea ice area and extent data
« Reply #1926 on: October 15, 2018, 01:41:02 PM »
I am not referring to end-Oct but to this post by gregcharles and the follow-up by Phil.

Quote
lowest NIPR extent records for October 16 to 19 belong to 2007, the only remaining year before 2010 to have any of its days be the lowest extent. 2018 has a decent chance of ending that though.

2007's remaining records are most certainly safe for another year, except for maybe 1 day at most. Still, it is not unlikely that 2018 will set some new extent lows towards the end of the month.

Here is the extent-changes-needed-for-new-records-table from today. I've added a column displaying the average extent changes in the given timeframe to put the extent needed number a bit better in perspective. This shows that average extent increases from now on would lead to new records starting 22nd October.
« Last Edit: October 15, 2018, 01:57:40 PM by Phil42 »

gerontocrat

  • Multi-year ice
  • Posts: 20635
    • View Profile
  • Liked: 5308
  • Likes Given: 69
Re: 2018 sea ice area and extent data
« Reply #1927 on: October 15, 2018, 04:26:02 PM »
NSIDC Total Area as at 14 October (5 day trailing average) =  3,894,678 km2

Total Area gain on this day 93 k, 3k less than the 2010's average, area now 743 k less than 2017.

Peripheral Seas loss        3 k,
Central Seas     gain       99 k,                                 
Other Seas       loss         0.7 k, (Okhotsk)
CAB Seas
Beaufort Sea                 gain    21 k
Canadian Archipelago    gain     18 k
East Siberian Sea (ESS) gain     25 k ,
Central Arctic Sea          gain     25 k,

Arctic temperature anomaly staying at around 4 celsius until.....? But as darkness descends temperatures continue to drop like a stone. See attached image. Freezing has taken hold. Attention switches to the pace of that freezing and where it is happening. On this day strong gain in the CAB seas while the Greenland Sea lost 5k (warm weather coming in?).
« Last Edit: October 15, 2018, 04:33:06 PM by gerontocrat »
"Para a Causa do Povo a Luta Continua!"
"And that's all I'm going to say about that". Forrest Gump
"Damn, I wanted to see what happened next" (Epitaph)

Juan C. García

  • Young ice
  • Posts: 3359
    • View Profile
  • Liked: 1279
  • Likes Given: 1127
Re: 2018 sea ice area and extent data
« Reply #1928 on: October 16, 2018, 05:54:47 AM »
I am not referring to end-Oct but to this post by gregcharles and the follow-up by Phil.

Quote
lowest NIPR extent records for October 16 to 19 belong to 2007, the only remaining year before 2010 to have any of its days be the lowest extent. 2018 has a decent chance of ending that though.
Got it. Thanks for your comment!
____________________________________________________________________

[ADS-NIPR (JAXA)] ASI Extent.

October 15th:
   2018: 5,717,495 km2, an increase of almost 2 century breaks: 194,676 km2  8)
   2010's Avg.: 6,243,157 km2, an increase of 139,273 km2
   (2010's Avg. increase is high because ADS-NIPR includes the new 2018 value to make the
       average).

2018 is now the 4th lowest on record.
Which is the best answer to Sep-2012 ASI lost (compared to 1979-2000)?
50% [NSIDC Extent] or
73% [PIOMAS Volume]

Volume is harder to measure than extent, but 3-dimensional space is real, 2D's hide ~50% thickness gone.
-> IPCC/NSIDC trends [based on extent] underestimate the real speed of ASI lost.

gerontocrat

  • Multi-year ice
  • Posts: 20635
    • View Profile
  • Liked: 5308
  • Likes Given: 69
Re: 2018 sea ice area and extent data
« Reply #1929 on: October 16, 2018, 08:17:21 AM »
JAXA ARCTIC EXTENT 5,717,495 km2(October 15, 2018)

- Extent increase a well above average 195k km2,
- Extent is 637 k  (10 %) below the 2010's average extent on this date,
- Extent is 591 k (9.4 %) below 2017 on this date.
- freezing to date from minimum is 758k (37.5%) less than the 10 year average extent gain,
- on average 20.3% (1/5th) of the increase in extent is done.

An extra line in the table based on average extent increase in the last 5 years has been added. This is because extent gain in 2012-13 was so large (rebound from record low minimum) that it distorts the average. The outcome from using the 10 year average extent gain from now is a maximum of 13.57 million km2 (310k < 2017). Using the previous 5 years's average extent gain, the resulting maximum is 13.25 million km2, some 630,000 km2 less than the 2017 record low maximum of 13.88 million km2. 

Extent gain is currently really playing catch-up. From the GFS maps it looks like North of 80 will stay at strong +ve temp anomalies from Monday to Friday.. GFS also indicates that overall the Arctic is going to stay at around +4 above average temperatures. But even with this high anomaly, temperatures over most of the Arctic will be well below the freezing point of sea ice of circa -1.8 degrees celsius.

______________________________________________________________________
ps: The 2010's average figure used in Juan's table includes 2018 while the figure I use in the attached table excludes 2018. I exclude 2018 (from all JAXA and NSIDC tables and graphs) so the difference of the current year with the decade average is not modified by the current year data.
____________________________________________________________________
"Para a Causa do Povo a Luta Continua!"
"And that's all I'm going to say about that". Forrest Gump
"Damn, I wanted to see what happened next" (Epitaph)

gerontocrat

  • Multi-year ice
  • Posts: 20635
    • View Profile
  • Liked: 5308
  • Likes Given: 69
Re: 2018 sea ice area and extent data
« Reply #1930 on: October 16, 2018, 03:06:37 PM »
NSIDC Total Area as at 15 October (5 day trailing average) =  4,019,448 km2

Total Area gain on this day 125 k, 24k greater than the 2010's average, area now 715 k less than 2017.

Peripheral Seas loss        8 k,
Central Seas     gain       131 k,                                 
Other Seas       gain         1 k, (Hudson)

Peripheral Seas
Greenland Sea             loss  10k     
CAB Seas
Beaufort Sea                 gain    31 k
Canadian Archipelago    gain     21 k
East Siberian Sea (ESS) gain     26 k ,
Central Arctic Sea          gain     35 k,

Arctic temperature anomaly staying at around 4 celsius until.....? But as darkness descends temperatures continue to drop like a stone. Freezing has taken hold in the Central Seas. Attention switches to the pace of that freezing and where it is happening. On this day very strong gain in the CAB seas while the Greenland Sea lost 10k (warm weather coming in).
« Last Edit: October 16, 2018, 03:15:54 PM by gerontocrat »
"Para a Causa do Povo a Luta Continua!"
"And that's all I'm going to say about that". Forrest Gump
"Damn, I wanted to see what happened next" (Epitaph)

Juan C. García

  • Young ice
  • Posts: 3359
    • View Profile
  • Liked: 1279
  • Likes Given: 1127
Re: 2018 sea ice area and extent data
« Reply #1931 on: October 16, 2018, 07:11:41 PM »
During the melting season, I looked to post a brief analysis of the ADI-NIPR (JAXA) daily value, after 20 minutes of having the update made by ADI-NIPR. I think that it was appreciated, because there are some people like me, that cannot wait to know what it is happening.  ;)

But during the freezing season, I think that it is not important to have my post so “immediately”. Gerontocrat makes a great analysis possibly two hours later. So, I am thinking of suspending my posts until the next melting season.
Which is the best answer to Sep-2012 ASI lost (compared to 1979-2000)?
50% [NSIDC Extent] or
73% [PIOMAS Volume]

Volume is harder to measure than extent, but 3-dimensional space is real, 2D's hide ~50% thickness gone.
-> IPCC/NSIDC trends [based on extent] underestimate the real speed of ASI lost.

oren

  • Moderator
  • First-year ice
  • Posts: 9819
    • View Profile
  • Liked: 3589
  • Likes Given: 3943
Re: 2018 sea ice area and extent data
« Reply #1932 on: October 16, 2018, 07:19:15 PM »
I can only say I very much appreciate your timely updates during the melting season. I can't go about my day not knowing the JAXA daily result... so thanks a lot for that.

gerontocrat

  • Multi-year ice
  • Posts: 20635
    • View Profile
  • Liked: 5308
  • Likes Given: 69
Re: 2018 sea ice area and extent data
« Reply #1933 on: October 16, 2018, 08:09:59 PM »
During the melting season, I looked to post a brief analysis of the ADI-NIPR (JAXA) daily value, after 20 minutes of having the update made by ADI-NIPR. I think that it was appreciated, because there are some people like me, that cannot wait to know what it is happening.  ;)

But during the freezing season, I think that it is not important to have my post so “immediately”. Gerontocrat makes a great analysis possibly two hours later. So, I am thinking of suspending my posts until the next melting season.
Dammit, Juan, you are reading my mind and beating me to it. I've already been less frequent on the Antarctic and Global posts just to reduce the load so I can think about new developments.
"Para a Causa do Povo a Luta Continua!"
"And that's all I'm going to say about that". Forrest Gump
"Damn, I wanted to see what happened next" (Epitaph)

colchonero

  • Frazil ice
  • Posts: 140
    • View Profile
  • Liked: 27
  • Likes Given: 5
Re: 2018 sea ice area and extent data
« Reply #1934 on: October 16, 2018, 08:11:08 PM »
Gerontocrat stop posting your c**p, we are losing Juan because of you !! ;D ;D All kidding aside, both of you guys give us great information. Juan (for some members in the early morning, for some before going to sleep) gives us a great insight as fast as possible, as soon as the data is released, he tells us how big the increase/decrease was, and where we are in comparison to other years. A bit later Gerontocrat comes with his great analysis and thorough information on how freezing/melting is progressing, and where could we end up with the current pace.  Later that day geronto gives us also NSIDC data, 5 day area average for each sea.

Juan I mean if you have something else to do, or it is becoming boring to write everyday that stuff, then that's obviously something else, but besides that, if you think your comments are not useful, and there is no point, you're 100% wrong.

Stephan

  • Young ice
  • Posts: 2669
    • View Profile
  • Liked: 759
  • Likes Given: 459
Re: 2018 sea ice area and extent data
« Reply #1935 on: October 16, 2018, 08:19:46 PM »
I also appreciate Juan's posting in the morning (before I go to work) and gerontocrat's posting in the afternoon when I return from my office. I kindly ask you to continue to present your daily analyses on sea ice extent and area.
Stephan
It is too late just to be concerned about Climate Change

Juan C. García

  • Young ice
  • Posts: 3359
    • View Profile
  • Liked: 1279
  • Likes Given: 1127
Re: 2018 sea ice area and extent data
« Reply #1936 on: October 16, 2018, 08:59:07 PM »
Thank you for your comments.

In a way, it puts pressure to do it daily. Sometimes I just want to go to sleep earlier or sometimes I just want to do other things.

So, what I going to do is to reduce the number of posts on a weekly basis, but I will do it at least four or five times during the week, on the freezing season. On the melting season, I become an ADS-NIPR addict (I can’t wait to see what is happening, so I hope to do it seven days a week). :D

P.S. Feel free to post yourself if you find some delay on my posts. I think that the last value and the daily change will be enough.

« Last Edit: October 16, 2018, 09:12:14 PM by Juan C. García »
Which is the best answer to Sep-2012 ASI lost (compared to 1979-2000)?
50% [NSIDC Extent] or
73% [PIOMAS Volume]

Volume is harder to measure than extent, but 3-dimensional space is real, 2D's hide ~50% thickness gone.
-> IPCC/NSIDC trends [based on extent] underestimate the real speed of ASI lost.

uniquorn

  • First-year ice
  • Posts: 5135
    • View Profile
  • Liked: 2175
  • Likes Given: 388
Re: 2018 sea ice area and extent data
« Reply #1937 on: October 16, 2018, 09:13:53 PM »
Thanks JCG. Appreciate the short term ASI neg feedback thread too.

Stephan

  • Young ice
  • Posts: 2669
    • View Profile
  • Liked: 759
  • Likes Given: 459
Re: 2018 sea ice area and extent data
« Reply #1938 on: October 16, 2018, 09:29:35 PM »
Thank you for your comments.

In a way, it puts pressure to do it daily. Sometimes I just want to go to sleep earlier or sometimes I just want to do other things.

So, what I going to do is to reduce the number of posts on a weekly basis, but I will do it at least four or five times during the week, on the freezing season. On the melting season, I become an ADS-NIPR addict (I can’t wait to see what is happening, so I hope to do it seven days a week). :D

P.S. Feel free to post yourself if you find some delay on my posts. I think that the last value and the daily change will be enough.
Dear Juan,
your proposal is alright with me. Please feel free to take some days off - I also can't visit this forum on a daily basis. Every of your posts is welcome.
It is too late just to be concerned about Climate Change

oren

  • Moderator
  • First-year ice
  • Posts: 9819
    • View Profile
  • Liked: 3589
  • Likes Given: 3943
Re: 2018 sea ice area and extent data
« Reply #1939 on: October 16, 2018, 10:41:30 PM »
Thank you for your comments.

In a way, it puts pressure to do it daily. Sometimes I just want to go to sleep earlier or sometimes I just want to do other things.

So, what I going to do is to reduce the number of posts on a weekly basis, but I will do it at least four or five times during the week, on the freezing season. On the melting season, I become an ADS-NIPR addict (I can’t wait to see what is happening, so I hope to do it seven days a week). :D

P.S. Feel free to post yourself if you find some delay on my posts. I think that the last value and the daily change will be enough.
Juan, please don't feel obligated or under pressure, though we all enjoy your efforts. Let's do it so the first addict that is online past the JAXA update will post the last value + daily change, it could be you or me or others, until (if and when) you announce you want to return to a full time post.

Alison

  • New ice
  • Posts: 56
    • View Profile
  • Liked: 23
  • Likes Given: 145
Re: 2018 sea ice area and extent data
« Reply #1940 on: October 16, 2018, 11:44:48 PM »
Quote
I can only say I very much appreciate your timely updates during the melting season

Second that!

Wherestheice

  • Frazil ice
  • Posts: 313
    • View Profile
  • Liked: 89
  • Likes Given: 19
Re: 2018 sea ice area and extent data
« Reply #1941 on: October 17, 2018, 12:30:12 AM »
During the melting season, I looked to post a brief analysis of the ADI-NIPR (JAXA) daily value, after 20 minutes of having the update made by ADI-NIPR. I think that it was appreciated, because there are some people like me, that cannot wait to know what it is happening.  ;)

But during the freezing season, I think that it is not important to have my post so “immediately”. Gerontocrat makes a great analysis possibly two hours later. So, I am thinking of suspending my posts until the next melting season.

No stress Juan, your work here is crucial to the understanding of what’s happening in the Arctic. You have done a wonderful job and you have my respect. Everyone needs breaks and vacations. You do you
"When the ice goes..... F***

Wherestheice

  • Frazil ice
  • Posts: 313
    • View Profile
  • Liked: 89
  • Likes Given: 19
Re: 2018 sea ice area and extent data
« Reply #1942 on: October 17, 2018, 06:17:57 AM »
JAXA extent for October 16th: 5,780,697 km2

An increase of 63,202 km2
"When the ice goes..... F***

Phil42

  • New ice
  • Posts: 74
    • View Profile
  • Liked: 89
  • Likes Given: 1021
Re: 2018 sea ice area and extent data
« Reply #1943 on: October 17, 2018, 09:12:54 AM »
Thanks Juan and gerontocrat for your daily updates. They are highly appreciated by a lot of people. But as others have said already, only do them if you want to.

Already missing Juan's daily table, I tried to recreate it, I hope that is okay.
« Last Edit: October 17, 2018, 09:46:49 AM by Phil42 »

psymmo7

  • New ice
  • Posts: 81
    • View Profile
  • Liked: 35
  • Likes Given: 17
Re: 2018 sea ice area and extent data
« Reply #1944 on: October 17, 2018, 10:25:05 AM »
Thanks Phil42 your effort is appreciated - keep it up!

gerontocrat

  • Multi-year ice
  • Posts: 20635
    • View Profile
  • Liked: 5308
  • Likes Given: 69
Re: 2018 sea ice area and extent data
« Reply #1945 on: October 17, 2018, 10:56:40 AM »
JAXA ARCTIC EXTENT 5,780,697 km2(October 16, 2018)

- Extent increase a below average 63 k km2,
- Extent is 662 k  (10.3 %) below the 2010's average extent on this date,
- Extent is 682 k (10.6 %) below 2017 on this date,
- Extent remains 4th lowest in the satellite record,
- Freezing to date from minimum is 831 k (38.6%) less than the 10 year average extent gain,
- on average 21.6% (>1/5th) of the increase in extent is done.

An extra line in the table based on average extent increase in the last 5 years has been added. This is because extent gain in 2012-13 was so large (rebound from record low minimum) that it distorts the average. The outcome from using the 10 year average extent gain from now is a maximum of 13.50 million km2 (330k < 2017). Using the previous 5 years's average extent gain, the resulting maximum is 13.20 million km2, some 680,000 km2 less than the 2017 record low maximum of 13.88 million km2. 

Extent gain is or is not currently really playing catch-up. From the GFS maps it looks like North of 80 will stay at strong +ve temp anomalies for another couple of days. GFS also indicates that overall the Arctic is going to stay at around +4 above average temperatures. But even with this high anomaly, temperatures over most of the Arctic will be well below the freezing point of sea ice of circa -1.8 degrees celsius.

______________________________________________________________________
ps: The 2010's average figure used in Juan's table includes 2018 while the figure I use in the attached table excludes 2018. I exclude 2018 (from all JAXA and NSIDC tables and graphs) so the difference of the current year with the decade average is not modified by the current year data.
____________________________________________________________________
"Para a Causa do Povo a Luta Continua!"
"And that's all I'm going to say about that". Forrest Gump
"Damn, I wanted to see what happened next" (Epitaph)

echoughton

  • Frazil ice
  • Posts: 121
    • View Profile
  • Liked: 21
  • Likes Given: 82
Re: 2018 sea ice area and extent data
« Reply #1946 on: October 17, 2018, 12:48:40 PM »
Thank you for your comments.

In a way, it puts pressure to do it daily. Sometimes I just want to go to sleep earlier or sometimes I just want to do other things.

So, what I going to do is to reduce the number of posts on a weekly basis, but I will do it at least four or five times during the week, on the freezing season. On the melting season, I become an ADS-NIPR addict (I can’t wait to see what is happening, so I hope to do it seven days a week). :D

P.S. Feel free to post yourself if you find some delay on my posts. I think that the last value and the daily change will be enough.

Thank you Juan for your diligence! I really appreciate it.

gerontocrat

  • Multi-year ice
  • Posts: 20635
    • View Profile
  • Liked: 5308
  • Likes Given: 69
Re: 2018 sea ice area and extent data
« Reply #1947 on: October 17, 2018, 02:44:34 PM »
NSIDC Total Area as at 16 October (5 day trailing average) =  4,146,406 km2

Total Area gain on this day 127 k, 27k greater than the 2010's average, area now 689 k less than 2017.

Peripheral Seas loss        8 k,
Central Seas     gain       132 k,                                 
Other Seas       gain         3 k, (2k Hudson 1k Okhotsk)

Peripheral Seas
Greenland Sea             loss  13k     
CAB Seas
Beaufort Sea                 gain    32 k
Canadian Archipelago    gain     26 k
East Siberian Sea (ESS) gain     27 k ,
Central Arctic Sea          gain     28 k,

Chukchi gain 10k - a surprise

Arctic temperature anomaly staying at around 4 celsius until.....? But as darkness descends temperatures continue to drop like a stone. Freezing has taken hold in the Central Seas. Attention switches to the pace of freezing and where it is happening. On this day very strong gain in the CAB seas while the Greenland Sea lost 10k (warm weather is still coming in) but the Chukchi gained 10k.
« Last Edit: October 17, 2018, 04:11:49 PM by gerontocrat »
"Para a Causa do Povo a Luta Continua!"
"And that's all I'm going to say about that". Forrest Gump
"Damn, I wanted to see what happened next" (Epitaph)

colchonero

  • Frazil ice
  • Posts: 140
    • View Profile
  • Liked: 27
  • Likes Given: 5
Re: 2018 sea ice area and extent data
« Reply #1948 on: October 17, 2018, 02:50:02 PM »
Gerontocrat, the graph shows 10k area GAIN in Chukchi today.

gerontocrat

  • Multi-year ice
  • Posts: 20635
    • View Profile
  • Liked: 5308
  • Likes Given: 69
Re: 2018 sea ice area and extent data
« Reply #1949 on: October 17, 2018, 04:18:04 PM »
Gerontocrat, the graph shows 10k area GAIN in Chukchi today.
Thanks Colchonero.

Ah well, I got it right in the last sentence of the posting.

Since my computer got clobbered I lost my inherited excel, and also lost Lotus 1-2-3 which worked really well,  - and so I have to use Libre instead. It does not like large, complex interconnected spreadsheets. It usually crashes just when I should be checking my postings.
"Para a Causa do Povo a Luta Continua!"
"And that's all I'm going to say about that". Forrest Gump
"Damn, I wanted to see what happened next" (Epitaph)