Support the Arctic Sea Ice Forum and Blog

Author Topic: Freeform season chatter and light commentary  (Read 316284 times)

HapHazard

  • Grease ice
  • Posts: 823
  • Chillin' on Cold Mountain.
    • View Profile
  • Liked: 284
  • Likes Given: 5273
Re: Freeform season chatter and light commentary
« Reply #1650 on: July 27, 2023, 06:14:13 AM »
Worldview showing signs of life today, but only for the 26th. Here's what it looks like. Hopefully they can back-fill the other empty dates.

If I call you out but go no further, the reason is Brandolini's law.

Bardian

  • New ice
  • Posts: 55
    • View Profile
  • Liked: 32
  • Likes Given: 37
Re: Freeform season chatter and light commentary
« Reply #1651 on: July 29, 2023, 07:16:44 AM »
https://edition.cnn.com/2023/06/20/europe/marine-heatwave-north-atlantic-climate-scn-intl/index.html

"Parts of the North Sea are experiencing a category 4 marine heat wave – defined as “extreme” – according to the National Oceanic and Atmospheric Administration. In some areas, water temperatures are up to 5 degrees Celsius (9 Fahrenheit) hotter than usual."

Stronger storms late fall, more rainfall and maybe those storms will survive longer and do serious damage to the ice north and north-east of Svalbard

Glen Koehler

  • Grease ice
  • Posts: 934
    • View Profile
  • Liked: 742
  • Likes Given: 1418
Re: Freeform season chatter and light commentary
« Reply #1652 on: July 29, 2023, 11:59:10 PM »
     "Multiple lines of evidence gathered so far suggest that Arctic sea ice is thinning even faster than it is losing extent. Thin ice can melt away completely much sooner than thick ice, and is less resistant to intense weather events."

     "While old ice is generally thicker than young ice, submarine observations prior to 2000 have found that ice more than four years old is slightly thinner than four-year-old ice. The reason for this slight thinning was not clear at the time of paper publication."
 
     Interesting article by NSIDC on measuring ASI thickness at:
How thick is sea ice and how do we know?
https://nsidc.org/learn/ask-scientist/how-thick-is-sea-ice
“What is at stake.... Everything, I would say." ~ Julienne Stroeve

Glen Koehler

  • Grease ice
  • Posts: 934
    • View Profile
  • Liked: 742
  • Likes Given: 1418
Re: Freeform season chatter and light commentary
« Reply #1653 on: July 30, 2023, 12:05:50 AM »
Liu, Y., Key, J. R., Wang, X., and Tschudi, M.: Multidecadal Arctic sea ice thickness and volume derived from ice age, The Cryosphere, 14, 1325–1345, https://doi.org/10.5194/tc-14-1325-2020, 2020.

    "Of the factors affecting the sea ice volume trends, changes in sea ice thickness contribute more than changes in sea ice area, with a contribution of at least 80 % from changes in sea ice thickness from November to May and nearly 50 % in August and September, while less than 30 % is from changes in sea ice area in all months."

    "IceAgeDerived ice thickness over the Arctic from 1984 to 2018 ..."  "... is thickest along the northern portion of the Canadian Archipelago and Greenland, decreasing radially, with the thinnest ice over the Arctic's peripheral seas on the Eurasian side. The thickest sea ice appears in the spring, around 3 m in the Canada Basin and North Pole areas. The thinnest sea ice is in early fall, around or less than 1 m over the coastal areas of the Kara, Laptev, and Chukchi seas. The spatial distributions of PIOMAS and OTIM show similar patterns, while the ice thickness north of the Canadian Archipelago and Greenland is thicker, especially in PIOMAS."

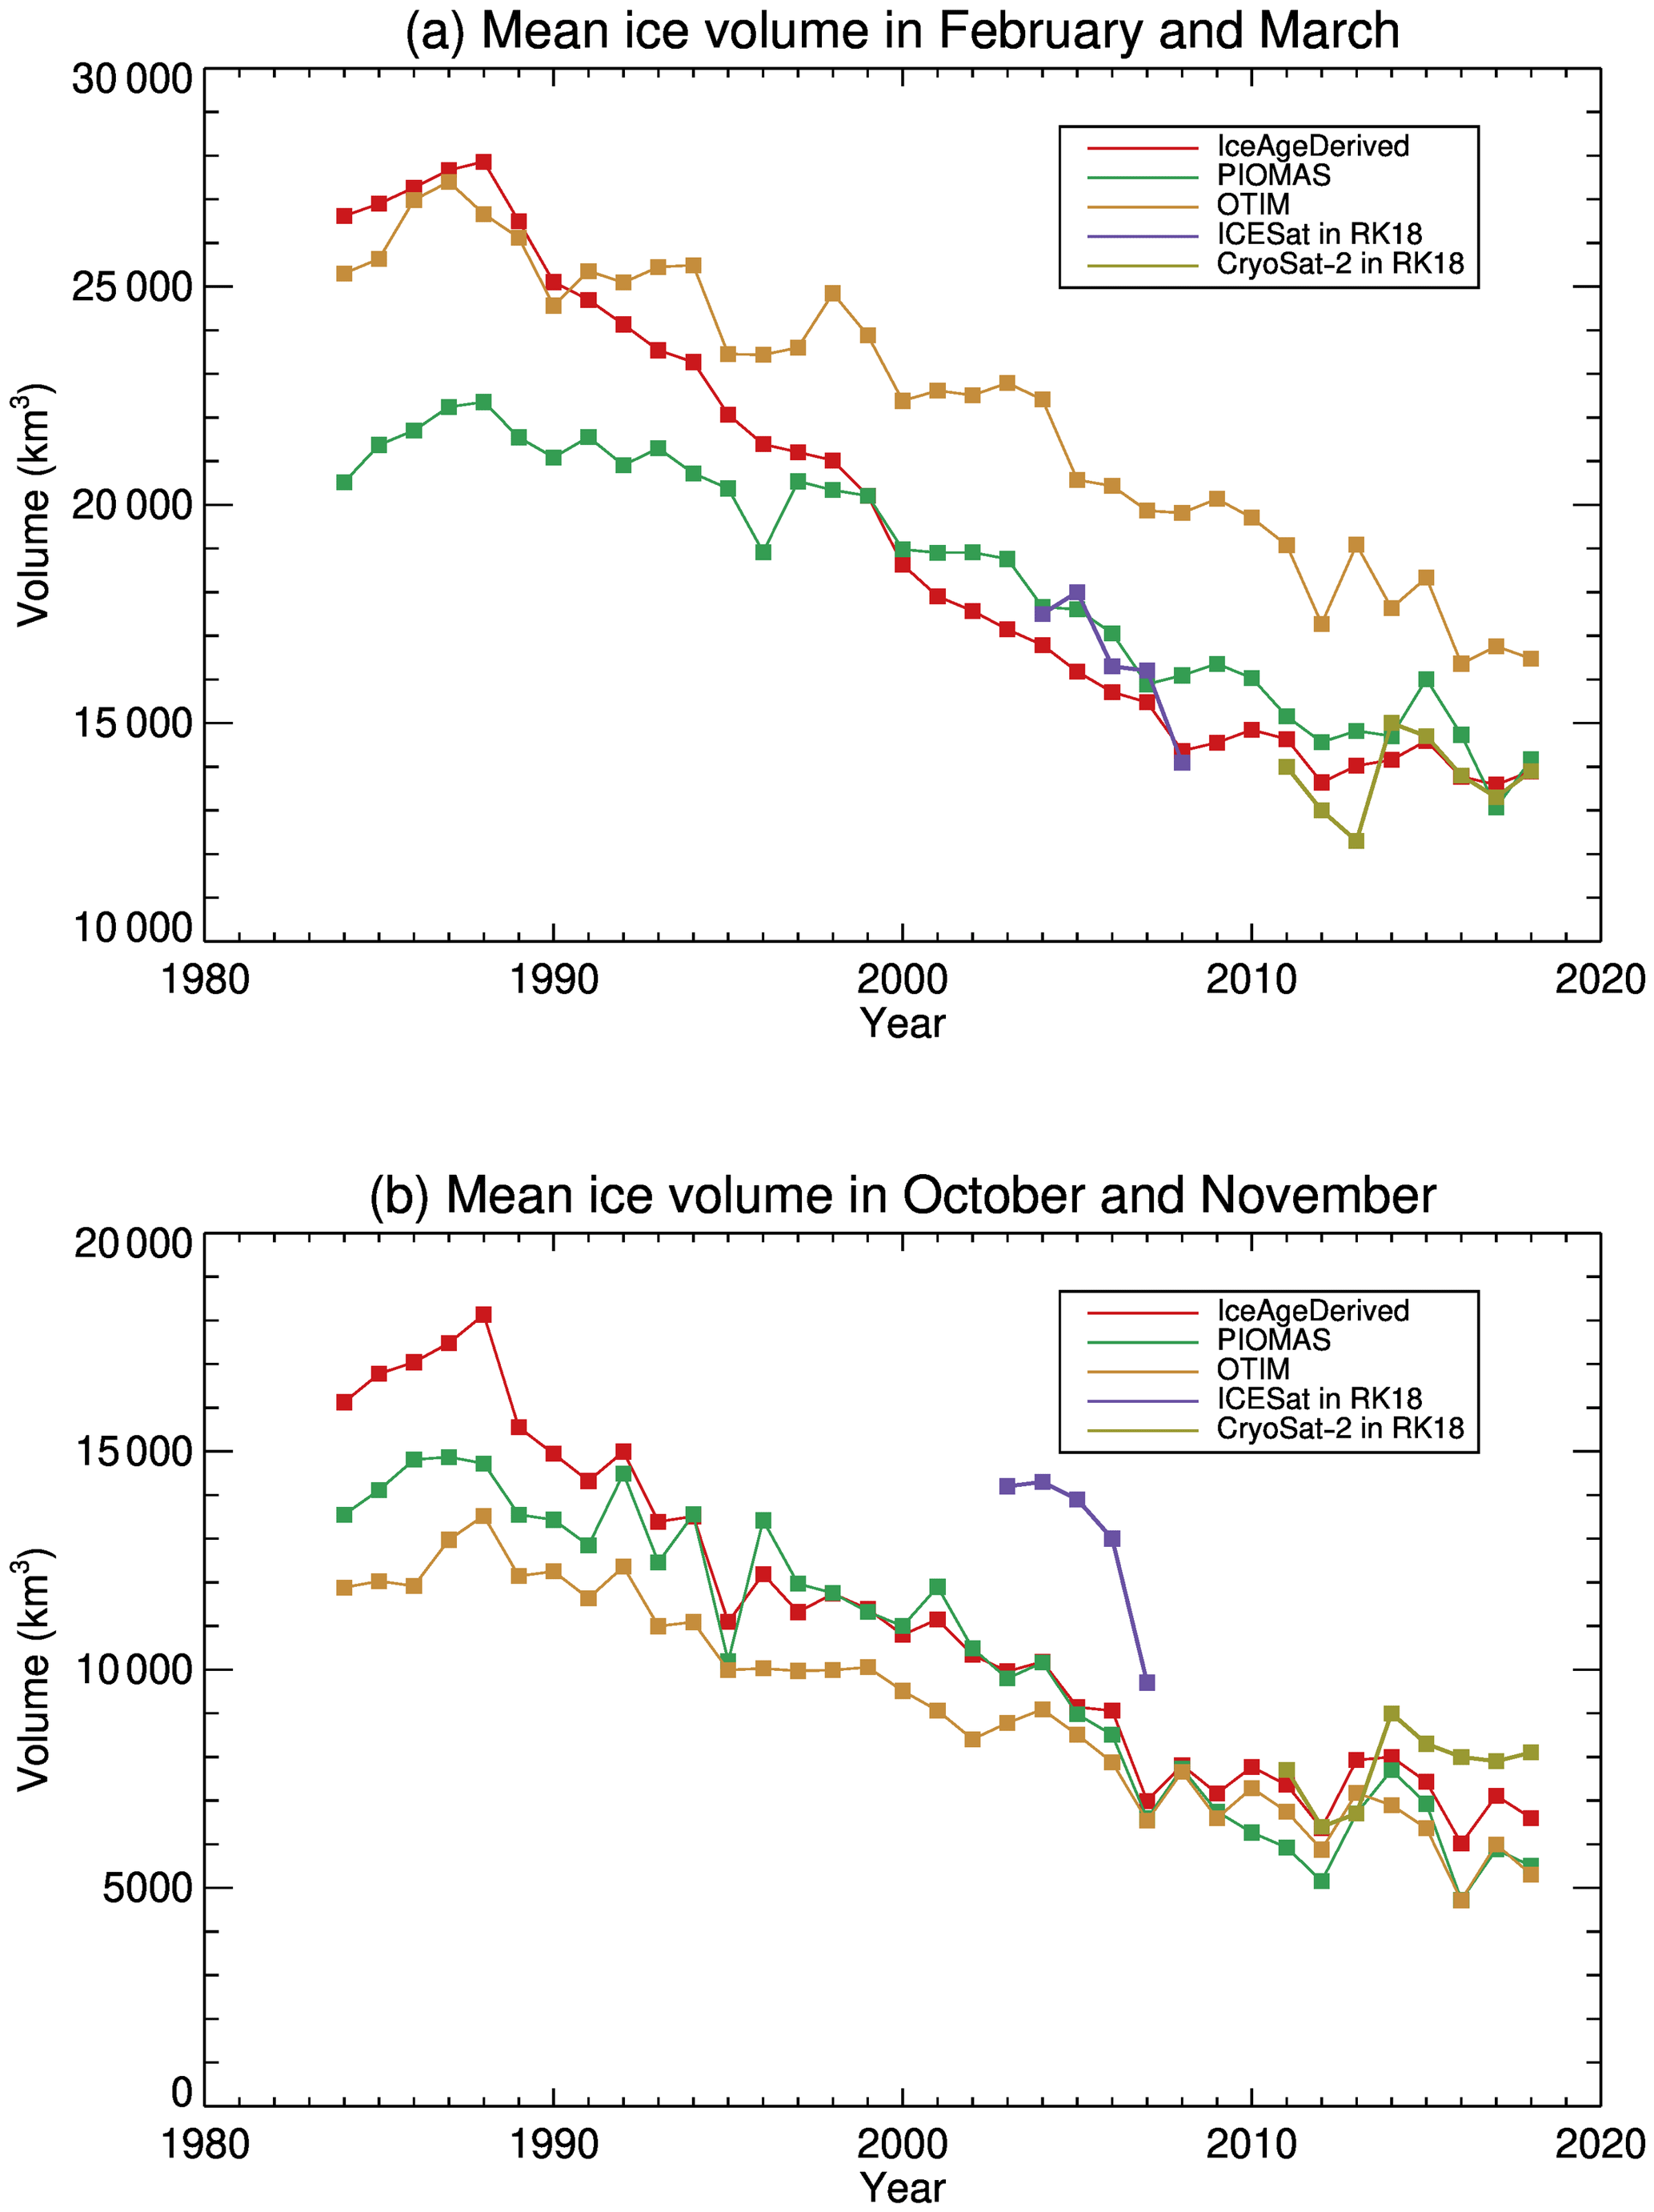
     "Sea ice volume over the Arctic Ocean shows a generally decreasing trend from 1984 to around 2008, and relatively stable conditions afterwards in almost every month."

     "The overall decreasing trends are consistent with observations of the replacement of multiyear sea ice with first-year ice in the Arctic Ocean, and partial recovery of multiyear sea ice after the summer of 2008"

     "The overall trends in ice volume over the Arctic Ocean from 1984 to 2018 are −474, −258, and −311 km3 yr−1 in February–March and −342, −305, and −230 km3 yr−1 in October–November for the IceAgeDerived product, PIOMAS, and OTIM, respectively, with significance levels all higher than 95 %."

« Last Edit: July 30, 2023, 05:09:52 AM by Glen Koehler »
“What is at stake.... Everything, I would say." ~ Julienne Stroeve

johnm33

  • Grease ice
  • Posts: 794
    • View Profile
  • Liked: 131
  • Likes Given: 127
Re: Freeform season chatter and light commentary
« Reply #1654 on: July 30, 2023, 11:59:16 AM »
Apropo nothing in particular a look at the 'top' of the atmosphere on the equinox and now, the S.P. shifted to this pattern around then and seems to have grown more intense since.

Niall Dollard

  • Nilas ice
  • Posts: 1179
    • View Profile
  • Liked: 468
  • Likes Given: 118
Re: Freeform season chatter and light commentary
« Reply #1655 on: August 02, 2023, 10:18:52 PM »
Hopefully they can back-fill the other empty dates.

Checked this evening and all the missing dates on Worldview are available to view.  :)

oren

  • Moderator
  • First-year ice
  • Posts: 9822
    • View Profile
  • Liked: 3590
  • Likes Given: 3969
Re: Freeform season chatter and light commentary
« Reply #1656 on: August 02, 2023, 11:32:19 PM »
Great, thanks for the update.

pearscot

  • Frazil ice
  • Posts: 385
    • View Profile
  • Liked: 190
  • Likes Given: 65
Re: Freeform season chatter and light commentary
« Reply #1657 on: August 09, 2023, 02:52:36 AM »
Every single time I look at global ocean surface temperature anomalies or global sea ice extent I’m shocked. I know it’s an “all of the above” type answer, but the climate clearly hit some new tipping point this year and paradigm shift. It’s really surprised to see Antarctica unable to regain ice how it did not too long ago.

Earth will blow past the 1.5c+ threshold quite soon, I suspect.

pls!

kiwichick16

  • Grease ice
  • Posts: 969
    • View Profile
  • Liked: 92
  • Likes Given: 38
Re: Freeform season chatter and light commentary
« Reply #1658 on: August 13, 2023, 05:02:02 AM »
@  Glen Koehler ... sudden collapse is a theme explored by J. Diamond in his book "Collapse; How societies choose to fail  or survive"

His ideas mirror you thoughts in that life carries on for most in much the way it has , even in the face of increasing challenges, until a significant change or event, or series of events , creates sudden breakdowns and failures , which cascades into collapse ; or major changes to the system leads to survival..... (paraphrasing of course )

dnem

  • Grease ice
  • Posts: 709
    • View Profile
  • Liked: 319
  • Likes Given: 279
Re: Freeform season chatter and light commentary
« Reply #1659 on: August 13, 2023, 02:39:31 PM »
I was going to msg Glen saying that I agree with his view about complex system dynamics but seeing as kc16 did it here, I'll pile on.

Yes. Arctic SIA/SIE extent will have its 4+ sigma event and it will happen within the next handful of years.

OffTheGrid

  • Frazil ice
  • Posts: 188
    • View Profile
  • Liked: 61
  • Likes Given: 32
Re: Freeform season chatter and light commentary
« Reply #1660 on: August 29, 2023, 12:53:57 AM »
That Hunga Tonga ha'apai eruption put 4 blasts to excess of 100km Altitude. We do not know how much water vapour and vaporised rock went up there because the four main blasts were direct sourced magma from over 50km deep.

That warm spot is at the foot of three of the largest underwater landslides cataloged from the last million years, and is above a normal spreading fault at right angles to the Lomonosov and Gakkel Ridge systems.
It appears to be very active with the volcanism and hydrothermal activity at present.


nadir

  • Nilas ice
  • Posts: 2264
    • View Profile
  • Liked: 251
  • Likes Given: 37
Re: Freeform season chatter and light commentary
« Reply #1661 on: September 02, 2023, 05:25:16 PM »
What happened to the “Laptev collapse” or “Laptev tipping point due to Atlantification” crew this year?

oren

  • Moderator
  • First-year ice
  • Posts: 9822
    • View Profile
  • Liked: 3590
  • Likes Given: 3969
Re: Freeform season chatter and light commentary
« Reply #1662 on: September 03, 2023, 02:08:42 AM »
Laptev this year was a recipient of loads of CAB export, and also the epicenter of a persistent cyclone during peak insolation period. Not sure we can generalize what seems to be more of an outlier than the norm.
It would be interesting to follow how Laptev behaves in 2024 and 2025. The same pattern repeating would be cause to reevaluate expectations and predictions.

KiwiGriff

  • Nilas ice
  • Posts: 1642
    • View Profile
  • Liked: 711
  • Likes Given: 380
Re: Freeform season chatter and light commentary
« Reply #1663 on: September 03, 2023, 05:34:23 AM »
@  Glen Koehler ... sudden collapse is a theme explored by J. Diamond in his book "Collapse; How societies choose to fail  or survive"

His ideas mirror you thoughts in that life carries on for most in much the way it has , even in the face of increasing challenges, until a significant change or event, or series of events , creates sudden breakdowns and failures , which cascades into collapse ; or major changes to the system leads to survival..... (paraphrasing of course )

"It would be some consolation for the feebleness of our selves and our works if all things should perish as slowly as they come into being; but as it is, increases are of sluggish growth, but the way to ruin is rapid." Lucius Anneaus Seneca, Letters to Lucilius, n. 91


https://cassandralegacy.blogspot.com/
Animals can be driven crazy by placing too many in too small a pen. Homo sapiens is the only animal that voluntarily does this to himself.
Notebooks of Lazarus Long.
Robert Heinlein.

kiwichick16

  • Grease ice
  • Posts: 969
    • View Profile
  • Liked: 92
  • Likes Given: 38
Re: Freeform season chatter and light commentary
« Reply #1664 on: September 03, 2023, 08:00:10 AM »
@  kiwigriff   a common refrain in discussions re peak oil

https://countercurrents.org/2016/12/peak-oil-by-any-other-name-is-still-peak-oil/

KiwiGriff

  • Nilas ice
  • Posts: 1642
    • View Profile
  • Liked: 711
  • Likes Given: 380
Re: Freeform season chatter and light commentary
« Reply #1665 on: September 03, 2023, 08:33:36 AM »
The refrain on here about tipping points for the ice or AMOC is the same Seneca cliff.
Animals can be driven crazy by placing too many in too small a pen. Homo sapiens is the only animal that voluntarily does this to himself.
Notebooks of Lazarus Long.
Robert Heinlein.

kiwichick16

  • Grease ice
  • Posts: 969
    • View Profile
  • Liked: 92
  • Likes Given: 38
Re: Freeform season chatter and light commentary
« Reply #1666 on: September 03, 2023, 10:31:26 AM »
@  kiwigriff   .....i am more worried about the slowdown of AABW  , which is the main driver of the ocean circulation   .....and the lagtime between emissions and the effects

binntho

  • Nilas ice
  • Posts: 2228
    • View Profile
  • Liked: 888
  • Likes Given: 239
Re: Freeform season chatter and light commentary
« Reply #1667 on: September 08, 2023, 11:41:47 AM »
Inspired by a series of excellent posts by Glen Koehler (as always), I decided to make a graph showing the annual volume melt as estimated by PIOMAS

I've never done this chart before, and can't remember others doing it although someone must have! It is very simple, the difference between maximum and minimum each year (with 2023 extrapolated for another 13 days based on 2022 melt).

What is perhaps most interesting is how lacking in phase changes or stepwise stumbles the data seems to be. There are 4 significant outliers (1996, 1981, 2010, 2012) but the rest seems to fall surprisingly close to the trendline, with this year clocking in at 117 km3 above the trend (if my extrapolation holds - could well be more given the current forecasts).

Every year, annual melt increases by 56 km3 according to this graph. Compare this with the annual average loss of 280 km3 per year and one is tempted to conclude that reduction in refreeze is more significant than increases in melt?

EDIT: No, that is not the explanation. More ice was created last freezing season (18.208 km3) than in any year prior to 2007. The annual average refreeze before 2007 was just over 16.000 km3.
« Last Edit: September 08, 2023, 01:01:55 PM by binntho »
because a thing is eloquently expressed it should not be taken to be as necessarily true
St. Augustine, Confessions V, 6

binntho

  • Nilas ice
  • Posts: 2228
    • View Profile
  • Liked: 888
  • Likes Given: 239
Re: Freeform season chatter and light commentary
« Reply #1668 on: September 08, 2023, 12:02:34 PM »
But what about the annual refreeze? The situation here is significantly different - something clearly happens around 2007. The first graph shows trendline for the entire period, with annual refreeze increasing at 62 km3.

The second graph has two trendlines - a totally flat line leading up to 2007, and a slowly decreasing trend since then. Not statistically valid for breakpoint analysis, but still a good way to highlight the very big change that seemes to have happened in and around 2007.
because a thing is eloquently expressed it should not be taken to be as necessarily true
St. Augustine, Confessions V, 6

Paul

  • Grease ice
  • Posts: 588
    • View Profile
  • Liked: 138
  • Likes Given: 9
Re: Freeform season chatter and light commentary
« Reply #1669 on: September 08, 2023, 02:06:52 PM »
Laptev this year was a recipient of loads of CAB export, and also the epicenter of a persistent cyclone during peak insolation period. Not sure we can generalize what seems to be more of an outlier than the norm.
It would be interesting to follow how Laptev behaves in 2024 and 2025. The same pattern repeating would be cause to reevaluate expectations and predictions.

Yep the Laptev bite was more the ESS bite probably due to generally more low pressure set ups which would have ice moving/melting away from the ESS islands. I'm not too convinced by Atlantification in the Laptev will happen anytime soon, the ice there will be more determined by local weather conditions.

Another rule of thumb in recent years, if the Beaufort is really low on ice, it's more likely the Laptev will have more ice and the same way the other way round again all down to local weather patterns.

oren

  • Moderator
  • First-year ice
  • Posts: 9822
    • View Profile
  • Liked: 3590
  • Likes Given: 3969
Re: Freeform season chatter and light commentary
« Reply #1670 on: September 08, 2023, 04:14:38 PM »
But what about the annual refreeze? The situation here is significantly different - something clearly happens around 2007. The first graph shows trendline for the entire period, with annual refreeze increasing at 62 km3.

The second graph has two trendlines - a totally flat line leading up to 2007, and a slowly decreasing trend since then. Not statistically valid for breakpoint analysis, but still a good way to highlight the very big change that seemes to have happened in and around 2007.
I once looked at volume losses and 2007 really stood out not as a huge melting season but as a very poor freezing season. At the time I thought it was because of large winter export, but did not verify it.
In any case, you need to look at it in a hollistic way - often there is a correlation between freeze and melt, but 2007 broke the correlation as its melt season while not huge was above average, while freezing much below average, and the combination killed a lot of ice.
I know I am not explaining it well. I will try to find that old post, maybe it would help.

kassy

  • First-year ice
  • Posts: 8464
    • View Profile
  • Liked: 2057
  • Likes Given: 1996
Re: Freeform season chatter and light commentary
« Reply #1671 on: September 08, 2023, 05:04:16 PM »
In Latin hiatus would be hiati in plural. If a word ends in ius you would get ii but that still only changes us to i.

The volume graph is pretty slow and steady. If we assume the line holds and then take a set area for Arctic sea cover we can calculate the thickness to see how long that holds out.

Of course in the real world things will be slow and steady until they aren´t but we will see.
Þetta minnismerki er til vitnis um að við vitum hvað er að gerast og hvað þarf að gera. Aðeins þú veist hvort við gerðum eitthvað.

oren

  • Moderator
  • First-year ice
  • Posts: 9822
    • View Profile
  • Liked: 3590
  • Likes Given: 3969
Re: Freeform season chatter and light commentary
« Reply #1672 on: September 08, 2023, 05:40:43 PM »
First, I re-found this great post by uniquorn, showing the winter and summer of 2006-2007. Basically 2007's summer caused a lot of damage to the wall of 4YI that was protecting the Beaufort-Chukchi front, but this was probably enabled by the poor winter volume growth and helped along by vigorous ice movement away from the Pacific sector and towards the Atlantic sector.
I am still looking for that other post.

piomas and ice age sep2006-sep2007

oren

  • Moderator
  • First-year ice
  • Posts: 9822
    • View Profile
  • Liked: 3590
  • Likes Given: 3969
Re: Freeform season chatter and light commentary
« Reply #1673 on: September 08, 2023, 06:02:03 PM »
And here it is:

       FWIW, my own opinion about 2007 is to agree with you from a different basis.  It seems to me that the loss of multi-year ice in 2007 either reflected or helped initiate systemic changes in the ASI system.  Various posts in the forum have described how, even though 2012 gets most of the attention since it holds the records, that when looked at from different points of view, 2007 was the Big Year.  I have no hope of remembering in which thread, but (I think it was) Oren or BFTV who put up a post this summer listing losses from September to September which showed that when viewed from that time frame, 2007 outdistanced every other year for losses.  So that's a second (but also not statistically validated) observation to lend weight to your proposition. 
Indeed, here is an expanded version of that post which is found upthread. As my PIOMAS Excel is built around Wipneus data, the following only looks at daily data since 2000.
For each year, I look at the volume gain over the preceding autumn and winter, starting at day 266 of the previous year (~Sep 23rd) and ending at day 121 of that year (~May 1st). Then I look at the volume loss over that year's spring and summer, until day 266. The four worst years in each column are bolded. The results are quite interesting.
Indeed, 2007 is the winner for total net loss. However, its main claim to fame should be the low winter gain. Its summer loss was high for its time but nothing much compared to later years. Looking at the data in chart form clearly shows that something was different after 2007, much higher losses and much higher gains as a larger part of the Arctic participated in the seasonal cycle. In my next post I will look at the various regions, and attempt to find out where the missing 2007 winter volume was located.
In general, high net losses typically occur in years that had a low winter gain compared to their surrounding neighbors, marked in the chart. Also marked is 2017, the year the Arctic dodged a cannonball despite poor winter gain, by having the lowest summer loss since 2004.
In addition, most top years for high summer losses were also top years for high early summer losses.

Click to enlarge images.


Glen Koehler

  • Grease ice
  • Posts: 934
    • View Profile
  • Liked: 742
  • Likes Given: 1418
Re: Freeform season chatter and light commentary
« Reply #1674 on: September 08, 2023, 06:58:24 PM »
    The text below was originally posted in the 2023 Melt Season thread.  Moved here because it is too long and speculative for that thread's focus on current melt status, and fits better here.
------------------------------------------

     I corrected the typo you noted where I said "...steepening decline in ASI from 2005 until 2022".  It now reads "...steepening decline in ASI from 2005 until 2012."

     I did not say that Sumata et al 2023 discussed the Slow Transition.  That was Cornish et al. 2022.  That must be a good study because no less an authority than you said it seemed plausible (albeit with some reservations)! at https://forum.arctic-sea-ice.net/index.php/topic,2348.msg378117.html#msg378117

    Both the Sumata and Cornish papers provide relevant context for the 2023 melt season.
Cornish et al. 2022 suggest that 2023 may be among the last years of the post-2012 hiatus in ASI decline.  Sumata et al 2023 showed how a functional change in the ASI system led to a quantitative change in Transpolar Drift velocity and in ASI thickness & volume.

     It seems to me that the relatively low September ASI metrics --- despite not much of the usual factors cited as creating a strong melt season:  melt pond conditioning in May and June, persistent high-pressure systems, persistent and widespread high-temperature anomalies (though CAA did have that in 2023), dipole positioning, cyclone activity --- can be seen as an indication that because of progressive global warming, Atlantification, declining ASI thickness etc., even mediocre melt seasons such as we had in 2023 are now capable of producing near-record September lows.  I attribute that to underlying (=not always measured or associated with ASI decline) changes in the forces that affect the Arctic Ocean or the ASI directly. 

     September 2023 is not far behind 2020, but with much less apparent melt season forcing.  What does that tell us?  It is worth noting that Fram export was up this year, so that did contribute to low 2023 September values.  But that also fits into my view that the ASI could be getting set up for a Great Flush sooner than anybody expects or wants to see happen.

     Yes, I am using science to justify my gut feeling that the 2023 melt season fits into a paradigm that ASI decline is about to go into overdrive.  My opinion is that the expert consensus that BOE is at least 12 years away, and possibly not until 2050, is way too conservative.  But wadda I know?  Not much compared to the experts.  Then again, some of those experts (e.g. Peter Wadams) expected "ice goes poof" to have happened already, so I am in good company.
« Last Edit: September 09, 2023, 03:35:30 AM by Glen Koehler »
“What is at stake.... Everything, I would say." ~ Julienne Stroeve

John_the_Younger

  • Frazil ice
  • Posts: 440
    • View Profile
  • Liked: 65
  • Likes Given: 139
Re: Freeform season chatter and light commentary
« Reply #1675 on: September 08, 2023, 07:31:43 PM »
I've contended that the 2007 lack of an ice bridge across Nares Strait had an impact on that year's ice loss.  Icy Seas author reported somewhere (published, I think) that Nares ice export that year was 10% of Fram ice export.  What I think is at least as relevant is the pressure relief Nares export creates (during the winter and spring) hundreds of kilometers north of Nares, even beyond the Lincoln Sea: with more room for leads to open and close, I think transpolar drift becomes more efficient.

The Walrus

  • Young ice
  • Posts: 2909
    • View Profile
  • Liked: 152
  • Likes Given: 493
Re: Freeform season chatter and light commentary
« Reply #1676 on: September 09, 2023, 12:04:58 AM »
NSIDC extent data show a similar break around 2007.  This is showing in both the winter ice gain and summer ice loss.
« Last Edit: September 09, 2023, 02:05:16 PM by The Walrus »

Michael Hauber

  • Nilas ice
  • Posts: 1118
    • View Profile
  • Liked: 168
  • Likes Given: 16
Re: Freeform season chatter and light commentary
« Reply #1677 on: September 09, 2023, 05:42:58 AM »
Ice nine - a fictional form of ice that is arranged in a different structure to regular ice.  It is solid at room temperature and when it contacts regular water the different structure can spread into the water and freeze it.  A major plot device for a rather old sci fi novel 'Cat Cradle'.

Looking at the Laptev ice it almost appears like an island immune to melting as ice closer to the pole starts to melt bacck leaving it as an island (the current crack/fissure from ESS side of Laptev through to the Atlantic).  I was imagining that it was like ice nine but different.  It can't cause regular water to freeze, but any water that freezes in contact gains the different structure and is immune to melting at room temperature.  The Laptev ice won't melt, and every freeze season more ice freezes in contact and gains this unmeltable structure.  Ice eight and a half, and the coming ice age.  Bwa ha ha ha.
Climate change:  Prepare for the worst, hope for the best, expect the middle.

John_the_Younger

  • Frazil ice
  • Posts: 440
    • View Profile
  • Liked: 65
  • Likes Given: 139
Re: Freeform season chatter and light commentary
« Reply #1678 on: September 09, 2023, 06:16:52 AM »
Michael,
Thanks for the explanation.  I wondered what was going on!
 :P ::) :o

binntho

  • Nilas ice
  • Posts: 2228
    • View Profile
  • Liked: 888
  • Likes Given: 239
Re: Freeform season chatter and light commentary
« Reply #1679 on: September 09, 2023, 08:17:52 AM »
Thanks Oren. The fingers pointing to 2007 as a major game changer are all over the place. In your post above, the deeply-quoted main part of the post has the following:

Quote
Looking at the data in chart form clearly shows that something was different after 2007, much higher losses and much higher gains as a larger part of the Arctic participated in the seasonal cycle. In my next post I will look at the various regions, and attempt to find out where the missing 2007 winter volume was located.

While I agree that the years following 2007 have seen much higher gains, it is not so evident that there were much higher losses, at least from my graphs. The method I used is slightly different (a simple subtraction of min from max) but I don't see that as making any real difference.

I've reproduced the two melting and freezing graphs below, and marked the years involving 2007. What stands out is that the winter leading up to 2007 melting season was extremely sluggish - and that the refreeze following 2007 minimum was way above what had been seen before, and has stayed much higher since. This is all in agreement with what you, and others, have said.

But it isn't as clear that 2007 was a game changer when it comes to annual melt. Yes, there is more melt following 2007 but the difference isn't as radical and the linear trend seems to be a fairly good match for what happened both before and after 2007. Same can not be said for the refreeze graph.
because a thing is eloquently expressed it should not be taken to be as necessarily true
St. Augustine, Confessions V, 6

binntho

  • Nilas ice
  • Posts: 2228
    • View Profile
  • Liked: 888
  • Likes Given: 239
Re: Freeform season chatter and light commentary
« Reply #1680 on: September 09, 2023, 08:46:09 AM »
There are two main mechanisms at work in the Arctic, both to do with energy flows: The melting season, where ice melts due to input of energy, and the freezing season, where ice is regenerated do to loss of energy.

In the winter leading up to 2007, refreeze was very sluggish - less energy got out of the system, and less ice was generated. This was then followed by a normal melting season.

Almost the opposite happened in 2012 - a vigourous freezing season (second greatest volume generated) was followed by an extreme melting season (shared first place for greatest volume melted).  Similarly with 2010 - a decent freezing season (but not unusual in the post-2007 dataset, and matching 2023) was followed by an extreme melting season (shared first place for greatest volume melted).

So what happened in 2007 to cause this apparent stepwise change? Was it the very slow refreeze that kicked off a new regime in the arctic? Or to put it another way: Is the stepwise change due to a difference in what ice was created rather than in what ice was melted?

This actually seems to fit in very well with this oft repeated paper which claims that starting in 2005 and ending in 2007, production of deformed MYI (or what I have called MYIX) came to a halt in the Arctic. The reason for this shift was simply that the mechanical processes behind MYIX generation require a certain amount of extent to work. Once extent slipped below a certain threshold, MYIX generation ground to a halt. This is presumably what happened in 2007.

Sumata, H., de Steur, L., Divine, D.V. et al. Regime shift in Arctic Ocean sea ice thickness. Nature 615, 443–449 (2023).

To me this is important since the deformed MYIX was a form of ice that was very reluctant to melt out fully during melt season (extent wise - I think it lost volume at the same rate as other types of ice). Once MYIX was gone, larger extent could be melted every year and conversely, more open water resulted in the generation of more ice during refreeze season.
« Last Edit: September 09, 2023, 08:55:16 AM by binntho »
because a thing is eloquently expressed it should not be taken to be as necessarily true
St. Augustine, Confessions V, 6

binntho

  • Nilas ice
  • Posts: 2228
    • View Profile
  • Liked: 888
  • Likes Given: 239
Re: Freeform season chatter and light commentary
« Reply #1681 on: September 09, 2023, 08:49:50 AM »
To conclude - something happened in 2007, and what stands out is the extremely sluggish refreeze during winter 2006/2007. The causes of this sluggishness are probably a rare combination of random effects.

The stepwise change was caused by refreeze not creating enough extent for the generation of MYIX. This happened in the winter of 2006/2007 due to the slow refreeze, but would have happened anyway - all it needed was for winter extent to fall below the threshold necessary for the mechanic production of MYIX.

Finally, to answer Glen - I agree with you in general terms, but the science is not really ready to make any reliable predictions. The ice will disappear, and very likely in some big steps towards the end, but when that will happen is diffictult to tell.
because a thing is eloquently expressed it should not be taken to be as necessarily true
St. Augustine, Confessions V, 6

El Cid

  • Young ice
  • Posts: 2528
    • View Profile
  • Liked: 925
  • Likes Given: 227
Re: Freeform season chatter and light commentary
« Reply #1682 on: September 09, 2023, 11:01:41 AM »
And so, binntho is finally converted to the Slow Transition Theory which basically postulates that the loss of MYI results in much of the Arctic being transformed to FYI which melts out "easily" but then refreeze is fast -(March extent for the last years is almost the same as extent in the 80s/90s!! See chart: eg 2022 winter vs median of 1980-2010 winter sea ice extent) and this results in a new "equilibrium" (until a new shock happens)

I think the next step-change would come when the Barents/Kara and/or the Chukchi/Bering would not be able to freeze over during winter. Then it would be possible to melt out the so far always covered areas during August. It could possibly result in the breakdown of the halocline. Or maybe it would be the other way around: a random major melt year would melt out the Center and would not allow refreeze in the Barents and Bering regions and would create the next equilibrium

binntho

  • Nilas ice
  • Posts: 2228
    • View Profile
  • Liked: 888
  • Likes Given: 239
Re: Freeform season chatter and light commentary
« Reply #1683 on: September 09, 2023, 11:09:12 AM »
And so, binntho is finally converted to the Slow Transition Theory which basically postulates that the loss of MYI results in much of the Arctic being transformed to FYI which melts out "easily" but then refreeze is fast ...

When you put it like that, then yes I have been converted! But I am not sure I was ever entirely against this particular formulation, i.e. that loss of MYI has lead to more FYI which is easier to melt but also easier to regenerate. My personal bugbear had more to do with statements along the lines of "MYI melts faster" or "MYI is easier to melt" used to explain why MYI disappeared.

And thus, I would question that there is a "slow transition" at all. It is all just transition, moving in jumps and squirts, and the fact that more ice is generated / melted now does not mean that anything should slow down from how it was before.

And besides, how does the slow transition hypothesis explain the two hiati? (thanks Kassy) or the fast melt inbetween?
because a thing is eloquently expressed it should not be taken to be as necessarily true
St. Augustine, Confessions V, 6

El Cid

  • Young ice
  • Posts: 2528
    • View Profile
  • Liked: 925
  • Likes Given: 227
Re: Freeform season chatter and light commentary
« Reply #1684 on: September 09, 2023, 01:55:05 PM »

.....

And besides, how does the slow transition hypothesis explain the two hiati? (thanks Kassy) or the fast melt inbetween?

I don't think it needs to explain everything. To me, the Slow Transition Theory is a good explanation of why we have seen quite little trend in summer extent lately. Also, it shows that many of these natural systems are not linear and changes often happen stepwise (when somehing changes due to a confluence of processes  - often random - then that change could become self-reinforcing, so the system remains in a new state). That is why it is impossible (see forecasts on this site and even  "serious" studies after the 2007 or 2012 event) to simply linearly extrapolate ice losses and forecast the much expected BOE.

I have absolutely no idea when a BOE will happen but I also think that noone else does due to the above...

kassy

  • First-year ice
  • Posts: 8464
    • View Profile
  • Liked: 2057
  • Likes Given: 1996
Re: Freeform season chatter and light commentary
« Reply #1685 on: September 09, 2023, 02:37:54 PM »
The slow transition does not really explain those. It just says that refreeze will slow things down because open water refreezes.

So it became a factor when we lost that old thick ice because the process making it failed which then allowed for some big ice losses mainly in volume which then also translated to the other metrics. The thick ice was a sturdier backbone until it failed. Now we can still see some sort of back bone in the thick 2M ice going around in the pack but it is slowly fading.

Historically there are very different inputs which really complicates things. Back in the day rain on ice was not a big thing or atmospheric rivers dumping rain in the arctic but we know that it is happening now. We have no idea how that will grow in the near future. Other things that changed since the original formulation of the theory is us cleaning up shipping which increases overall warming and a methane feedback from non arctic areas doing the same.

The slow transition would also only give us only so much years. About 10 to 15 i think so we are coming to the end of that.
 

Þetta minnismerki er til vitnis um að við vitum hvað er að gerast og hvað þarf að gera. Aðeins þú veist hvort við gerðum eitthvað.

gerontocrat

  • Multi-year ice
  • Posts: 20817
    • View Profile
  • Liked: 5312
  • Likes Given: 69
Re: Freeform season chatter and light commentary
« Reply #1686 on: September 09, 2023, 03:41:31 PM »
When you look at average daily ice area (or extent) throughout the year, you get a graph with an R2 value of 89%. Most of the 2012 brief summer event disappears.

The previous two years show the La Nina effect, which due to (in my view) the teleconnectiion lag has only switched to an El Nino effect on the current year recently. My guess is that 2024 will see average sea ice bang on the linear trend or even below.

So I am content to stick with the linear trend for the time being though looking out for more chaotic data as climate and weather inexorably moves into a High Energy state where all bets are off (except it is safe to say that many of the surprises will be nasty).
"Para a Causa do Povo a Luta Continua!"
"And that's all I'm going to say about that". Forrest Gump
"Damn, I wanted to see what happened next" (Epitaph)

binntho

  • Nilas ice
  • Posts: 2228
    • View Profile
  • Liked: 888
  • Likes Given: 239
Re: Freeform season chatter and light commentary
« Reply #1687 on: September 09, 2023, 04:02:30 PM »
Thanks for that Gero I was just thinking to do an area graph, but you beat me to it and made it much better as well!

Wherever we look we try to find patterns that tell us about significant phase changes in the underlying processes. But mostly these can be explained as random noise in a very complex system, both from a statistical point of view and no less from the lack of quantifiable effects point of view.

The only real stepwise change that can be teased out of the graphs seems to be the 2007 transition into much higher annual refreeze, and the concomitant (but perhaps slower to catch up, if we take the holy waters of the slow transition) annual melt.

Whether the approaching ultra-mega-El Nino (even the kids are getting fatter!) will show in the graphs time will tell, but I agree with Gero that these extremes in the ENSO are very likely to show up in the Arctic.
because a thing is eloquently expressed it should not be taken to be as necessarily true
St. Augustine, Confessions V, 6

El Cid

  • Young ice
  • Posts: 2528
    • View Profile
  • Liked: 925
  • Likes Given: 227
Re: Freeform season chatter and light commentary
« Reply #1688 on: September 09, 2023, 05:04:24 PM »

....

Whether the approaching ultra-mega-El Nino (even the kids are getting fatter!) will show in the graphs time will tell, but I agree with Gero that these extremes in the ENSO are very likely to show up in the Arctic.

That seems very likely. Extreme heat in the oceans and land will probably hasten the BOE. This El Nino seems to be on its way to be really strong. We could call him "Arnold" :)

uniquorn

  • First-year ice
  • Posts: 5159
    • View Profile
  • Liked: 2189
  • Likes Given: 388
Re: Freeform season chatter and light commentary
« Reply #1689 on: September 10, 2023, 12:51:24 AM »
Maybe some shapes will help discussion of the lines.

sea ice age, early sept, 1984-2023

oren

  • Moderator
  • First-year ice
  • Posts: 9822
    • View Profile
  • Liked: 3590
  • Likes Given: 3969
Re: Freeform season chatter and light commentary
« Reply #1690 on: September 10, 2023, 01:26:12 AM »
Thanks for this, uniquorn.
I recently tried to look for these graphics and couldn't find them easily. Is there a link for the sea ice age product that does not require a login?

binntho

  • Nilas ice
  • Posts: 2228
    • View Profile
  • Liked: 888
  • Likes Given: 239
Re: Freeform season chatter and light commentary
« Reply #1691 on: September 10, 2023, 10:40:09 AM »
Maybe some shapes will help discussion of the lines.

sea ice age, early sept, 1984-2023

That is incredible ... we have certainly come a long way from that!
« Last Edit: September 10, 2023, 10:51:05 AM by binntho »
because a thing is eloquently expressed it should not be taken to be as necessarily true
St. Augustine, Confessions V, 6

Darvince

  • Frazil ice
  • Posts: 318
    • View Profile
  • Liked: 31
  • Likes Given: 7
Re: Freeform season chatter and light commentary
« Reply #1692 on: September 10, 2023, 12:48:17 PM »
Not sure where to put this, but I decided to verify my predictions from 2020:
Exactly November 15th is when ice growth filled in the last of the Laptev with ice extent. I guess the 1C-per-week after minimum rule of thumb I was using works very well for areas more secluded from storm activity and currents.

Extending it to other places, the Hudson should be fully frozen over between December 15th to 20th (although this might be sooner since it's so shallow in the areas that are at or above 2C right now), and the Okhotsk should start genuinely forming ice around December 5th.
Complete Hudson Bay freezeover happened on December 24th, and 'genuinely forming ice' for the Okhotsk, however you interpret that, happened some time between December 6th (ice starts forming in an open water area) and December 15th-17th (large areas in the northwest Okhotsk freezing over). It's hard to rate the Okhotsk prediction since it was qualitative. I underestimated how long ice formation would take for both seas, maybe because they're lower latitude and so have more warm intrusions?

JAXA's December 6th, 16th, and 24th of 2020 are attached.

uniquorn

  • First-year ice
  • Posts: 5159
    • View Profile
  • Liked: 2189
  • Likes Given: 388
Re: Freeform season chatter and light commentary
« Reply #1693 on: September 10, 2023, 08:25:40 PM »
Thanks for this, uniquorn.
I recently tried to look for these graphics and couldn't find them easily. Is there a link for the sea ice age product that does not require a login?

Not that I know of, there may be some old ftp servers still running somewhere.

Using EOSDIS Earthdata Login:
https://daacdata.apps.nsidc.org/pub/DATASETS/nsidc0749_ql_iceage/  nrt quicklook data
https://daacdata.apps.nsidc.org/pub/DATASETS/nsidc0611_seaice_age_v4/browse/  archive 1984-2022

There is a different version from NOAA that doesn't require login, runs from 2000-2023
https://www.climate.gov/data/IceSnow--Weekly--Sea-Ice-Age--Arctic/
It had some glitches last time I looked.

oren

  • Moderator
  • First-year ice
  • Posts: 9822
    • View Profile
  • Liked: 3590
  • Likes Given: 3969
Re: Freeform season chatter and light commentary
« Reply #1694 on: September 10, 2023, 08:30:56 PM »
Thanks a lot, I'll try the login version when I find the time.

John_the_Younger

  • Frazil ice
  • Posts: 440
    • View Profile
  • Liked: 65
  • Likes Given: 139
Re: Freeform season chatter and light commentary
« Reply #1695 on: September 11, 2023, 08:42:05 PM »
2023 on track to be world's hottest year on record, temperatures exceed 1.5C above pre-industrial levels for first time
...
This is the first time the 1.5C threshold has been passed for more than one month, and only the second time it has ever been exceeded, behind February 2016.

Data released last week from Copernicus, a branch of the European Union Space Programme, shows August was 1.59C warmer than 1850-1900 levels, following a 1.6C increase in July.

The recent records have now lifted the year-to-date global temperature to the end of August to 1.35C above pre-industrial levels, just 0.01C behind 2016 — the current record holder, according to Copernicus data.

...

Watershed year in Earth's climate history
It's not just air temperatures at unprecedented levels this year.

Major global climatological records have fallen at a rapid rate across the Earth's atmosphere, hydrosphere and cryosphere, including:

Record-high monthly air temperatures in June, July and August
All-time record daily air temperature, passing 17C for the first time
Record-low Antarctic sea ice in May, June, July and August
Record-high monthly ocean temperatures in April, May, June, July and August
All-time record daily ocean temperature, passing 21C for the first time
...
Lets see how that develops from now on.
I'm once again reminded of some song lyrics:
Quote
One and one and fifty make a million
It's more than "exponential" - it's "tipping point" or "100th monkey phenomenon" [I know, the data that gave the moniker was fudged.] - sometimes realized as "war hysteria" [I recall reading about a survey in NZ before WW1 where the vast majority of Kiwis wouldn't fight unless NZ was actually invaded, then they joined up in great numbers weeks later.]

Quote
First they came for with the socialists monthly records, and I did not speak out—
     Because I was not a socialist monthly records didn't count.

binntho

  • Nilas ice
  • Posts: 2228
    • View Profile
  • Liked: 888
  • Likes Given: 239
Re: Freeform season chatter and light commentary
« Reply #1696 on: September 13, 2023, 07:05:15 AM »
PIOMAS website estimates that the average Ice Volume is dropping by 280 km3/year. In a discussion on their website, under the heading of "Perspective: Ice Loss and Energy", they point out that the extra energy input needed per year to melt an extra 280km3 is simlar to a very small and dim flashlight when spread over the entire Arctic.

This is an interesting point and relates to Glen's musings in another thread. I myself had been thinking along similar lines, e.g. with the two graphs shown below (annual refreeze and annual melt) - you would never guess that the total amount of ice was actually decreasing just from looking at these graphs!

The difference in scale between annual melt / refreeze on the one hand, and the annual trend on the other, is very big. Every year, more than 18.000 km3 of ice is generated and melted. The trend of 280 km3 per year is two orders of magnitude smaller. The jump in annual refreeze after 2007 is around 2000 km3, an order of magnitude bigger than the annual trend.

This simply means that any graph that focuses on total annual freeze and melt totally swamps the annual trend. We have to look at the long-term, e.g. 43 years at 280 km3/year is over  12.000 km3 of ice permanently lost. When you compare this with the annual refreeze of 18.000 km3, things certainly start to look interesting!
because a thing is eloquently expressed it should not be taken to be as necessarily true
St. Augustine, Confessions V, 6

Glen Koehler

  • Grease ice
  • Posts: 934
    • View Profile
  • Liked: 742
  • Likes Given: 1418
Re: Freeform season chatter and light commentary
« Reply #1697 on: September 13, 2023, 03:14:00 PM »
Orginally posted in 2023 data thread, moved here to maintain the data thread integrity.
NSIDC  ARCTIC SEA ICE AREA (5-day trailing average):

Here are some graphs looking at trends in total freeze and total melt.

2023 melt is dead on the linear trend that has an R2 value of 55%.
Both melt and freeze are increasing by an average of just under 40,000 km2 per year, around 1.5 million km2 since 1979 (1st graph).  Thinner ice as the years go by?

The X-Y graphs show a higher correlation between melt and the following freeze (R2=79%) than between freeze and the following melt (R2=56%). Don't ask me if that means anything
    I may be missing the obvious, but all of the melt vs. refreeze charts show both lines overlapping since 1979 with nearly identical amounts per year for each and matching trends.  How is that possible given that half of the Extent and Area, and 3/4 of the Volume have been lost since satellite observations began in 1979?
    Example: Gero's chart below
« Last Edit: September 13, 2023, 03:21:01 PM by Glen Koehler »
“What is at stake.... Everything, I would say." ~ Julienne Stroeve

gerontocrat

  • Multi-year ice
  • Posts: 20817
    • View Profile
  • Liked: 5312
  • Likes Given: 69
Re: Freeform season chatter and light commentary
« Reply #1698 on: September 13, 2023, 03:59:17 PM »
Hullo Glen

Have a look at this posting by Renerpho about my melting freezing graphs - a minuscule difference on my graphs makes a big difference in maxima and minima over time.
« Last Edit: September 14, 2023, 11:40:08 PM by gerontocrat »
"Para a Causa do Povo a Luta Continua!"
"And that's all I'm going to say about that". Forrest Gump
"Damn, I wanted to see what happened next" (Epitaph)

Glen Koehler

  • Grease ice
  • Posts: 934
    • View Profile
  • Liked: 742
  • Likes Given: 1418
Re: Freeform season chatter and light commentary
« Reply #1699 on: September 13, 2023, 04:52:20 PM »
     Thanks, I see it now. 
“What is at stake.... Everything, I would say." ~ Julienne Stroeve