No folks, I haven't gone away. Just been overwhelmed with other events. Although, I've been lurking here as often as possible.
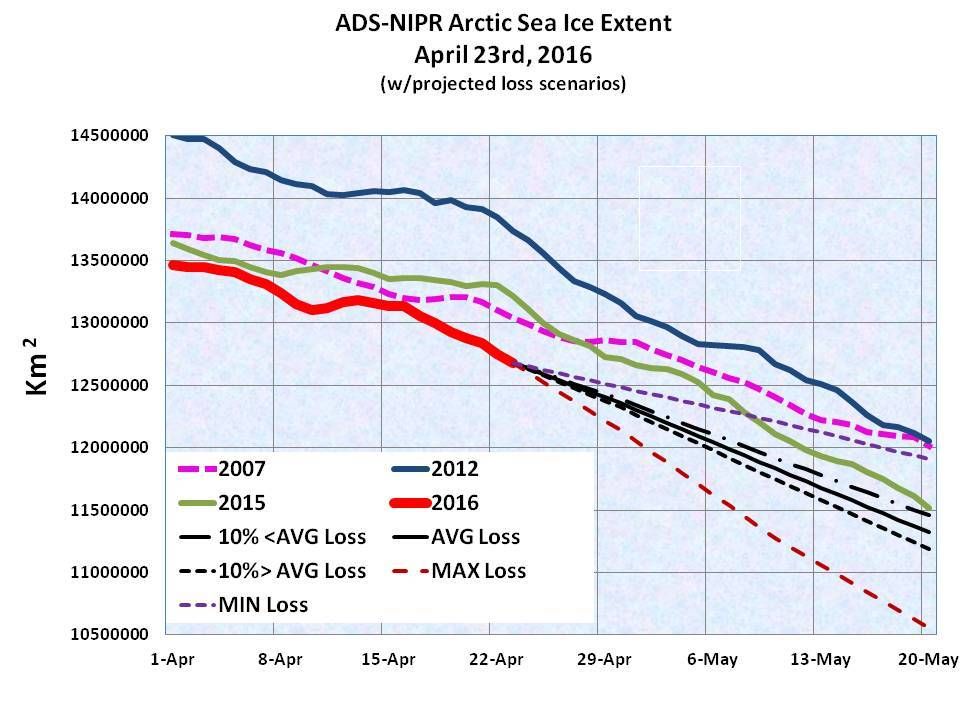
I've finally had the time to put my simplistic model together with simple near-term projections. The only change from last year's version is that I'm using 10 or 11 day bins each month to calculate the average and record losses for each month, based on years 2003 - 2015 as opposed to two monthly bins of 15 or 16 days each.
As of today, if 2016 follows a path of losses 10% greater average, on September 10th the SIE would be
3,383,175 Km2, which would be just over
100K above 2012 for that date.
The next 5-6 weeks are critical for any number of reasons. As memory serves me, peak insolation covers a 6-8 week window about the summer solstice. Therefore the less ice in late May means that there is more open water to absorb the solar heat.
It will be interesting to see if SIE drops below
11M Km2 by the 20th of May. If that were to occur and there is significant meltponding in May, it would almost certainly set the stage for a record breaking year.
I'll try to keep this chart updated regularly for the next few weeks, then I'm off to Italy and Croatia for a month. While travelling, I'll be forced to clumsily use my wife's tablet to access the internet.
