And now on topic. I have been seeing claims that "solar TSI has been sub-normal for 12(+?) years (including 3+ years of TSI setting a 100 year record low)".
I know nothing of the subject at hand, but a quick google search found a chart for sunspots, and a chart for Total Solar Irradiance or TSI, and they seem to correlate but nor equate.
Definition from Wikipedia: Steve already beat me to it...
A measurement of TSI by the SORCE mission, starting in mid-2003.

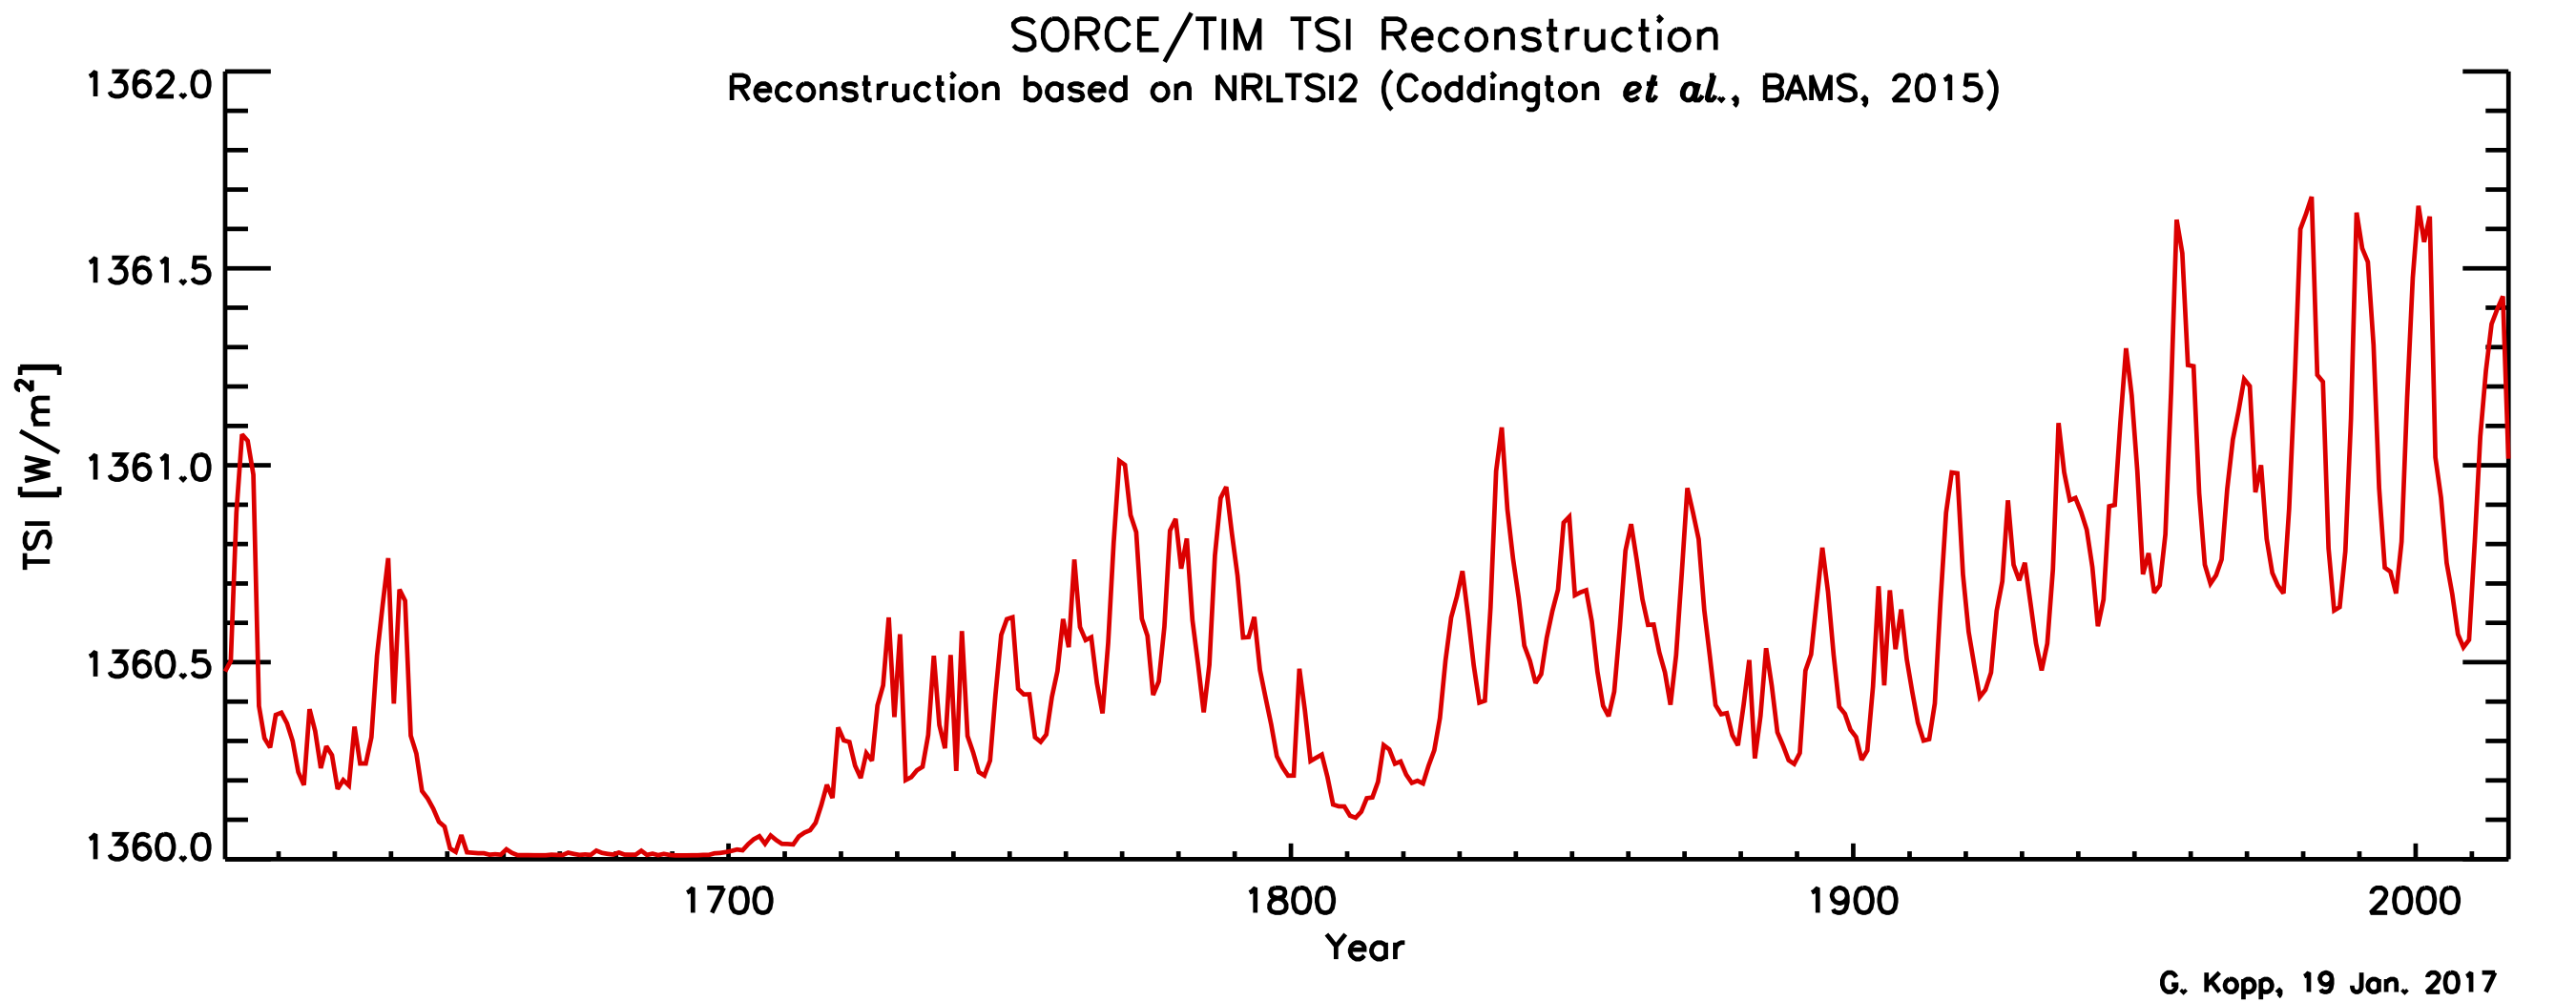
A historical reconstruction of TSI.

Both charts don't seem to support the claim quoted above. The 2015 peak has been above the 2004 peak in the first chart, and the overall TSI seems to be higher than it was 100 years ago. But maybe I misunderstood the specific claim.
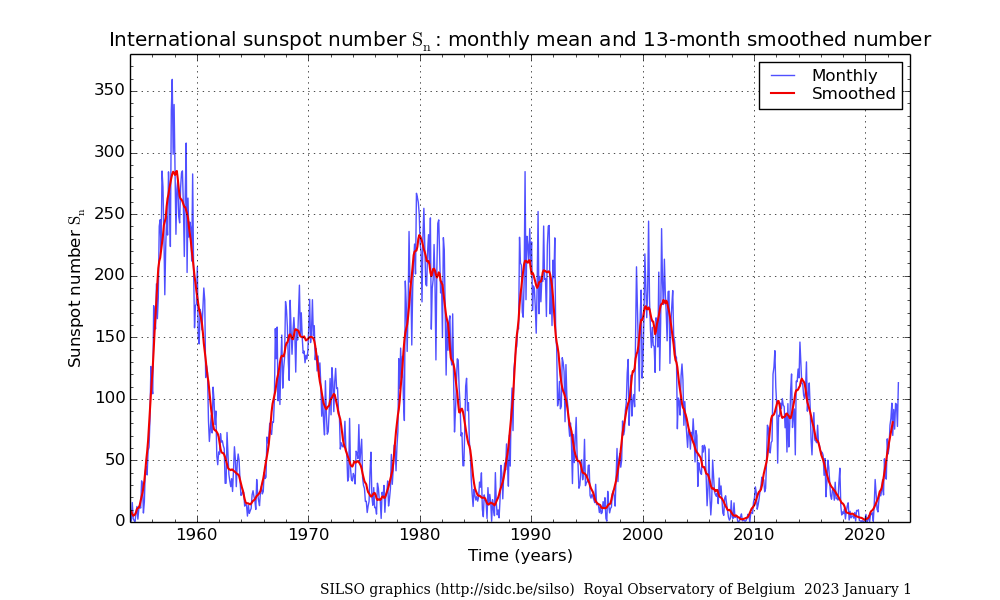
A historical sunspot activity chart.

So the way I see it, sunspot activity has been very low during the last cycle, but TSI has not been very low compared to the previous cycle.
Now maybe this properly belongs in the stupid questions thread, but - what am I missing?
