Thanks pccp82.
My bad. The image I had in mind was August 6, 2012.
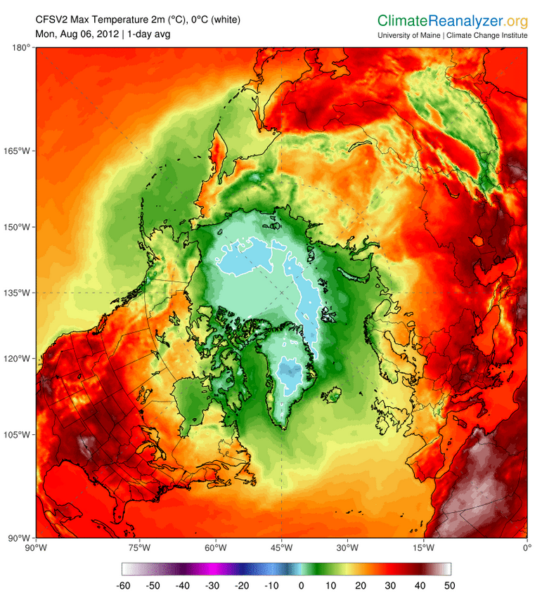
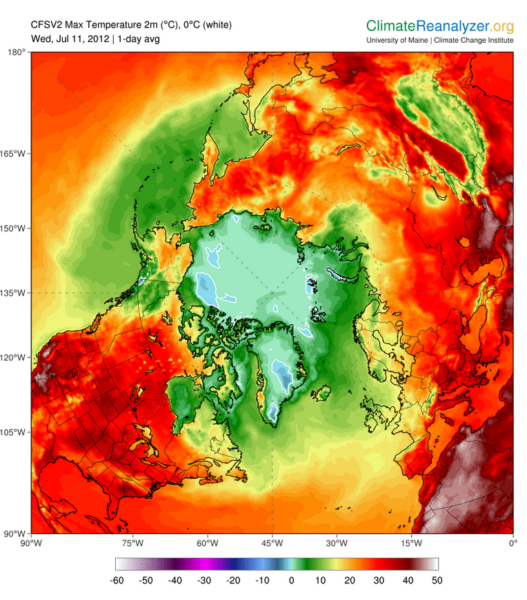
I guess at that point we were discussing the Great Arctic Cyclone of 2012, and I confused that with the great GIS melt day of July 11, 2012.
Looking at that same view for dates on either side of either event, or July-Aug dates in other years, gives some perspective for how out of bounds both events were. For example the July 21, 2018 image seems to be typical for recent dates in July-August:
Trying to save face, I went looking for the average 2meter max temp. forecast for Greenland over the next 3, 5 and 10 days
https://climatereanalyzer.org/wx/fcst_outlook/,
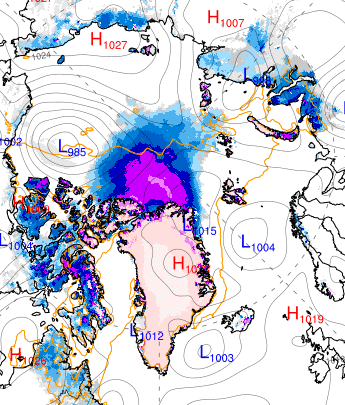
but those are now not showing anywhere near the extent of GIS surface melt shown in the 2012 images. Update-as of June 9, GFS forecast on Climate Reanalyer shows majority of GIS above freezing on June 13, not too far behind extensive and record breaking surface melt events on July 11 and August 6, 2012.
While the updated hourly forecasts have no shortage of positive 2M temp anomalies for Greenland over the next 10 days, the max temp hourly forecast also indicates that the area of GIS surface melt next week won't be anywhere close to the July 11 and August 6, 2012 images. So either I just blew it with respect to Greenland surface melt coming next week, or the 10-day outlook changed. ***My mistake in previous post was misunderstanding that the 10-day Greenland surface temp reading was not the average for a 10-day period, but the average of hourly values for the 10th day, i.e. a single day reading not a 10-day average. As noted above, updated forecast shows that June 13 (which was the 10th day noted in original post) is forecast to have an extent of surface melt similar to record-setting events in 2012.
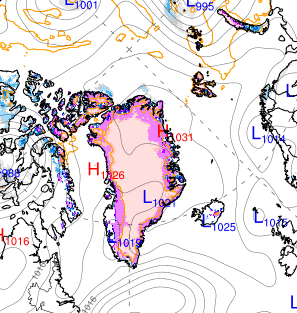
That said, the current hourly forecasts still shows the high precipitable water, the persistent crazy high temp. anomalies stretching across long arc of northern Siberia, and for much of the forecast period, also on the North American side. The forecast shows snow cover depth north of Greenland essentially gone by June 10 2019 (scale is cm).

vs. June 10 in 2018.
It took until June 22, 2018 for snow depth image to match the June 10, 2019 forecast. While that does not seem like a cataclysmic difference to my untrained eye, a 12 day earlier loss of snow cover with the sun at near maximum height, combined with many blue sky hours also in the forecast, does seem notable in terms of insolation.
Enough covering my tracks. What I definitely did get right and did not exaggerate was an Arctic weather expert ringing the alarm bell about the forecast as it appeared at that time, and the Arctic sea ice situation overall. Vote climate.


