First of all, happy new year @ all
Nxt Part, SMOS at Melt-Saison:
First some notes:
1) SIT below 5cm is cut out, because there sometimes errors in the mapping at these low SIT
2) Its from 15. Apr to 1.09 Sep 2011-2019
3) SIT= Sea Ice Thickness
4) SIE = Sea Ice Extent
Some claims:
As often told, SMOS is not a physical use of SIT in the melt saison because of melt ponds cause interference which indicate the ice is very low in thickness, on the other hand, we can use this to claim, if SMOS SIT is very low at the begin of melt saison, its build up very much melt power, in other words, it preconditioning the outcome to september SIE.
Thats what i think i found in my analysis.. anyway some figures:
2019,2012 vs mean 2011-2018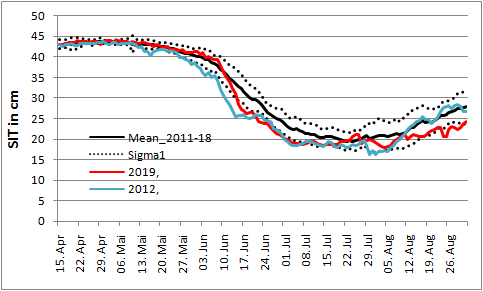 Scattern Plot SMOS SIT(1.06 bis 15.07) vs. SIT (NSIDC September)
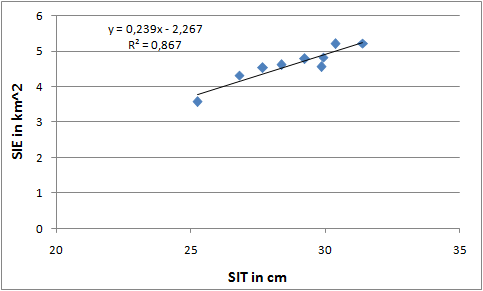
One more thing: If correlation is used for SMOS SIT after 15.07 the correlation gets near to 0 which also would imply the claims above


