I thought it would be a good idea to elaborate a bit on my amateur concept ‘winter power’ here.
After three days of flu I’ve been puzzling a bit on CAD to produce the map above.
First, I use the term ‘winter power’ somewhat in line with the ‘Hellman-mark’, used to give an inter-annual comparability on severeness of winter. The Hellman-mark is built up by the cumulation of all below-zero daily means during the winter season.
In that line, I used NCEP/NCAR to get something similar for the temperature anomaly over the whole Arctic. The method can only be used to compare different winters. It gives no information on specific anomalous periods in a single season.
But geographically, some interesting features can be scrutinized.
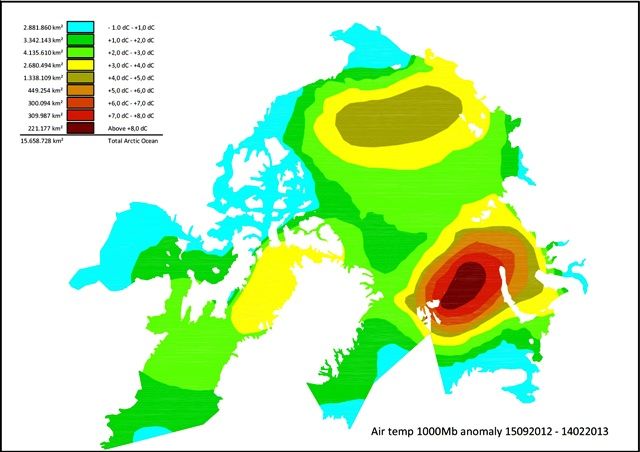
Up to 14 February, the mean anomaly over the Arctic Ocean was +2.5 dC. That’s quite high, though I have not taken time to check more winters.
The large +4dC area over the Bering side is due to late refreeze during Sep and Oct and the anomalous persistent high through Jan. That high was filled with unusually warm air, connected to the Sudden Stratospheric Warming event.
The +8dC area centered on the Olga Strait, northern Barentsz Sea indicates continued, anomalous lack of sea ice. It allows constant warmth release from the top ocean water layer.
The +3dC area in the Baffin Bay tells something about the state of sea ice there…
I rounded up these images for some background:
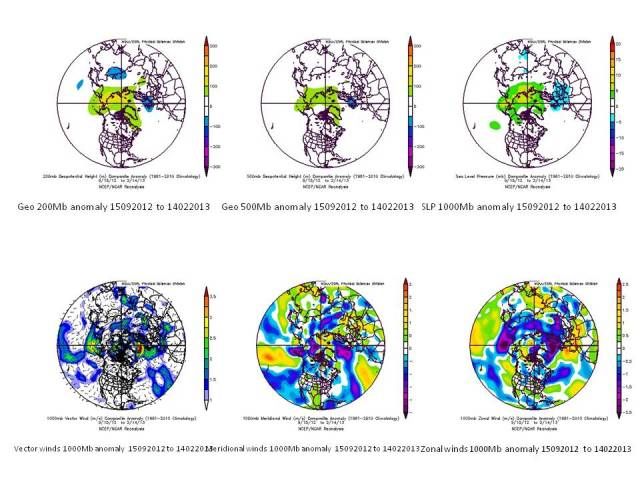
The 200, 500Mb and SLP anomalies make clear why the air temperature anomaly ‘is what it is’. The whole Polar cell has been anomalously thick all winter. It had its main positive anomaly over the Laptev Sea. The main negative anomaly has been over the North Sea in Europe.
The whole set-up is AO-negative, leading to constant anomalies against the climatic westerly wind pattern.
So far, this winter produces along clear regional specifics, well in line with the general AGW trend.


