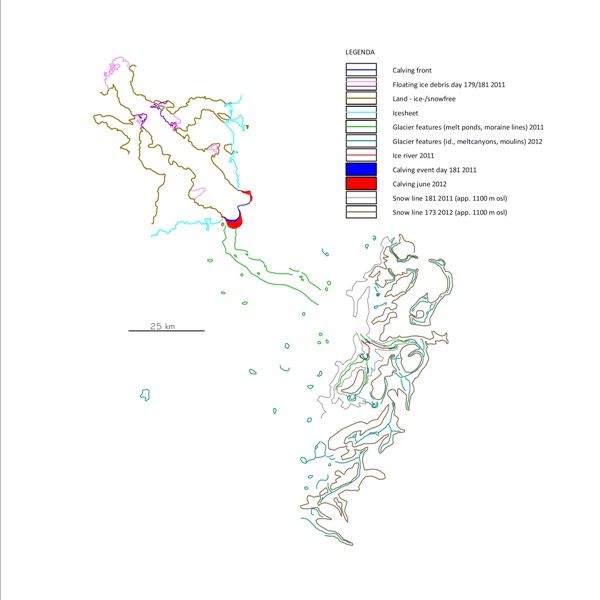
I placed the above map made June 2012 again, as a test and because it corresponds with a recently released paper on meltwater lakes:
http://www.the-cryosphere.net/7/201/2013/tc-7-201-2013.htmlContinuing, here's my take on the NEEM ice core results…
On the info I’ve taken in so far (definitely not very much), I’m not too impressed. The initial conclusion is that through the Eemian the GIS contribution to SLR was 2 m as maximum. From that, it is assumed that most of the present ice-covered area was covered through the Eemian too.
This fits the markings I’ve made in my thinking for this century. The GIS will loose mass in a continuous geometric progression up to 2050, when the stage is reached as the southern tip of the island has lost a considerable amount of vulnerable ice. SL should be about 50cm up then, imagine 15 cm in ten years soon enough, more than 4000 km3 yearly.
Later this century shedding from the large, northern part of the GIS will come in progressively. I have read remarks lately that the 79/Zachariae NE part could be in a lot sooner. Such developments could worsen the picture.
I have assumed the Antarctic to line up considerably later.
All in, the forecast made by Rahmstorf is what I expect, 1-1,5 m SLR up to 2100.
The part where Eemian comparisons get irrelevant (if it is relevant at all…) is beyond 2100.
To my amateur knowledge, an interglacial warm period about 30K years long won’t reproduce exactly the same physical response in the current, fossil fuel initiated forcing blip of time.
It can give clues on individual processes, yes. But we can’t afford to assume the result of 6K years during the last Interglacial in a restricted area of Greenland will be repeated under present conditions.


