Linked to these developments by the Russians is of course their ongoing search for hydrocarbon deposits along the Arctic shore and in the Arctic ocean itself.
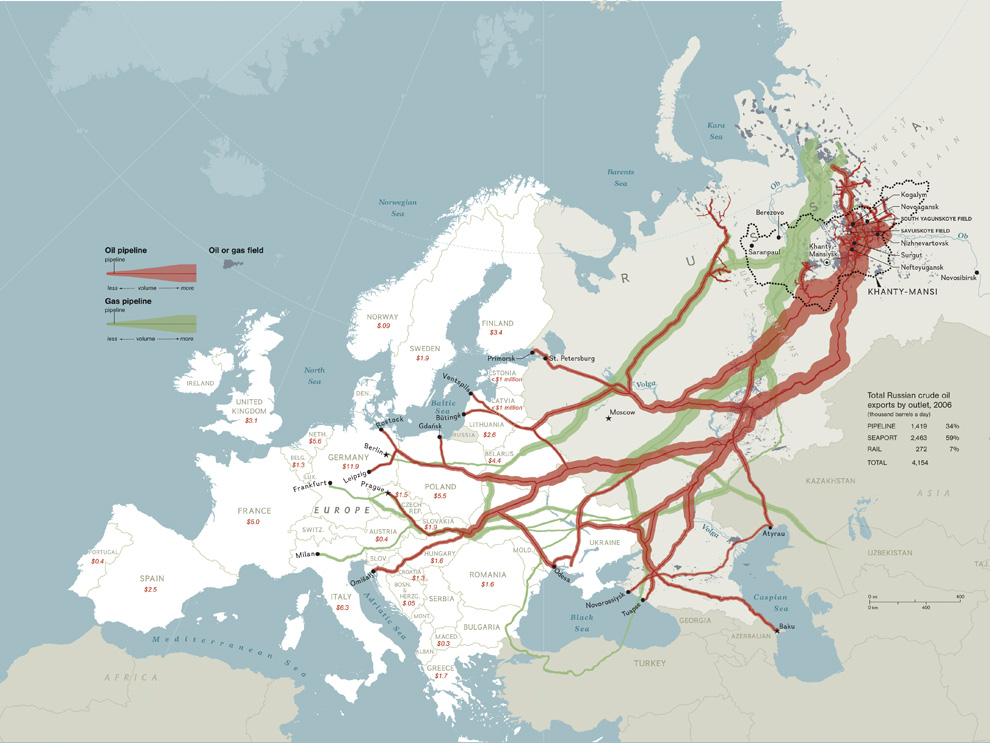
Most Russian oil has traditionally been found in Western Siberia, between the Urals and the Yenisey, in a geological structure called the West Siberian Sediment Basin. It is from here that pipelines head to Europe, as shown in this image from National Geographic
In East Siberia, the main geological feature is the Siberian Platform which has traditionally been thought far less likely to contain hydrocarbons, but the discovery of three mega carst structures lead to epxloratory drillings several years ago, and claims of vast reserves have been made. Oil and gas production has already started in this area, between the Yenisei and Lena rivers, but it is still far less well connected to the pipeline network, although new pipes have been laid that connect to the European markets, but mainly to mainland China and the Sea of Japan.
The image below shows how the oil-rich West Siberian Sediment basin stretches into the Arctic, and connects to the Yenisey-Katanga depression which also stretches into the Arctic. Geologically these areas are very likely to contain large reservers of hydrocarbons (from
Petroleum Potential in the East Siberian Region, Keishi Nakashima 2004)

And the Russians have already started exploratory drilling in the Arctic, see for example this article from 2021,
A major oil exploration is going on in Russia's East Arctic waters.
Several survey vessels are mapping the petroleum potential of the Laptev Sea and a drillship is on its way to spud the first ever wells in the area.
I've never heard of "to spud wells" but apparently this is common oilman jargon for exploratory drilling.
The Bavenit on the 22nd of August set out from Murmansk with course for remote east Arctic waters. The ship, one of Russia’s most advanced vessels of the kind, is due to drill the first ever wells in the Laptev Sea.
According to Rosneft, there has never before been drilled a well in the shallow waters of the area. Drill cores from several wells will now help create a geological model of the region and determine the oil and gas potential, the company informs.
This is all very interesting, and should wake us up to the fact that the Russians are, for better or worse, rapidly industrializing their part of the Arctic, much faster and with far greater impact than the rest of the world seems to realize.


