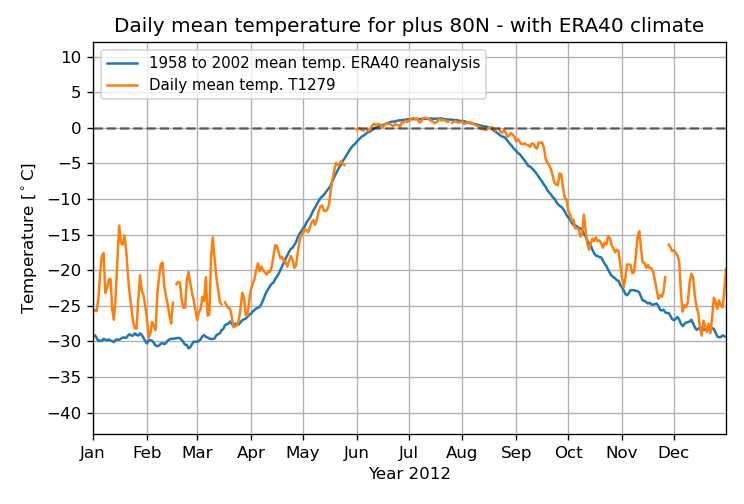
Below is the 2012 chart missing from Uniquorn's very informative 2000 - 2024 animation.

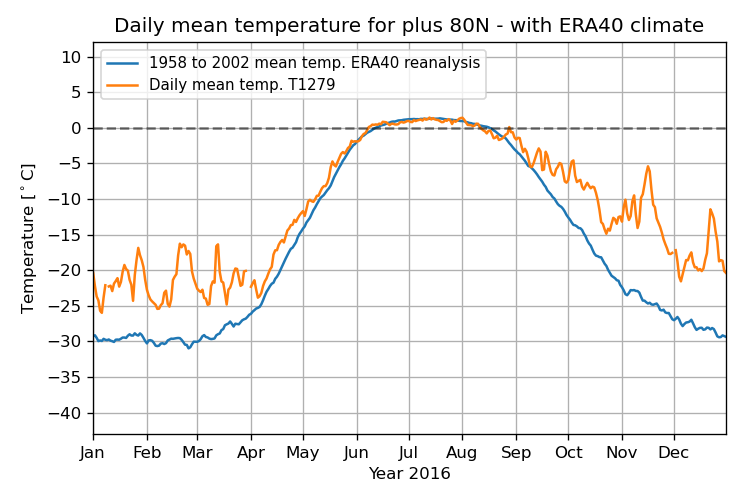
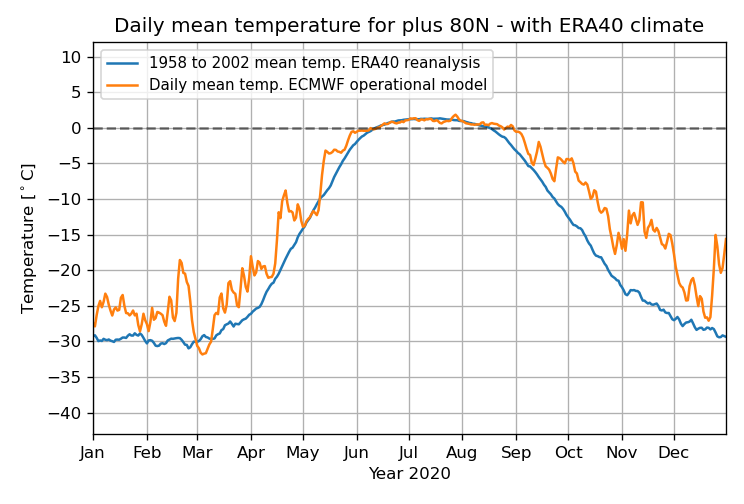
Comparing across the full 1958-2024 duration of DMI 80N charts (vs. the 1958-2002 average), the average DMI 80N value in September 2024 was similar to previous warmest September years (e.g. 2006, 2007, 2012, 2016, 2019, 2020, 2021, 2023).
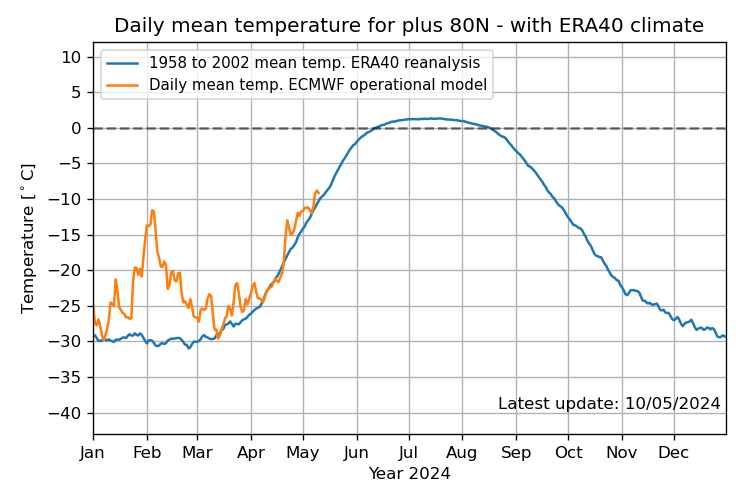
The October anomaly in 2016, 2018, and 2020 started higher than October 2024, but in those years the DMI 80N temperature fell after mid-month, whereas in 2024 they continued to fluctuate between -7 to -10C. For October as a whole, there appears to be no precedent for the DMI 80N warm anomaly, i.e. it appears to be a new record warm for that measure.
Moving on to November, 2016 and 2020 are the highest years for DMI 80N warm anomaly. Despite the recent drop to ca. -14, early indication from Nov. 2024 suggests that so far it is close enough to 2016 and 2020 (which both averaged around -13 to -14 for Nov.) to challenge them for the warmest November DMI 80N anomaly. But there are only a few Nov. 2024 observations making it too early to even guess at the final Nov. 2024 average.


The 10-day GFS Arctic 2M temperature anomaly forecast shows a mix of areas above and below the 1979-2000 baseline. After a mixed start, the last 5 days of the 10-day GFS forecast shows very warm temperature anomaly for the CAA for November 16-20. It will be interesting to see if that shows up as record-low values for those dates in the CAA ASI Extent/Area/Volume reports.

-------------------------------
Globally (not just Arctic), the Copernicus (ECMWF) global average temperature report has October 2024 as the second warmest in the records, only topped by October 2023. Because of the warm October 2024, the Jan.-Dec. global average temperature (from Copernicus, NASA, NOAA, Hadley/UAE, and Berkeley Earth) for 2024 is now virtually certain to set a new record at ca. +1.54 C (+/- 0.04 C) over the preindustrial average, topping the previous record (2023) of +1.48C.
Multiple estimates for the global avg. surface temperature anomaly (GSTA) at which September ASI Area has about a 50:50 chance of being below 1M km2 have converged on +1.7 C. That anomaly is also the point at which multiple studies have estimated that Greenland ice sheet melt becomes self-sustaining due to elevation loss creating a reinforcing feedback.
The decadal rate of GSTA change since 1970 to ca. 2010 was about 0.2 C per decade. But since 2010 appears to have increased to 0.3 C. While that is too short a time to confirm a decadal rate, that increase in warming rate is consistent with calculations by Hansen et al. At a 0.3 C / decade rate, if the GAST is truly at 1.5 C without a temporary El Nino boost (which appears to be the case, will skip the details to keep this from getting longer), then in about 6 - 7 years (2030-2031) w the GAST anomaly would reach +1.7 C. This is earlier than the year at which most climate model estimates show a 50% chance of an Arctic BOE.
https://interactive.carbonbrief.org/state-of-the-climate/24-Q3/projections.htmlhttps://www.carbonbrief.org/state-of-the-climate-2024-will-be-first-year-above-1-5c-of-global-warming/