Copernicus: June 2024 Marks 12th Month of Global Temperature Reaching 1.5°C Above Pre-Industrial https://climate.copernicus.eu/copernicus-june-2024-marks-12th-month-global-temperature-reaching-15degc-above-pre-industrial
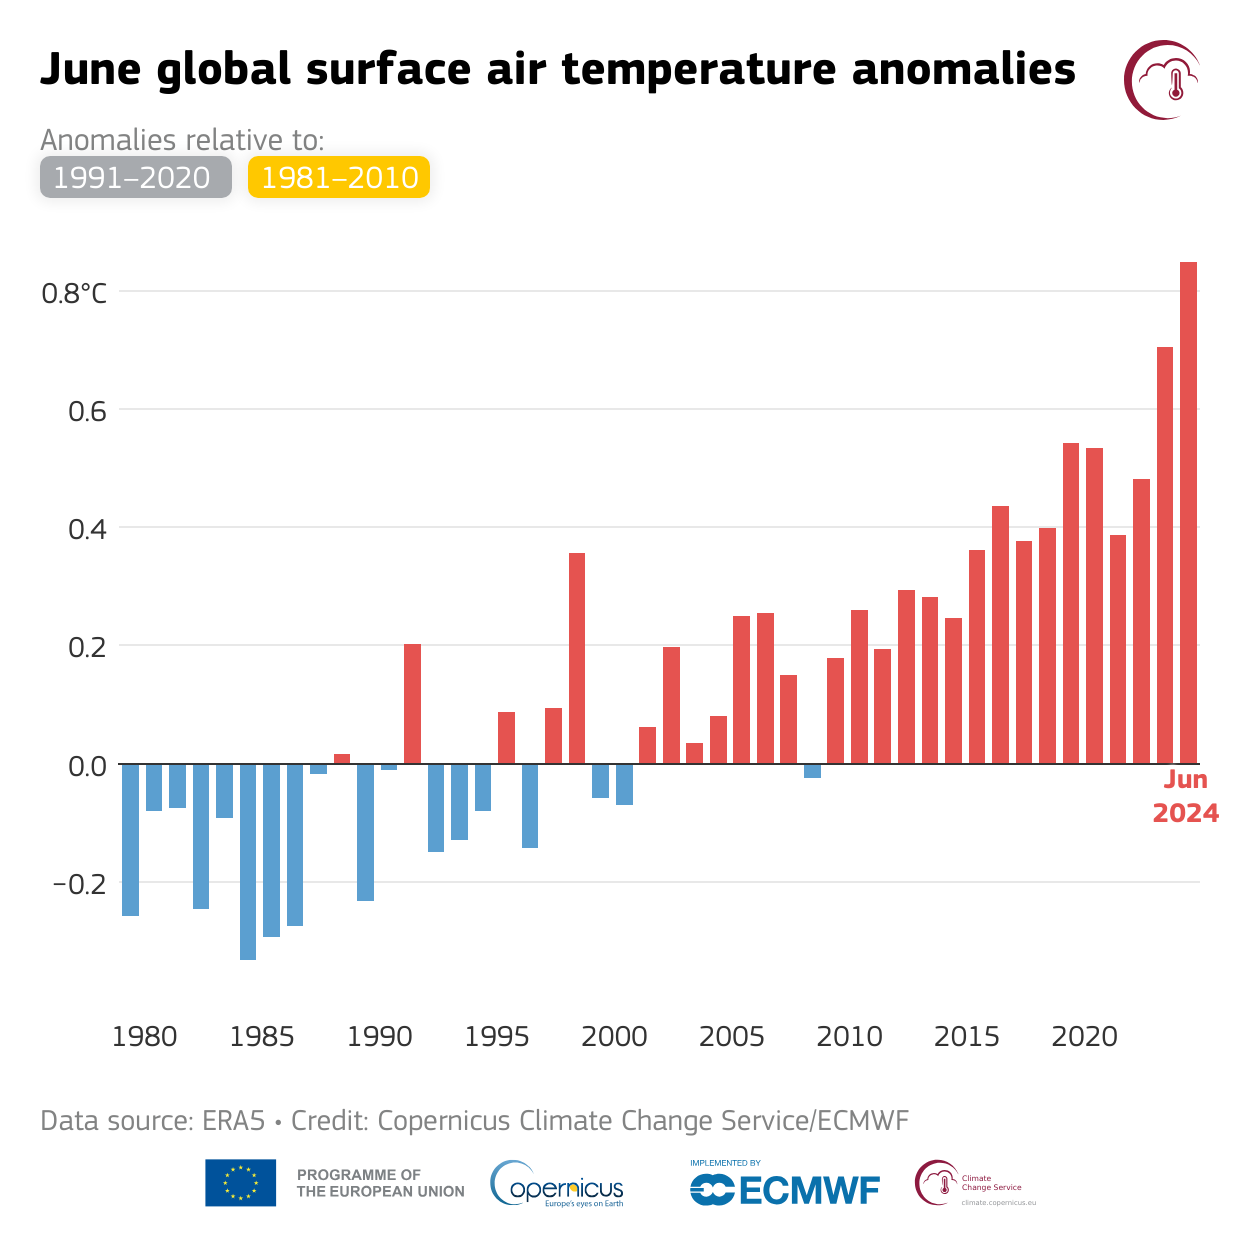
June 2024 was warmer globally than any previous June in the data record, with an average ERA5 surface air temperature of 16.66°C, 0.67°C above the 1991-2020 average for June and 0.14°C above the previous high set in June 2023.
This is the thirteenth month in a row that is the warmest in the ERA5 data record for the respective month of the year. While unusual, a similar streak of monthly global temperature records happened previously in 2015/2016.
According to ERA5 data, the month was 1.50°C above the estimated June average for 1850-1900, the designated pre-industrial reference period, making it the twelfth consecutive month to reach or break the 1.5°C threshold.
The global-average temperature for the past 12 months (July 2023 – June 2024) is the highest on record, at 0.76°C above the 1991-2020 average and 1.64°C above the 1850-1900 pre-industrial average.
The average European temperature for June 2024 was 1.57°C above the 1991-2020 average for June, making the month the joint-second warmest June on record for Europe.
Outside Europe, temperatures were most above average over eastern Canada, the western United States and Mexico, Brazil, northern Siberia, the Middle East, northern Africa and western Antarctica.
The sea surface temperature (SST) averaged for June 2024 over 60°S–60°N was 20.85°C, the highest value on record for the month.
This is the fifteenth month in a row that the SST has been the warmest in the ERA5 data record for the respective month of the year.

-----------------------------------------------------------


