Support the Arctic Sea Ice Forum and Blog

Author Topic: Global Surface Air Temperatures  (Read 864734 times)

Hefaistos

  • Guest
Re: Global Surface Air Temperatures
« Reply #2300 on: January 21, 2021, 10:36:29 AM »
His source is here .
https://oz4caster.wordpress.com/monthly-trends/
(right click on an image and google search will find a source )
From the same page as the image .
Quote
The pattern of temperature trends for the Southern Hemisphere middle latitudes and Antarctic is not consistent with hypothesized significant man-made global warming.  Since carbon dioxide concentrations are relatively uniform across the globe on a time scale of years and show persistent upward trends since 1979, these flat and downward temperature trends indicate that hypothesized man-made global warming is not dominant and that other factors are likely to be more dominant over the last 40 years.  The implication is that observed upward temperature trends in the Northern Hemisphere are also being dominated by other factors.  These other factors need to be resolved before any kind of accurate future climate predictions can be made.  Predictions made assuming that man-made global warming is dominant are likely to fail.
It is a denial blog.

As to Walrus
If you want to include all of 2020 at the sk sc trend calculator you must use an end date of 2021.
 The question is global temperature trends  so I did not consider the other series with less than global coverage. RSS TTT is biased by stratospheric contamination so is not useful for  discerning the trend in global warming.
I only used the most up to date versions in all cases .1980 to 2021.
https://skepticalscience.com/trend.php
GISTEMPv4 Trend: 0.193 ±0.040 °C/decade (2σ)
Berkeley Trend: 0.192 ±0.033 °C/decade (2σ)
HadCRUT4krig v2 Trend: 0.192 ±0.035 °C/decade (2σ)
with HadSST4 Trend: 0.188 ±0.036 °C/decade (2σ)

RSSv4.0 TLT Trend: 0.218 ±0.056 °C/decade (2σ)

The out layer is Dr Roys UAH.
UAHv6.0 TLT Trend: 0.138 ±0.056 °C/decade (2σ)

Data is data. I follow oz4 because he compiles all the relevant temperature datasets.
Also he has a daily update of CFSR which is quite useful. That is just data, not really a blog.
https://oz4caster.wordpress.com/cfsr/

How strange that a compilation of temperature datasets over time should be called "denial". And that you describe all that effort that skilful people put in to provide us with all that data as a "denier blog". I just feel grateful.

As regards what he says about temperature trends over parts of the SH and relation to CO2, it's of course true. CO2 is increasing, so forcing is increasing, but still temperatures are going down. Thus, something else than CO2 is at play in those places. Makes perfect sense to me.
I wouldn't agree to his conclusion about the predictions of the global trend, but that's something that he postulates, so it's just his guess.
« Last Edit: January 21, 2021, 10:48:18 AM by Hefaistos »

kassy

  • Moderator
  • First-year ice
  • Posts: 8311
    • View Profile
  • Liked: 2051
  • Likes Given: 1988
Re: Global Surface Air Temperatures
« Reply #2301 on: January 21, 2021, 04:57:41 PM »
As regards what he says about temperature trends over parts of the SH and relation to CO2, it's of course true. CO2 is increasing, so forcing is increasing, but still temperatures are going down. Thus, something else than CO2 is at play in those places.

So now you claim that you never heard about long term climate variability and things like ENSO?

Þetta minnismerki er til vitnis um að við vitum hvað er að gerast og hvað þarf að gera. Aðeins þú veist hvort við gerðum eitthvað.

KiwiGriff

  • Nilas ice
  • Posts: 1623
    • View Profile
  • Liked: 710
  • Likes Given: 379
Re: Global Surface Air Temperatures
« Reply #2302 on: January 21, 2021, 06:47:25 PM »
my last comment on this matter .
I sullied this blog to included a quote from your source because the passage is denial of human caused climate change quote mining portions of the passage will not change this fact .
You originally  used a number far under reality the earth is warming at about .19C a decade.  claiming only .14C a decade is  denial. Looking at short term noise in the data and claiming it signifies a hiatus in warming is also denial.
You have  a history of repeating misdirection taken from fringe sources on this blog.
I watch your comments and will without doubt catch you out again spreading bullshite you get from your loony antiscience  sources.


Animals can be driven crazy by placing too many in too small a pen. Homo sapiens is the only animal that voluntarily does this to himself.
Notebooks of Lazarus Long.
Robert Heinlein.

oren

  • First-year ice
  • Posts: 9817
    • View Profile
  • Liked: 3588
  • Likes Given: 3940
Re: Global Surface Air Temperatures
« Reply #2303 on: January 21, 2021, 07:36:03 PM »
Quote
How strange that a compilation of temperature datasets over time should be called "denial". And that you describe all that effort that skilful people put in to provide us with all that data as a "denier blog".
That the blog is a denial blog should not be doubted. It is apparent when reading between the lines and is said out loud in some of the articles and comments by the owner. That you fail to recognize this fact says something about the blog but also something about you. Your chart is made and prepared by this blog, I do not trust its accuracy in the least, and I am also certain it is presented in a way that will twist reality (scaling, color choices, adding more lines that shouldn't be there etc.). Material from denier sites should not be posted in this forum, period. And I do notice that (again) you post the material without citing its source, seemingly aware that the shady source best remain hidden.
Personally, I've had enough with these underhand dealings.

p.s. I will not link to proofs as I do not wish to add traffic to that blog and I do not wish to add denial material here. Take my word for it.

Hefaistos

  • Guest
Re: Global Surface Air Temperatures
« Reply #2304 on: January 21, 2021, 10:59:47 PM »
Quote
How strange that a compilation of temperature datasets over time should be called "denial". And that you describe all that effort that skilful people put in to provide us with all that data as a "denier blog".
That the blog is a denial blog should not be doubted. It is apparent when reading between the lines and is said out loud in some of the articles and comments by the owner. That you fail to recognize this fact says something about the blog but also something about you. Your chart is made and prepared by this blog, I do not trust its accuracy in the least, and I am also certain it is presented in a way that will twist reality (scaling, color choices, adding more lines that shouldn't be there etc.). Material from denier sites should not be posted in this forum, period. And I do notice that (again) you post the material without citing its source, seemingly aware that the shady source best remain hidden.
Personally, I've had enough with these underhand dealings.

p.s. I will not link to proofs as I do not wish to add traffic to that blog and I do not wish to add denial material here. Take my word for it.

I do trust the data compiled.
But to check your claim that OZ4 might have faked something, or twisted smth, I downloaded the data I had easily available, and ran the same plot, from 2014-2020.
Here they are, both of them.

I still think that data is data, and you have to get them where they are available. OZ4 has nice updates (daily and monthly) of the relevant temperature series.

The levels might be somewhat different for some of the series, but the take-away is the same: a developing hiatus since 2016. Deny it as you please!


Hefaistos

  • Guest
Re: Global Surface Air Temperatures
« Reply #2305 on: January 21, 2021, 11:09:00 PM »
As regards what he says about temperature trends over parts of the SH and relation to CO2, it's of course true. CO2 is increasing, so forcing is increasing, but still temperatures are going down. Thus, something else than CO2 is at play in those places.

So now you claim that you never heard about long term climate variability and things like ENSO?

I was commenting on the claim from KiwiGriff that the statement in question at OZ4 is some kind of 'denial'. It isn't. OZ4 just claims the obvious.

oren

  • First-year ice
  • Posts: 9817
    • View Profile
  • Liked: 3588
  • Likes Given: 3940
Re: Global Surface Air Temperatures
« Reply #2306 on: January 22, 2021, 02:20:55 AM »
My own chart, data downloaded from NASA at https://data.giss.nasa.gov/gistemp/graphs_v4/

Taking the largest El Nino in two decades and using it to define a baseline for a hiatus is not comparing apples to apples, and is a simple denialist act. We've had enough of that in the years after 1998-1999. You should go into moderation. Disagreements are okay and even encouraged, denialism is off limits.

Hefaistos

  • Guest
Re: Global Surface Air Temperatures
« Reply #2307 on: January 22, 2021, 06:07:40 AM »
My own chart, data downloaded from NASA at https://data.giss.nasa.gov/gistemp/graphs_v4/

Taking the largest El Nino in two decades and using it to define a baseline for a hiatus is not comparing apples to apples, and is a simple denialist act. We've had enough of that in the years after 1998-1999. You should go into moderation. Disagreements are okay and even encouraged, denialism is off limits.

Oren, I have repeatedly said that I don't deny anything here! I took a temperature chart from a site that provides a very nice collection of daily and monthly updates. Such sites are rare! I always look for data, not for some opinions expressed on a site. Words are cheap, good data collections are rare. For me data is data.

Another thing is if data is manipulated, so I checked that and compared with raw data. All is fine with the data from OZ4, as well as with his continuosly updated presentation of data on charts. See my comparison above.

As for 1998/99, sorry, I wasn't around then, don't know too much what you're talking about.

As for defining a baseline for a hiatus, it's a good principle to start from a well-defined top and then follow it until that top is taken out, or to a subsequent top, (or, similarily, from a bottom to a bottom). This is just data analysis, but you claim this is denialism? 
Bizarre.


blu_ice

  • Frazil ice
  • Posts: 284
    • View Profile
  • Liked: 86
  • Likes Given: 190
Re: Global Surface Air Temperatures
« Reply #2308 on: January 22, 2021, 10:25:54 AM »
Could we drop the "hiatus" please? Everybody knows global temps are noisy. A new record year is not followed by a record year after a record year, even in a warming world. Variability is not hiatus.

Rodius

  • Nilas ice
  • Posts: 2164
    • View Profile
  • Liked: 647
  • Likes Given: 46
Re: Global Surface Air Temperatures
« Reply #2309 on: January 22, 2021, 11:13:44 AM »
My own chart, data downloaded from NASA at https://data.giss.nasa.gov/gistemp/graphs_v4/

Taking the largest El Nino in two decades and using it to define a baseline for a hiatus is not comparing apples to apples, and is a simple denialist act. We've had enough of that in the years after 1998-1999. You should go into moderation. Disagreements are okay and even encouraged, denialism is off limits.

Oren, I have repeatedly said that I don't deny anything here! I took a temperature chart from a site that provides a very nice collection of daily and monthly updates. Such sites are rare! I always look for data, not for some opinions expressed on a site. Words are cheap, good data collections are rare. For me data is data.

Another thing is if data is manipulated, so I checked that and compared with raw data. All is fine with the data from OZ4, as well as with his continuosly updated presentation of data on charts. See my comparison above.

As for 1998/99, sorry, I wasn't around then, don't know too much what you're talking about.

As for defining a baseline for a hiatus, it's a good principle to start from a well-defined top and then follow it until that top is taken out, or to a subsequent top, (or, similarily, from a bottom to a bottom). This is just data analysis, but you claim this is denialism? 
Bizarre.

What a strange reply.

1 - the site you get the data from is biased and a denier site. This has been said multiple times and highlighted that it is manipulated. Yet you persist.

2 - Data is not data..... it is information to interpret a situation. The data, in itself, is not some magical way to give a black and white answer, yet you seem to think that it is.

3 - As for 1998/99.... and you not being around means you don't know much about it.... are you saying that nobody should know anything about anything before they were born? This type of thinking is bizarre.

4 - as for baselines, my understanding is, in climate anyway, you need 30 years worth of averages to get a baseline. A baseline is restarted when a new record is created... that is just a load of bullshit. There are several baselines you can use, but none of them are based on setting it at the last record.

oren

  • First-year ice
  • Posts: 9817
    • View Profile
  • Liked: 3588
  • Likes Given: 3940
Re: Global Surface Air Temperatures
« Reply #2310 on: January 22, 2021, 11:28:58 AM »
The false hiatus was not born in 1998-9, it was born in the mid-2000s, just as the current false hiatus was born in 2020. I haven't been around then either, but this site and the Internet was full of discussions about said false hiatus ("faux hiatus" would get you many search results). Ignoring a monster El Nino that comes along every couple of decades and natural variability that has swings of several years and naming a short term hiatus is denialism by the book.

Neven

  • Administrator
  • First-year ice
  • Posts: 9503
    • View Profile
    • Arctic Sea Ice Blog
  • Liked: 1336
  • Likes Given: 618
Re: Global Surface Air Temperatures
« Reply #2311 on: January 22, 2021, 11:47:53 AM »
Please, stop trolling, Hefaistos. Statistical manipulation is not 'data'.
The enemy is within
Don't confuse me with him

E. Smith

grixm

  • Grease ice
  • Posts: 699
    • View Profile
  • Liked: 374
  • Likes Given: 131
Re: Global Surface Air Temperatures
« Reply #2312 on: January 22, 2021, 01:13:55 PM »
I think this discussion is just the result of an innocent misunderstanding, more specifically the semantics of the word "hiatus". It does not seem to me that Hefaistos is trolling, but merely used that word in a somewhat inaccurate manner, but then doubled down when met with overly harsh knee-jerk responses like calling him a troll or denier because of it. This reaction is normal and therefore if common understanding is the goal then accusations like that should be avoided.

In short: Have we seen periods after a peak in air temperature where there are no new record for a few years afterwards? Yes. Does that mean that the warming actually stopped in these periods, in other words that global warming took a "hiatus"? No, it was just statistical noise. It seems to me that everyone including Hefaistos agrees with this, so there is really no reason to argue.

pleun

  • New ice
  • Posts: 66
    • View Profile
  • Liked: 27
  • Likes Given: 15
Re: Global Surface Air Temperatures
« Reply #2313 on: January 22, 2021, 03:03:28 PM »
if you use the word "hiatus" then you have an agenda, nothing innocent there. Especially if you have a history of this kind of discussion.

blu_ice

  • Frazil ice
  • Posts: 284
    • View Profile
  • Liked: 86
  • Likes Given: 190
Re: Global Surface Air Temperatures
« Reply #2314 on: January 22, 2021, 04:05:49 PM »
This was textbook trolling.

Instead of Global Surface Air Temperatures people are now discussing whether there is a hiatus or not. Discussion was successfully derailed to a denier talking point.

Hefaistos

  • Guest
Re: Global Surface Air Temperatures
« Reply #2315 on: January 23, 2021, 04:59:45 AM »
if you use the word "hiatus" then you have an agenda, nothing innocent there. Especially if you have a history of this kind of discussion.

Sorry, shouldn't have used 'hiatus' if i knew it was so controversial. Could have used 'interregnum' instead :) Where the El Ninos seem to be the rulers, at least in short terms.

My agenda is just that i'm learning all i can about climate. Currently, i've become more interested in the natural variability of the climate, and how it relates to general trends.

The forum is about an exchange of information and thoughts, that's a great learning experience to be able to have such discussions. Thanks!

Hefaistos

  • Guest
Re: Global Surface Air Temperatures
« Reply #2316 on: January 23, 2021, 05:11:15 AM »
I think this discussion is just the result of an innocent misunderstanding, more specifically the semantics of the word "hiatus". It does not seem to me that Hefaistos is trolling, but merely used that word in a somewhat inaccurate manner, but then doubled down when met with overly harsh knee-jerk responses like calling him a troll or denier because of it. This reaction is normal and therefore if common understanding is the goal then accusations like that should be avoided.

In short: Have we seen periods after a peak in air temperature where there are no new record for a few years afterwards? Yes. Does that mean that the warming actually stopped in these periods, in other words that global warming took a "hiatus"? No, it was just statistical noise. It seems to me that everyone including Hefaistos agrees with this, so there is really no reason to argue.

No, I disagree with the bolded statement, it's not 'statistical noise'. Simply because we know that a lot of the temperature variability is caused by the ENSO. That is not to be defined as noise.

But what rules the ENSO?
What decides when there is a strong Nino, or a strong Nina?
What's the relation between ENSO and longer term ocean cycles such as the PDO or the AMO?
And what rules them?

My impression is that there is a lot to learn for everyone here, we simply don't know too much about these things. At least I don't :)

grixm

  • Grease ice
  • Posts: 699
    • View Profile
  • Liked: 374
  • Likes Given: 131
Re: Global Surface Air Temperatures
« Reply #2317 on: January 23, 2021, 08:40:25 AM »
No, I disagree with the bolded statement, it's not 'statistical noise'. Simply because we know that a lot of the temperature variability is caused by the ENSO. That is not to be defined as noise.

ENSO is most certainly statistical noise. Just because there is a causality involved doesn't mean that the underlying cause at the bottom of the causality chain is not chaotic randomness. And all data points towards ENSO being exactly that, due to how difficult it is to forecast years into the future, like weather itself.
« Last Edit: January 23, 2021, 09:22:10 AM by grixm »

The Walrus

  • Young ice
  • Posts: 2863
    • View Profile
  • Liked: 150
  • Likes Given: 487
Re: Global Surface Air Temperatures
« Reply #2318 on: January 23, 2021, 01:49:54 PM »
No, I disagree with the bolded statement, it's not 'statistical noise'. Simply because we know that a lot of the temperature variability is caused by the ENSO. That is not to be defined as noise.

ENSO is most certainly statistical noise. Just because there is a causality involved doesn't mean that the underlying cause at the bottom of the causality chain is not chaotic randomness. And all data points towards ENSO being exactly that, due to how difficult it is to forecast years into the future, like weather itself.

You are both right.  ENSO, in and of itself, is not statistical noise.  ENSO is a real deviation around the average temperature.  It is not noise in the same way that sinusoidal deviations around the central point are not noise.  However, when viewed over the long term, ENSO could be considered noise in that it does not affect the overall trend.  Either way, ENSO will affect statistical measurements over both the short- and medium- terms.  Starting or ending with a strong El Niño or La Niña will affect the numbers.

oren

  • First-year ice
  • Posts: 9817
    • View Profile
  • Liked: 3588
  • Likes Given: 3940
Re: Global Surface Air Temperatures
« Reply #2319 on: January 23, 2021, 05:45:13 PM »
Cross-posting from one of the Cryosphere threads.

    Back in November, I posted a chart showing predicted end-of-year 2020 annual NASS GISS-Temp (global average surface temperature) anomaly vs. 1850-1900 average AFTER removing short-term influences of ENSO (El Nino/La Nina), solar cycle, and aerosol (Mauna Loa).  The final two months of 2020 came in slightly warmer than expected.  Here is how 2020 looks with all 12 months of NASA GISS values.

     The observed 2020 value was a statistical tie with 2016 (with 2020 at 0.014 C warmer) as the warmest year in modern record (since 1880).  But when you subtract out temporary influences of ENSO/solar/aerosol, to estimate an underlying systemic temperature, then 2020 was the warmest year by a larger margin.  2020 was 0.109 C warmer than 2019, which replaces 2016 in 2nd place when you filter out the estimated effects of ENSO/solar/aerosol.

     In the Real Climate blog, Gavin Schmidt of NASA says the uncertainty in the annual GISS-Temp annual anomaly is 0.05C.  The uncertainty for estimates that include additional factors (ENSO/solar/aerosol) each with its own uncertainties is probably larger.  But at least Schmidt's 0.05 uncertainty for annual GISSTemp anomaly gives us a frame of reference. 

     At 0.109 C warmer than the previous warmest year, it seems likely that 2020 was indeed the warmest year in the modern record.  Schmidt also said that the estimate of global average surface temperature itself has an uncertainty of ca. 0.5C, so this conclusion may be a distinction without a meaningful difference.  Especially when you remember that the surface temperature does not equal the temperature of the planetary system as whole.  There is a lot more heat energy stored in the ocean than in the atmosphere.  But for tracking the climate change influence driving Arctic Sea Ice, the NASA GISSTemp may be as good an indicator as any (says a guy with no training in climate science).


jai mitchell

  • Nilas ice
  • Posts: 2364
    • View Profile
  • Liked: 208
  • Likes Given: 60
Re: Global Surface Air Temperatures
« Reply #2320 on: February 26, 2021, 04:38:52 PM »
Hefaistos


Globally averaged surface temperature is a highly variable, multi-input metric.  This means that, as a complex system it cannot be treated as a simpler metric, like a stock value.  You don't do a chart based on a reported peak and then draw your support levels to predict where it will go from there.

To determine the long-term trend you have to do a fairly complex statistical analysis that takes the average differential for each year over the last 30 years, then take the average differential for each 2-year period over that same time, then a 3-year differential and so on and then Then you get the variance of the metric. and using this variance you can determine what the statistical probability of future warming will be and if a previous peak or trough is far above (or below) the statistical trend-less variability.

It is this reason that many scientists say that we cannot yet determine that global warming (temperatures) are accelerating over the last 2 decades.  Even though on a straight ling graph from the 1980's onward we can see that the acceleration is fairly obvious.  The statistical significance of a trend takes over a decade to show itself.
Haiku of Futures Passed
My "burning embers"
are not tri-color bar graphs
+3C today

vox_mundi

  • Multi-year ice
  • Posts: 10233
    • View Profile
  • Liked: 3517
  • Likes Given: 754
Re: Global Surface Air Temperatures
« Reply #2321 on: May 27, 2021, 01:38:16 PM »
World May Breach 1.5°C Warming Within 5 Years: WMO
https://phys.org/news/2021-05-world-breach-15c-years-wmo.html


The World Meterological Organization and Britain's Met Office said there was a 40 percent chance of the annual average global temperature surpassing 1.5C above pre-industrial temperatures—the aspirational warming limit of the Paris climate accord.

According to the Met Office's updated global 10-year climate prediction, there is a 90 percent chance of at least one year between 2021-2025 being the hottest on record.

The annual average global temperature over the next five years is likely to be at least 1C warmer than pre-industrial levels, within a range of 0.9C-1.8C warmer, it said.

"These are more than just statistics," said WMO Secretary-General Petteri Taalas.

"Increasing temperatures mean more melting ice, higher sea levels, more heatwaves and other extreme weather, and greater impacts on food security, health, the environment and sustainable development."

The Global Annual to Decadal Climate Update, released on Thursday, showed that the chance of breaching 1.5C had roughly doubled compared to a similar assessment made last year.

The doubling of the odds is due to improvements in technology that show it has "actually warmed more than we thought already," especially over the lightly-monitored polar regions, said Leon Hermanson, a climate scientist at the United Kingdom's Met Center who helped on the forecast.

... The WHO said the new assessment also showed an increased likelihood of tropical cyclones in the Atlantic, as well as increased rainfall in high-latitude regions and the Sahel compared with the recent past.

https://public.wmo.int/en/media/press-release/new-climate-predictions-increase-likelihood-of-temporarily-reaching-15-%C2%B0c-next-5
“There are three classes of people: those who see. Those who see when they are shown. Those who do not see.” ― anonymous

Insensible before the wave so soon released by callous fate. Affected most, they understand the least, and understanding, when it comes, invariably arrives too late

The Walrus

  • Young ice
  • Posts: 2863
    • View Profile
  • Liked: 150
  • Likes Given: 487
Re: Global Surface Air Temperatures
« Reply #2322 on: June 03, 2021, 10:19:42 PM »
Now that ENSO appears to have transitioned away from La Nina, the lower atmospheric temperature is resuming its rise.  From the graph, peak El Nino temperatures are rising at a rate of 0.14C / decade, while valley La Nina temperatures are rising at 0.13C / decade.  Overall, the global lower atmospheric temperature has increased by ~0.55C since satellite inception.

vox_mundi

  • Multi-year ice
  • Posts: 10233
    • View Profile
  • Liked: 3517
  • Likes Given: 754
Re: Global Surface Air Temperatures
« Reply #2323 on: June 04, 2021, 01:19:18 AM »
Climate Tipping Points Could Topple Like Dominoes, Warn Scientists
https://www.theguardian.com/environment/2021/jun/03/climate-tipping-points-could-topple-like-dominoes-warn-scientists


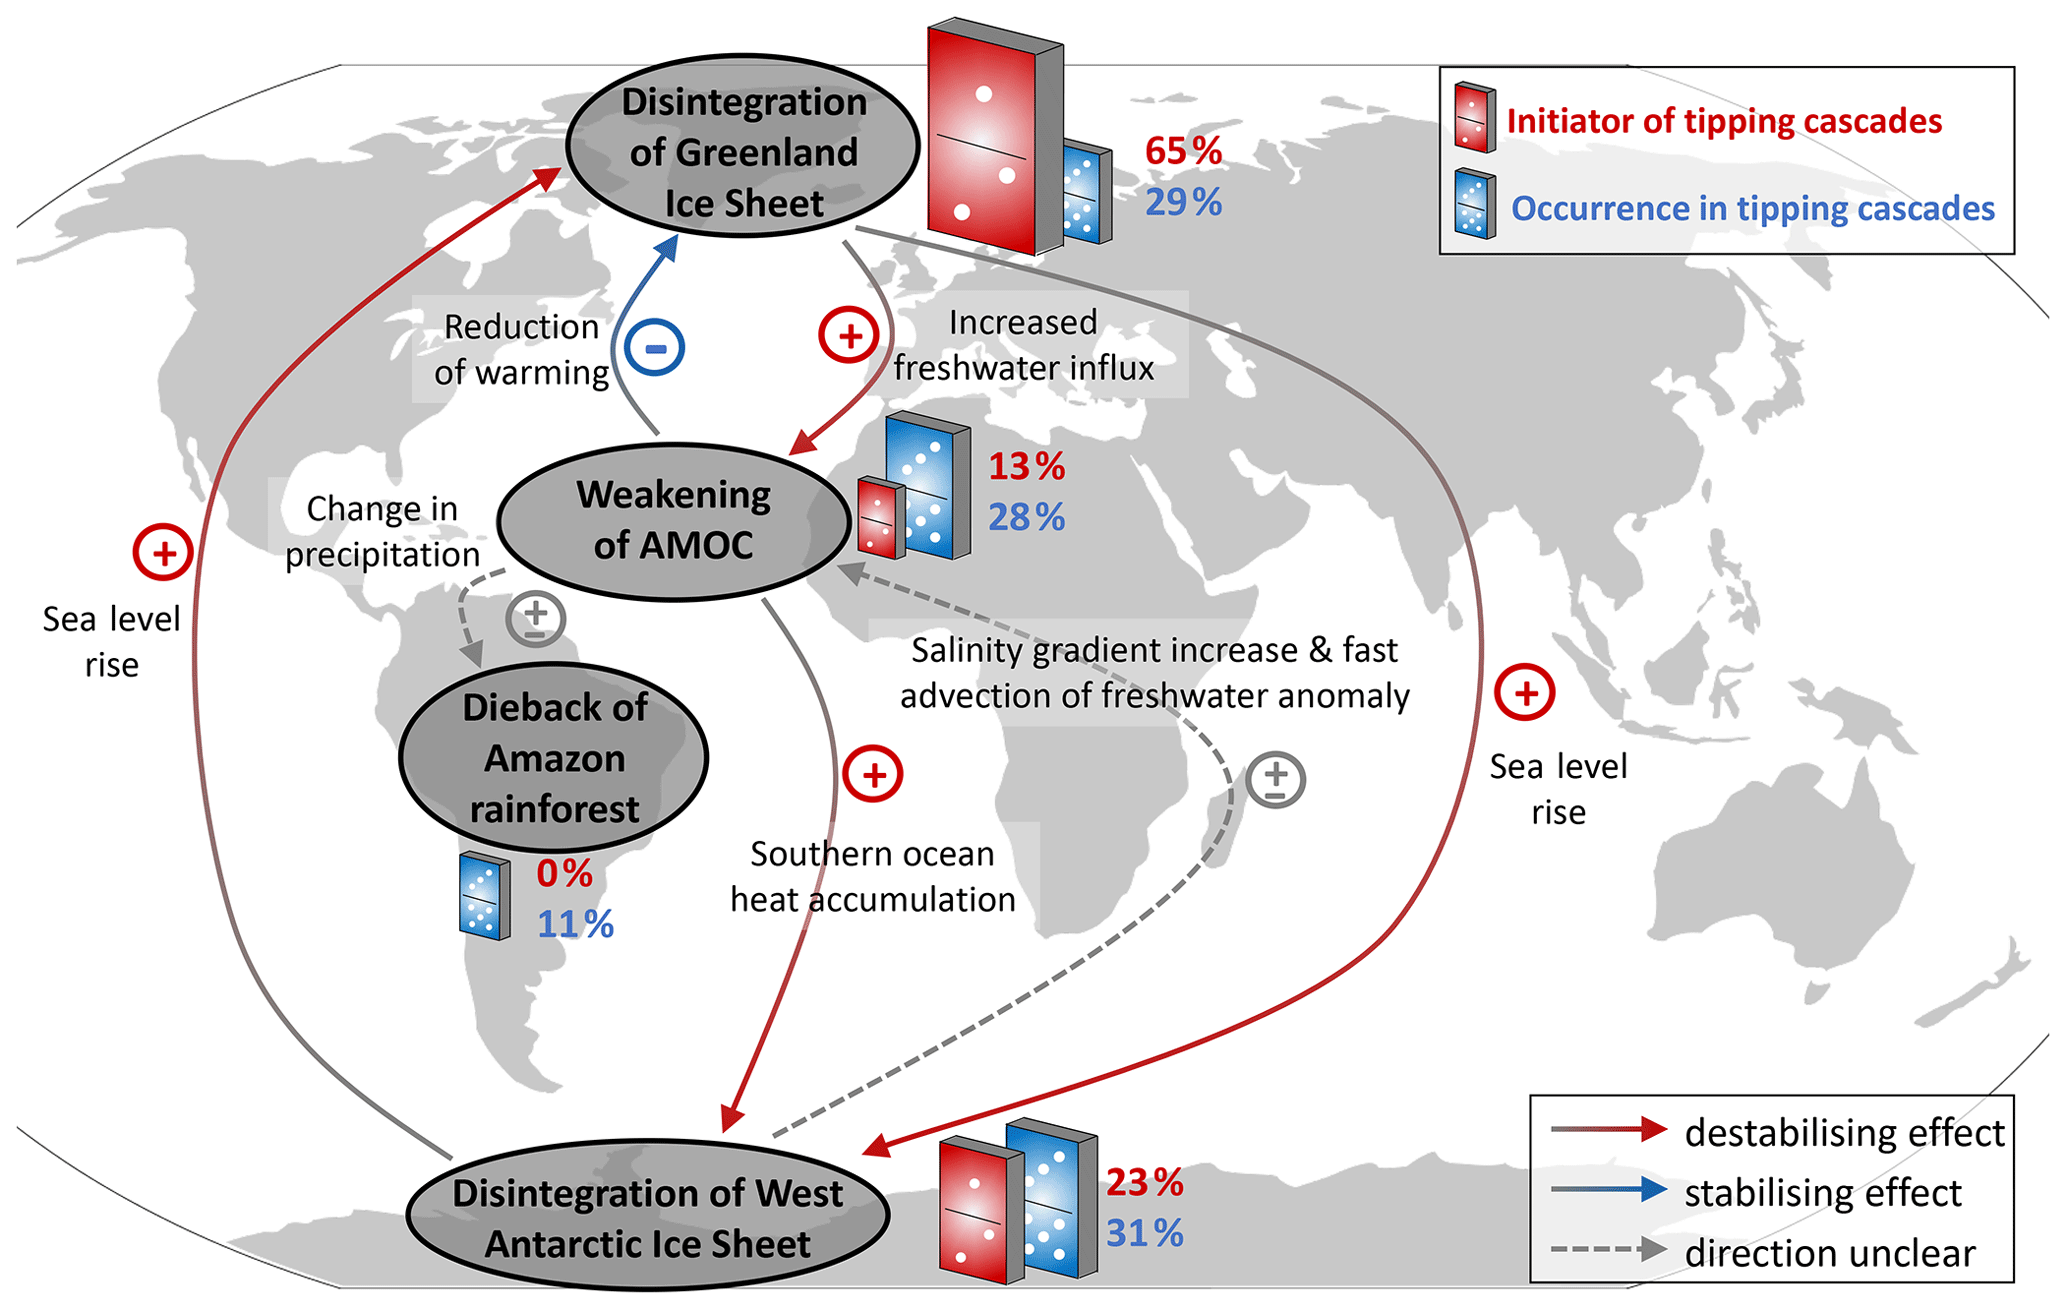
New research examined the interactions between ice sheets in West Antarctica, Greenland, the warm Atlantic Gulf Stream and the Amazon rainforest. The scientists carried out 3 million computer simulations and found domino effects in a third of them, even when temperature rises were below 2°C, the upper limit of the Paris agreement.

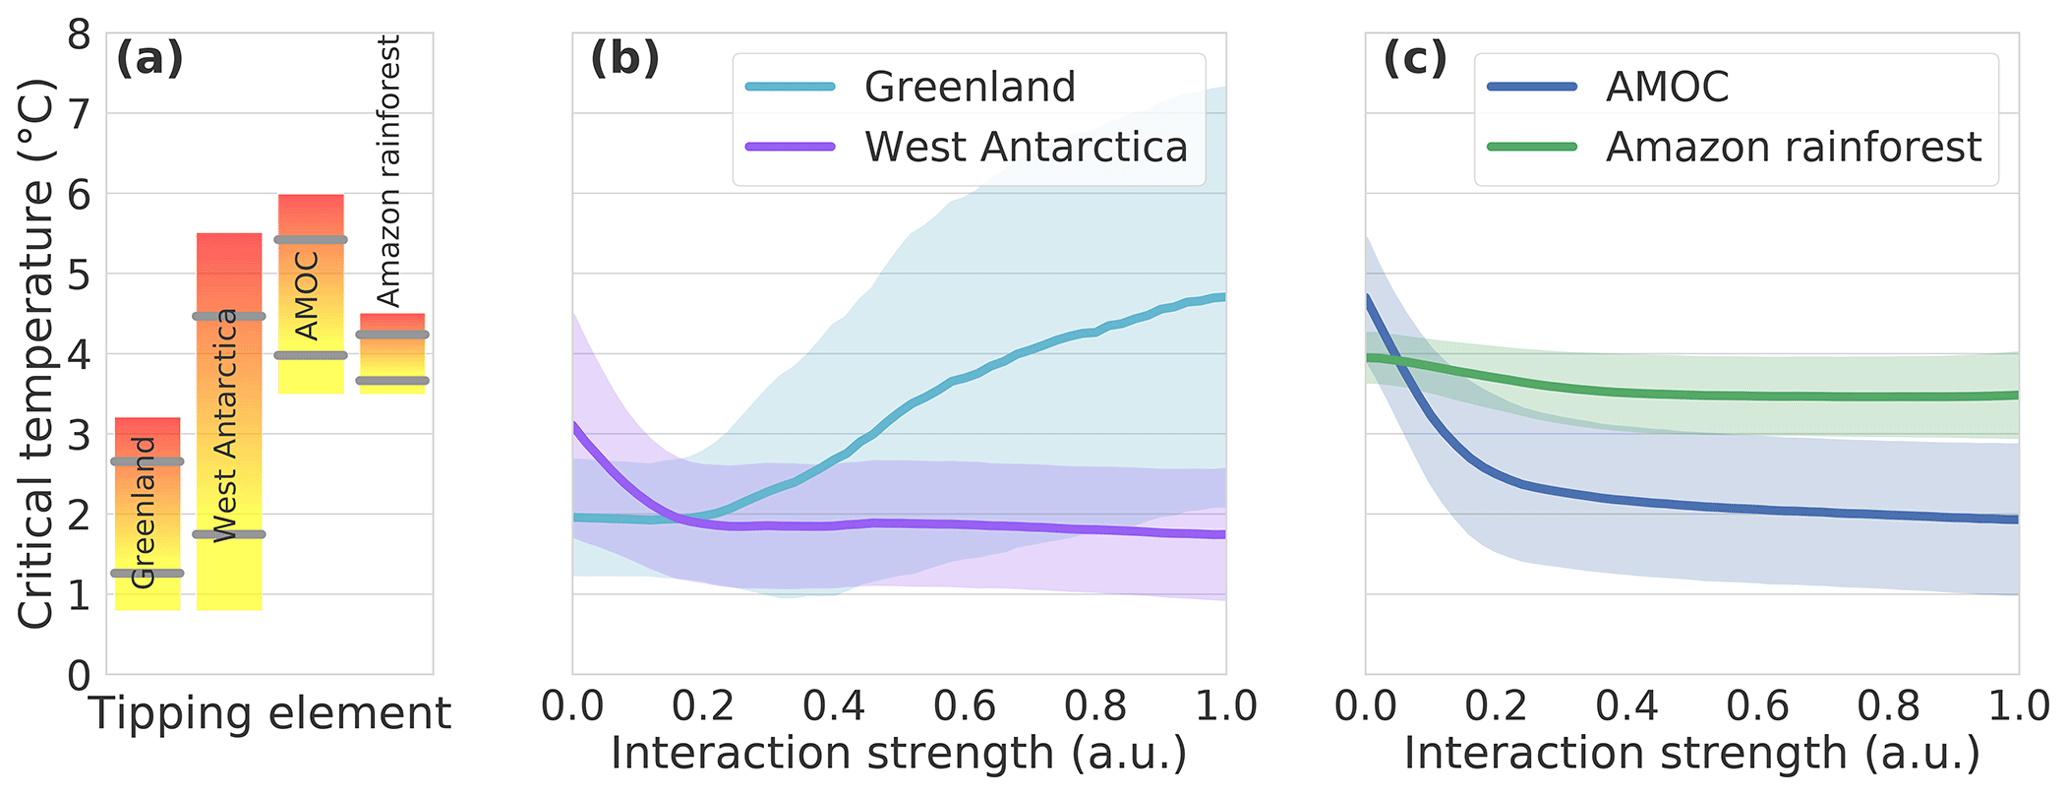
The study showed that the interactions between these climate systems can lower the critical temperature thresholds at which each tipping point is passed. It found that ice sheets are potential starting points for tipping cascades, with the Atlantic currents acting as a transmitter and eventually affecting the Amazon.

“We provide a risk analysis, not a prediction, but our findings still raise concern,” said Prof Ricarda Winkelmann, at the Potsdam Institute for Climate Impact Research (PIK) in Germany. “[Our findings] might mean we have less time to reduce greenhouse gas emissions and still prevent tipping processes.”

The level of CO2 in the atmosphere required to push temperatures beyond the thresholds could be reached in the very near future, she said. “In the next years or decades, we might be committing future generations to really severe consequences.” These could include many metres of sea-level rise from ice melting, affecting scores of coastal cities.


... In May, scientists reported that a significant part of the Greenland ice sheet was on the brink of a tipping point. A 2019 analysis led by Prof Tim Lenton at the University of Exeter suggested the world may already have crossed a series of climate tipping points, resulting in what the researchers called “an existential threat to civilisation”.

The climate crisis may also mean much of the Amazon is close to a tipping point, at which carbon-storing forest is replaced by savannah, researchers have warned. The ocean currents of the Atlantic Meridional Overturning Circulation (AMOC), of which the Gulf Stream is an important part and keeps western Europe mild, are at their weakest in more than a millennium.


Nico Wunderling, et.al., Interacting tipping elements increase risk of climate domino effects under global warming, (2021)
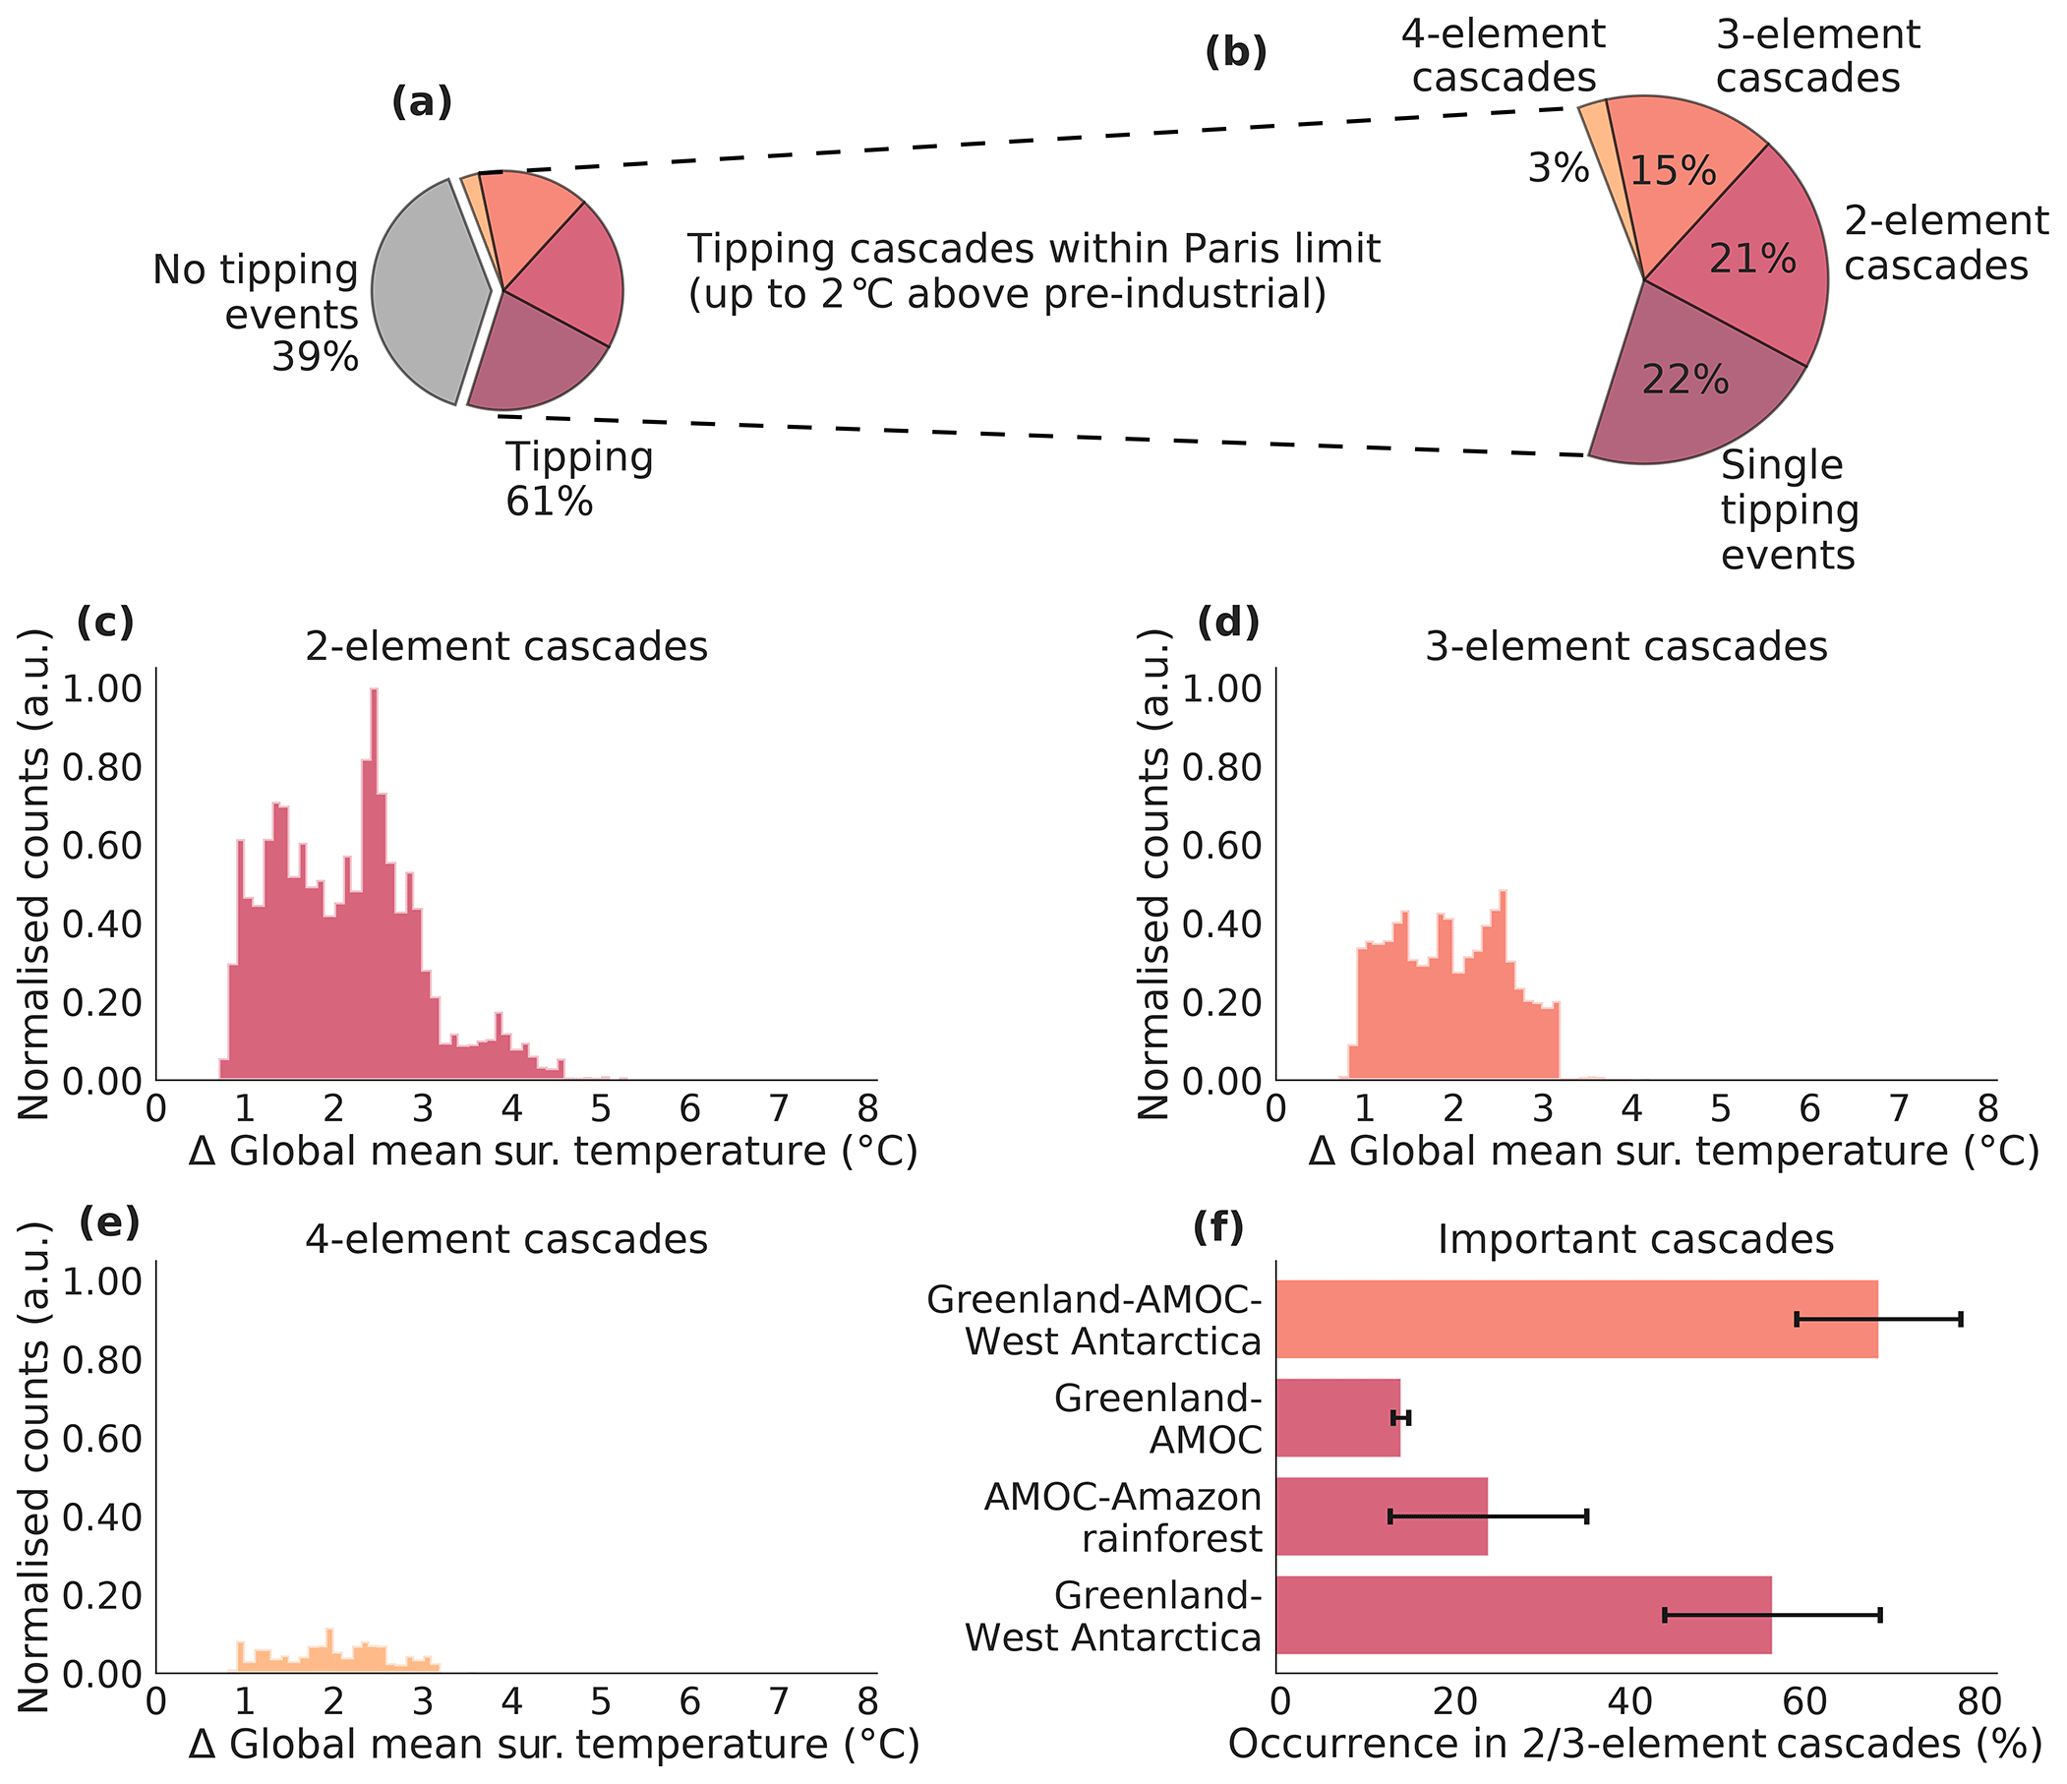
https://esd.copernicus.org/articles/12/601/2021/
https://doi.org/10.5194/esd-12-601-2021

... Tipping cascades occur when two or more tipping elements transgress their critical thresholds for a given temperature level (see Sect. 2.5). We evaluate the associated risk as the share of ensemble simulations in which such tipping cascades are detected. For global warming up to 2.0 ∘C, tipping occurs in 61 % of all simulations (Fig. 5a). This comprises the tipping of individual elements (22 %) as well as cascades including two elements (21 %), three elements (15 %) and four elements (3 %; see Fig. 5b).
“There are three classes of people: those who see. Those who see when they are shown. Those who do not see.” ― anonymous

Insensible before the wave so soon released by callous fate. Affected most, they understand the least, and understanding, when it comes, invariably arrives too late

rboyd

  • Nilas ice
  • Posts: 1334
    • View Profile
  • Liked: 226
  • Likes Given: 52
Re: Global Surface Air Temperatures
« Reply #2324 on: June 22, 2021, 01:18:00 AM »
NOAA GISS for May 2021

- 0.79C above 1951-1980 average
- 1.05C above 1880-1920 baseline
- 1.25C above preindustrial

Looks like the La Nina is having the expected impact upon temperatures.

kassy

  • Moderator
  • First-year ice
  • Posts: 8311
    • View Profile
  • Liked: 2051
  • Likes Given: 1988
Re: Global Surface Air Temperatures
« Reply #2325 on: July 21, 2021, 11:20:42 AM »
The posts about cloud feedback have been moved into it´s own thread in science since that subject was missing there.

https://forum.arctic-sea-ice.net/index.php/topic,3584.0.html
Þetta minnismerki er til vitnis um að við vitum hvað er að gerast og hvað þarf að gera. Aðeins þú veist hvort við gerðum eitthvað.

jai mitchell

  • Nilas ice
  • Posts: 2364
    • View Profile
  • Liked: 208
  • Likes Given: 60
Re: Global Surface Air Temperatures
« Reply #2326 on: July 24, 2021, 01:13:12 AM »
Now that ENSO appears to have transitioned away from La Nina, the lower atmospheric temperature is resuming its rise.  From the graph, peak El Nino temperatures are rising at a rate of 0.14C / decade, while valley La Nina temperatures are rising at 0.13C / decade.  Overall, the global lower atmospheric temperature has increased by ~0.55C since satellite inception.

UAH is a fatally flawed series run by climate deniers.  Ever since self-calibrating satellites were added to the MSU they refused to update their series for orbit decay.
Haiku of Futures Passed
My "burning embers"
are not tri-color bar graphs
+3C today

Sigmetnow

  • Multi-year ice
  • Posts: 25901
    • View Profile
  • Liked: 1159
  • Likes Given: 430
Re: Global Surface Air Temperatures
« Reply #2327 on: July 24, 2021, 03:46:45 AM »
Quote
Scott Duncan (@ScottDuncanWX):
June 2021 was the hottest on record for the Northern Hemisphere.
In fact, 2019, 2020 and 2021 are the three hottest Junes on record for the Northern Hemisphere.
Data: @NASAGISS
https://twitter.com/ScottDuncanWX/status/1417928536359325704
⬇️ Image below.

Quote
Scott Duncan (@ScottDuncanWX):
This is how all the Junes since 1880 stack up.
This is Northern Hemisphere temperature anomaly compared to the long term average 1951-1980.
➡️ https://twitter.com/ScottDuncanWX/status/1417930383929352199
⬇️ Image below, GIF at the link.
People who say it cannot be done should not interrupt those who are doing it.

Freegrass

  • Young ice
  • Posts: 3857
  • Autodidacticism is a complicated word
    • View Profile
  • Liked: 953
  • Likes Given: 1260
Re: Global Surface Air Temperatures
« Reply #2328 on: June 06, 2022, 04:37:39 PM »
Is it just me, or is anyone else also seeing a brake on the warming of the planet in this graph? Shouldn't we be higher by now according the rise we've seen in the past annual increases? Since 2016 the warming seems to have stalled...

Quote
The January–April global surface temperature was 0.87°C (1.57°F) above the 20th-century average and ranked as the fifth-highest in the 143-year record. The 10 warmest January–Aprils have occurred since 2007, with the last eight years (2015–2022) being the eight warmest on record. According to NCEI's statistical analysis, the year 2022 is very likely to rank among the ten warmest years on record and has a 27.8% chance to rank among the five warmest years on record.
https://www.ncei.noaa.gov/access/monitoring/monthly-report/global/202204
90% of the world is religious, but somehow "love thy neighbour" became "fuck thy neighbours", if they don't agree with your point of view.

WTF happened?

Neven

  • Administrator
  • First-year ice
  • Posts: 9503
    • View Profile
    • Arctic Sea Ice Blog
  • Liked: 1336
  • Likes Given: 618
Re: Global Surface Air Temperatures
« Reply #2329 on: June 06, 2022, 05:34:30 PM »
Is it just me, or is anyone else also seeing a brake on the warming of the planet in this graph?

It's probably just you. How many more past brakes on warming do you see on the graph? You should see several. And what happened after each of those brakes?
The enemy is within
Don't confuse me with him

E. Smith

Shared Humanity

  • Nilas ice
  • Posts: 1400
    • View Profile
  • Liked: 471
  • Likes Given: 55
Re: Global Surface Air Temperatures
« Reply #2330 on: June 06, 2022, 05:59:06 PM »
Is it just me, or is anyone else also seeing a brake on the warming of the planet in this graph?


From the chart:

1.Big stall in the 1940's

2. Smaller but not insignificant stall in the 1950's

3.Significant stalls in the early 60's and 80's.

4. 15 years of no real increase beginning in the late 90's

5. And now a 6 year decline.

All of the "stalls" have occurred while the temperature of the planet has increased 1.4C since 1900. So no. I'm not seeing it.

But then, that is just me.


Freegrass

  • Young ice
  • Posts: 3857
  • Autodidacticism is a complicated word
    • View Profile
  • Liked: 953
  • Likes Given: 1260
Re: Global Surface Air Temperatures
« Reply #2331 on: June 06, 2022, 06:08:40 PM »
Is it just me, or is anyone else also seeing a brake on the warming of the planet in this graph?

It's probably just you. How many more past brakes on warming do you see on the graph? You should see several. And what happened after each of those brakes?
I'm not seeing a time where temperatures are this low 6 years after the latest peak. 2016 was the record, and 2022 seems lower than it should be compared to the historical record.

I'm just looking for reasons why the Arctic is so cold this year... Is it because of the Tonga eruption? Or the second year in a row with a La Niña? Both combined? Or did the lockdown have an effect? Or is more moisture in the atmosphere keeping the sun out more? I just find it weird that it's taking so long for the 2016 record to be broken. Something is causing the temperature to get out of sink with the increase in CO2 in the atmosphere, and it could be all of the above... But I'm sure there is no easy answer...

I could of course also be that I'm seeing things that aren't there...  :-\

https://www.co2levels.org/
Edit: just noticed they haven't updated the number since the end of 2020. Just wrote them a message to ask them why, because this website is really good...
« Last Edit: June 06, 2022, 06:22:28 PM by Freegrass »
90% of the world is religious, but somehow "love thy neighbour" became "fuck thy neighbours", if they don't agree with your point of view.

WTF happened?

The Walrus

  • Young ice
  • Posts: 2863
    • View Profile
  • Liked: 150
  • Likes Given: 487
Re: Global Surface Air Temperatures
« Reply #2332 on: June 06, 2022, 06:21:41 PM »
I understand what you are saying, but must emphasize that it is too soon to make any concrete claim about any brakes.  It may put the brakes on any claims regarding exponential or runaway warming, but that is about it.  When we have a full decade or so with flattening, then there may be something to it.

Shared Humanity

  • Nilas ice
  • Posts: 1400
    • View Profile
  • Liked: 471
  • Likes Given: 55
Re: Global Surface Air Temperatures
« Reply #2333 on: June 06, 2022, 06:45:43 PM »
1998 was a record warm year, far warmer than any year that had preceded it. It was not matched for a decade and AGW deniers used this to argue that climate science was alarmist.

neal

  • Grease ice
  • Posts: 719
    • View Profile
  • Liked: 204
  • Likes Given: 50
Re: Global Surface Air Temperatures
« Reply #2334 on: June 06, 2022, 07:05:50 PM »
Is it just me, or is anyone else also seeing a brake on the warming of the planet in this graph? Shouldn't we be higher by now according the rise we've seen in the past annual increases? Since 2016 the warming seems to have stalled...

<snark> Shhh, what will the climate change people do now...?<snark>

Nature does not proceed in a straight line, it is rather a sprawling development.

Robert Smithson

Freegrass

  • Young ice
  • Posts: 3857
  • Autodidacticism is a complicated word
    • View Profile
  • Liked: 953
  • Likes Given: 1260
Re: Global Surface Air Temperatures
« Reply #2335 on: June 06, 2022, 07:07:07 PM »
1998 was a record warm year, far warmer than any year that had preceded it. It was not matched for a decade and AGW deniers used this to argue that climate science was alarmist.
I hope you don't think I'm a climate change denier. Far from! I just thought the warming would speed up, and something is holding it back this year it seems. All I'm doing is trying to get a discussion going to figure out what it could be. That's all.
90% of the world is religious, but somehow "love thy neighbour" became "fuck thy neighbours", if they don't agree with your point of view.

WTF happened?

vox_mundi

  • Multi-year ice
  • Posts: 10233
    • View Profile
  • Liked: 3517
  • Likes Given: 754
Re: Global Surface Air Temperatures
« Reply #2336 on: June 06, 2022, 07:26:18 PM »
^ The year is still young
“There are three classes of people: those who see. Those who see when they are shown. Those who do not see.” ― anonymous

Insensible before the wave so soon released by callous fate. Affected most, they understand the least, and understanding, when it comes, invariably arrives too late

Richard Rathbone

  • Nilas ice
  • Posts: 1738
    • View Profile
  • Liked: 388
  • Likes Given: 24
Re: Global Surface Air Temperatures
« Reply #2337 on: June 06, 2022, 10:35:02 PM »
Is it just me, or is anyone else also seeing a brake on the warming of the planet in this graph? Shouldn't we be higher by now according the rise we've seen in the past annual increases? Since 2016 the warming seems to have stalled...


Its called ENSO. Big Ninos lead to long standing records, because it takes a fairly big Nino as well as accumulating GHG to beat them.

oren

  • First-year ice
  • Posts: 9817
    • View Profile
  • Liked: 3588
  • Likes Given: 3940
Re: Global Surface Air Temperatures
« Reply #2338 on: June 06, 2022, 11:42:39 PM »
After a huge spike, a stall would appear to some, it's not a stall, just the play of volatility on a trend.
Look at the 10-year moving average, it should give you better feel of the trend.

jai mitchell

  • Nilas ice
  • Posts: 2364
    • View Profile
  • Liked: 208
  • Likes Given: 60
Re: Global Surface Air Temperatures
« Reply #2339 on: June 07, 2022, 04:35:18 AM »
The rate of warming has been recognized as coming in spurts that correspond to the El Nino cycles and the distribution of heat from the oceans to the atmosphere.   We will expect a series of new record high temperatures at and following the next strong El Nino.
Haiku of Futures Passed
My "burning embers"
are not tri-color bar graphs
+3C today

KiwiGriff

  • Nilas ice
  • Posts: 1623
    • View Profile
  • Liked: 710
  • Likes Given: 379
Animals can be driven crazy by placing too many in too small a pen. Homo sapiens is the only animal that voluntarily does this to himself.
Notebooks of Lazarus Long.
Robert Heinlein.

Shared Humanity

  • Nilas ice
  • Posts: 1400
    • View Profile
  • Liked: 471
  • Likes Given: 55
Re: Global Surface Air Temperatures
« Reply #2341 on: June 07, 2022, 05:43:23 AM »
Thank you for this KiwiGriff.

Freegrass

  • Young ice
  • Posts: 3857
  • Autodidacticism is a complicated word
    • View Profile
  • Liked: 953
  • Likes Given: 1260
Re: Global Surface Air Temperatures
« Reply #2342 on: June 07, 2022, 09:10:03 AM »
That is indeed an all telling graph. Thanks for that Kiwigriff! So then my initial hunch must be right, that this years temperatures in the Arctic are just another freak of nature... Unless of course increased humidity in the atmosphere is indeed causing the weather to change... But that's an impossibility to prove I guess...
90% of the world is religious, but somehow "love thy neighbour" became "fuck thy neighbours", if they don't agree with your point of view.

WTF happened?

be cause

  • Nilas ice
  • Posts: 2449
    • View Profile
  • Liked: 1017
  • Likes Given: 1045
Re: Global Surface Air Temperatures
« Reply #2343 on: June 07, 2022, 09:58:17 AM »
that telling graph has been appearing here for years .. it's  been needed often ..
« Last Edit: June 07, 2022, 11:13:31 AM by be cause »
There is no death , the Son of God is We .

Freegrass

  • Young ice
  • Posts: 3857
  • Autodidacticism is a complicated word
    • View Profile
  • Liked: 953
  • Likes Given: 1260
Re: Global Surface Air Temperatures
« Reply #2344 on: June 07, 2022, 01:54:05 PM »
that telling graph has been appearing here for years .. it's  been needed often ..
I must have missed that. It ends in 2015, so maybe that was before my time. Good thing it's been rehashed.
90% of the world is religious, but somehow "love thy neighbour" became "fuck thy neighbours", if they don't agree with your point of view.

WTF happened?

be cause

  • Nilas ice
  • Posts: 2449
    • View Profile
  • Liked: 1017
  • Likes Given: 1045
Re: Global Surface Air Temperatures
« Reply #2345 on: June 07, 2022, 03:36:11 PM »
it could certainly do with an update ..
There is no death , the Son of God is We .

kassy

  • Moderator
  • First-year ice
  • Posts: 8311
    • View Profile
  • Liked: 2051
  • Likes Given: 1988
Re: Global Surface Air Temperatures
« Reply #2346 on: June 07, 2022, 04:28:39 PM »
Can´t be too hard just find the yearly SATs and plot them. Scoring the years should not be too hard and you can cross check with one of the links in the ENSO thread.
Þetta minnismerki er til vitnis um að við vitum hvað er að gerast og hvað þarf að gera. Aðeins þú veist hvort við gerðum eitthvað.

Neven

  • Administrator
  • First-year ice
  • Posts: 9503
    • View Profile
    • Arctic Sea Ice Blog
  • Liked: 1336
  • Likes Given: 618
Re: Global Surface Air Temperatures
« Reply #2347 on: June 07, 2022, 04:29:06 PM »
It was updated last on SkS in 2019:

The enemy is within
Don't confuse me with him

E. Smith

gerontocrat

  • Multi-year ice
  • Posts: 20573
    • View Profile
  • Liked: 5304
  • Likes Given: 69
Re: Global Surface Air Temperatures
« Reply #2348 on: June 07, 2022, 04:31:21 PM »
I found the attached graph at....... https://commons.wikimedia.org/wiki/File:20210827_Global_surface_temperature_bar_chart_-_bars_color-coded_by_El_Ni%C3%B1o_and_La_Ni%C3%B1a_intensity.svg

It goes to 2020. It also grades years in several categories from strong el nino to strong la nina

But the message is clear - the only way is UP
"Para a Causa do Povo a Luta Continua!"
"And that's all I'm going to say about that". Forrest Gump
"Damn, I wanted to see what happened next" (Epitaph)

dnem

  • Grease ice
  • Posts: 709
    • View Profile
  • Liked: 319
  • Likes Given: 279
Re: Global Surface Air Temperatures
« Reply #2349 on: June 07, 2022, 05:55:59 PM »
The next El Nino year will almost certainly be the hottest year in the modern record.