Support the Arctic Sea Ice Forum and Blog

Author Topic: The Cause of the Muted Melt of 2013?  (Read 68000 times)

ChrisReynolds

  • Nilas ice
  • Posts: 1764
    • View Profile
    • Dosbat
  • Liked: 20
  • Likes Given: 9
The Cause of the Muted Melt of 2013?
« on: August 08, 2013, 10:27:15 PM »
UPDATE I've placed a question mark in the title of this thread, my reasons are explained here. Basically I am in the process of questioning whether ice dynamics or the Arctic Dipole are the major driver to the post 2007 increase in annual range.
END UPDATE

The reason for the muted melt this year lies in the atmosphere. I should clarify muted, there are various indices and measures that clearly place 2013 in the set of post 2010 years, after 2010's volume loss. However the melt this year is not what it could have been, 2013 seems unlikely to challenge 2011 or 2007 and there is no realistic prospect of it challenging 2012.

Here is why.

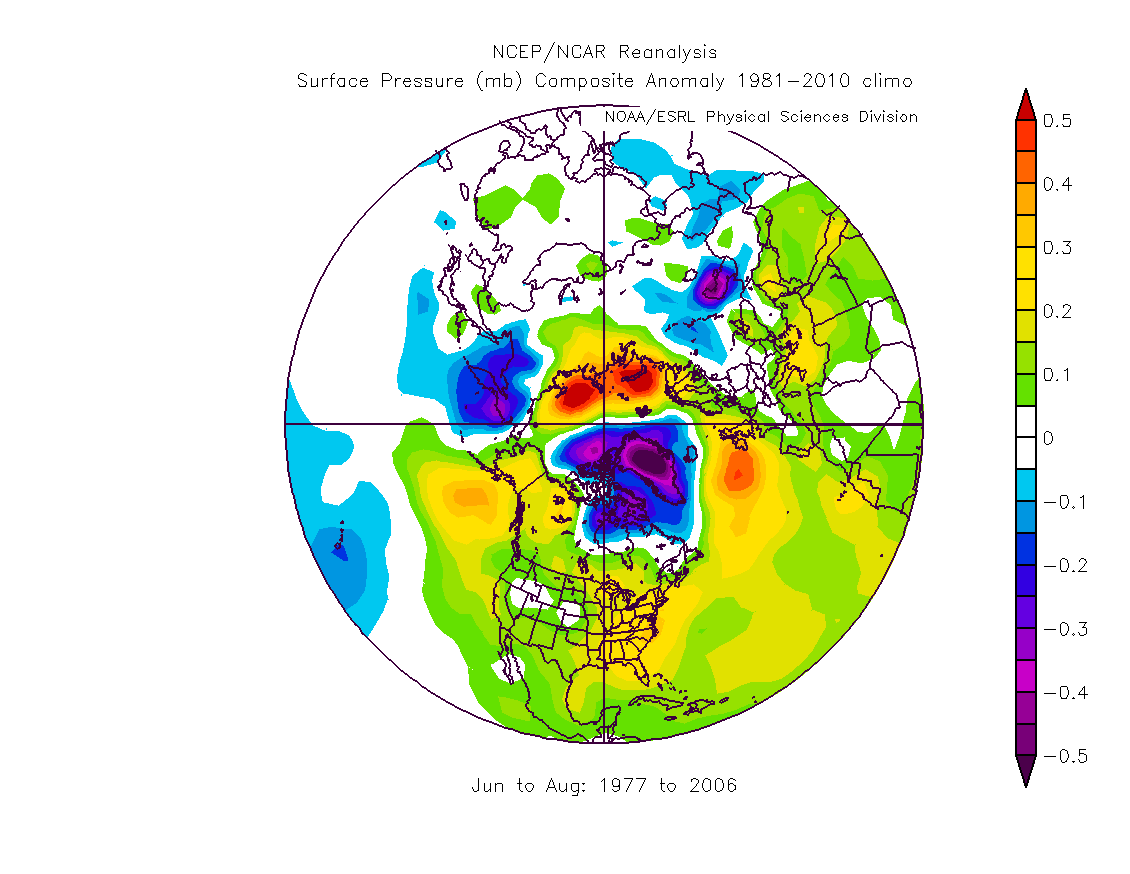
First, here's the average sea level pressure for June to August (JJA) for the pre 2007 period.


Now the June to August average pressure for the period 2007 to 2012, it will become apparent why I've left out 2013 (aside from us not yet having August data).


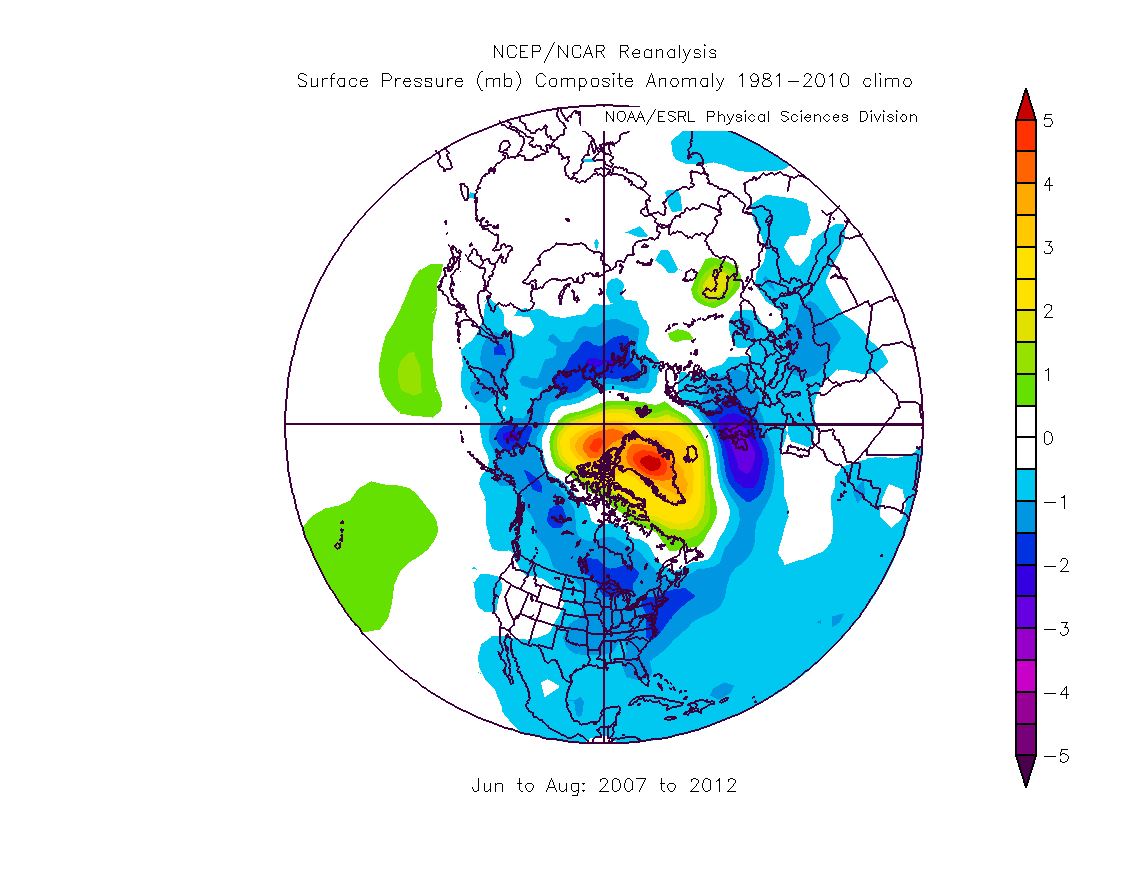
These two patterns can be used as reference patterns using the numeric data behind them. Correlation can be carried out between these two reference patterns and each year's JJA average pressure maps. The result is two timeseries of correlations. A correlation ranges between -1 and 1, figures near zero show little agreement between the two patterns being correlated, figures near -1 show the pattern is the reverse of the reference pattern, figures near +1 show the pattern is a good match for the reference.

Here are the correlations for the last year, 2013 using the June/July average, not June to August.


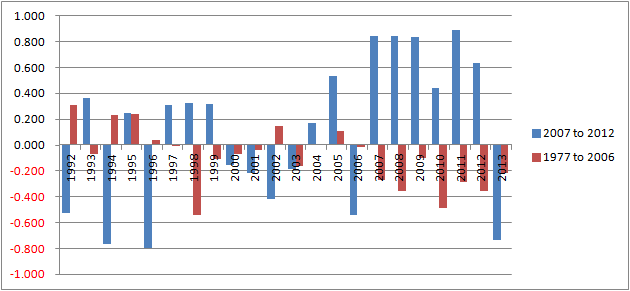
2007 to 2012 show strong correlations, 2010 being reduced due to absence of the summer pattern in July (which is reflected in monthly anomaly changes for CT Area). These strong correlations and anti-correlations mark the post 2007 period out as unusual. However in 2013 June and July show negative correlations, the SLP pattern was reversed from the preceding six years.

The message is clear, take away the summer pattern that has been characteristic of the post 2007 summers, except 2013, and you don't get a massive melt, you get a muted melt. This is because the Dipole Anomaly it causes across the Arctic is absent.

Here is the atmospheric cross section and meridional (North/South) winds for June/July 2007 to 2012.


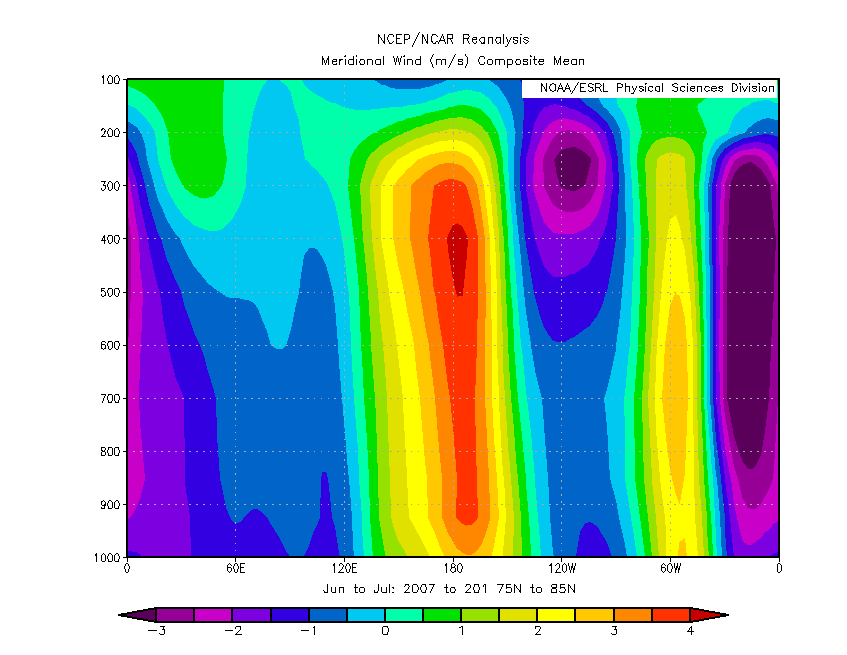
Note the red at 180deg (Chukchi) indicating strong northward inflow. Note the blue/purple outflow southwards between 120E and 30W.

Now 2013 June and July.


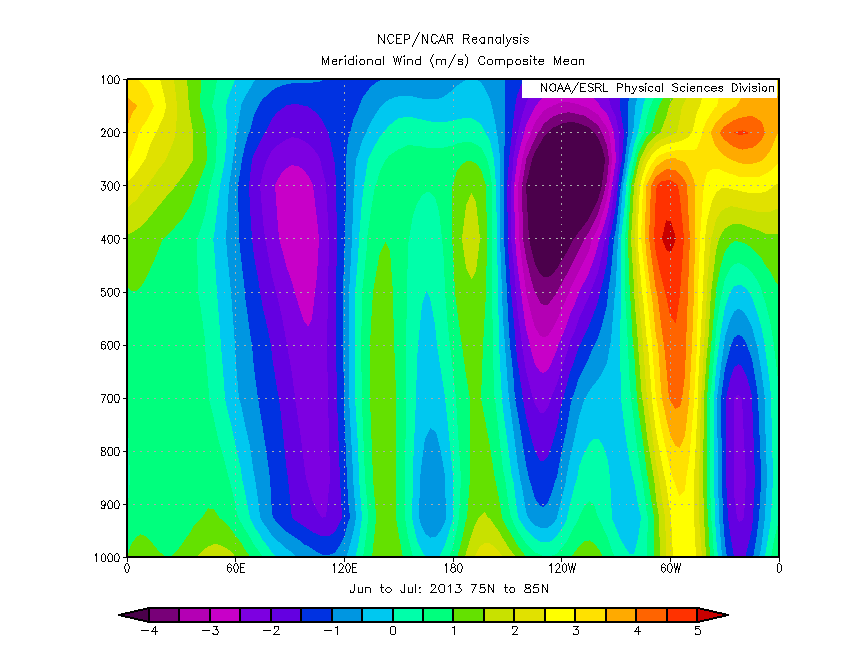
Note the near absence of inflow and outflow in the regions indicated above.

What 2013 is showing is that ice dynamics are not enough, the atmosphere has been playing a strong role in the enhanced melt seasons after 2007.
« Last Edit: August 18, 2013, 05:56:11 PM by ChrisReynolds »

Richard Rathbone

  • Nilas ice
  • Posts: 1730
    • View Profile
  • Liked: 387
  • Likes Given: 24
Re: The Cause of the Muted Melt of 2013
« Reply #1 on: August 08, 2013, 10:52:33 PM »
I wonder if the GCMs are capable of producing your pattern.

Peter Ellis

  • Grease ice
  • Posts: 619
    • View Profile
  • Liked: 33
  • Likes Given: 14
Re: The Cause of the Muted Melt of 2013
« Reply #2 on: August 08, 2013, 10:58:59 PM »
You've got your top two pics the wrong way round.

ChrisReynolds

  • Nilas ice
  • Posts: 1764
    • View Profile
    • Dosbat
  • Liked: 20
  • Likes Given: 9
Re: The Cause of the Muted Melt of 2013
« Reply #3 on: August 08, 2013, 11:03:57 PM »
Richard,

There is a paper by Watanabe that finds a dipole pattern in a GCM, but I've never read of the wider Greenland centred pattern in a model.


Thanks Peter, corrected.

deep octopus

  • Grease ice
  • Posts: 559
    • View Profile
  • Liked: 6
  • Likes Given: 17
Re: The Cause of the Muted Melt of 2013
« Reply #4 on: August 08, 2013, 11:12:05 PM »
Very interesting. This is a reasonable conclusion. It's worth noting how other years with interim record low extents (1990, 1999, 2005) had positive SLP anomalies, while improved years (1996, 2001) have very distinct negative SLP anomalies over the Arctic Ocean. Further analysis on this would be very helpful. I wonder, though, in spite of our flagship metrics for the ice quality (extent, area volume) saying the melt has been muted, there's a possibility that the crudely-measured average thickness will fall tie or slip below 2012 this year. Such would indicate that there's a continuous preconditioning at work. Perhaps the SLP patterns are like an on-off switch, similar to El NiƱo driving record global surface temperatures, and it's the condition of the ice that increases the likelihood of a record low.

ChrisReynolds

  • Nilas ice
  • Posts: 1764
    • View Profile
    • Dosbat
  • Liked: 20
  • Likes Given: 9
Re: The Cause of the Muted Melt of 2013
« Reply #5 on: August 09, 2013, 07:49:30 AM »
Deep Octopus,

I should point out that the graph is of correlation with the patterns (summer average SLP for two periods), it should not be taken as indicating sea level pressure over the Arctic. The correlation is done north of 30degN and is a measure of match between the average patterns in the first two images and the average SLP for June/July/August of each year in the graph.

I don't expect a massive crash this late in the season. If there is one it will be an indicator of the state of the ice (unless we see a massive change in the atmosphere. As I note other indicators do show 2013 to be part of the post 2010 group, e.g. CT Area anomaly change by month. Nothing I am saying here rejects preconditioning and ice dynamics.

AartBluestoke

  • New ice
  • Posts: 15
    • View Profile
  • Liked: 0
  • Likes Given: 0
Re: The Cause of the Muted Melt of 2013
« Reply #6 on: August 09, 2013, 12:10:32 PM »
Muted melt?

Other than the late melting of Kara and Beaufort, both of which will achieve the same (0) area as last year if trends continue, the other regions seem to be following almost exactly the same area pattern as last year ..

( from http://forum.arctic-sea-ice.net/index.php/topic,382.0.html)

BornFromTheVoid

  • Nilas ice
  • Posts: 1339
    • View Profile
  • Liked: 679
  • Likes Given: 299
Re: The Cause of the Muted Melt of 2013
« Reply #7 on: August 09, 2013, 12:43:48 PM »
Here's the JJA NAO since 1979 (JJ for 2013) and the index, based on the W-E pressure gradient around the Fram Strait and to it's north, I made in my undergrad.


Both show quite a shift from from recent years so far...
I recently joined the twitter thing, where I post more analysis, pics and animations: @Icy_Samuel

ChrisReynolds

  • Nilas ice
  • Posts: 1764
    • View Profile
    • Dosbat
  • Liked: 20
  • Likes Given: 9
Re: The Cause of the Muted Melt of 2013
« Reply #8 on: August 09, 2013, 06:38:34 PM »
Thanks Born From The Void, very useful.

AartBluestoke,

PIOMAS Anomalies.

Muted melt.

IARC JAXA Anomalies.

Muted melt.

CT Area Anomalies.

Muted melt.

This year is clearly behind 2007, 2011 and 2012 in terms of area/extent, and is tracking 2010 in terms of volume. In terms of IARC extent it is above 2007, and 2010 to 2012, in terms of CT Area it is currently above all years since 2006!!!

Given the ice state early in the year this is staggering and needs explanation.

Bob Wallace

  • Young ice
  • Posts: 3855
    • View Profile
  • Liked: 41
  • Likes Given: 5
Re: The Cause of the Muted Melt of 2013
« Reply #9 on: August 09, 2013, 07:39:29 PM »
It may turn out that "delayed and slightly subdued" will be a better fit than "muted".

I keep watching the Wipnues extent and area graphs and I'm yet to be convinced the tale is told.

It looks like serious melting is underway in the Beaufort, CA and Siberian.  It's a question of how resistant CAB is is to bottom melting.  And with storms probably bringing more warm water up along with the reported poor condition of the ice, well, the punch bowl has been stirred.

I agree that an explanation of why the melt pattern has been different is important.  But it seems a bit too early to decide that the melt was unusually low.


LurkyMcLurkerson

  • New ice
  • Posts: 27
    • View Profile
  • Liked: 0
  • Likes Given: 0
Re: The Cause of the Muted Melt of 2013
« Reply #10 on: August 09, 2013, 10:41:13 PM »
I still make no predictions about what the final state of things will be, I can honestly argue either for a likely crash coming in the datasets we've got, or against, and both arguments strike me as reasonable.

Something related to this that I've been wondering about is the effect of the early widespread cracking of the ice on atmospheric dynamics this year. Not just the event itself, to be clear -- but also the refreezing process on those cracks, since it was so early, and the overall thermodynamic effect on the surroundings of a massive crack/refreeze/remelt process.

Or the effect of last season's refreezing process, in terms of enthalpy.

I have no answers, but something I'm really trying hard to wrap around is essentially the effect on the atmosphere itself of the ice now being far more responsive seasonally _by percentage of ice_ -- i.e. rather than a relatively stabilizing force on the air temps and pressure, at what point is there little enough ice -- is it "flashy" enough -- that the melting/freezing processes are driving the pressure and temp gradients in a flashy, bouncing-between mode, as well? The percentage of remaining ice that is prone to massive melt or massive refreeze is unprecedented, and that must either release or pull an immense amount of heat to/from the atmosphere with less and less remaining/stable ice to buffer the system well.

Something different this year as opposed to several of the nearby previous years was the _extent_ of the cracking, and its timing. The push/pull of enthalpy across a huge chunk of the atmosphere would be effected by that process, I would think, though it wouldn't necessarily tell us anything about the quality of the ice formed in the cracks, or the overall ability of the formed ice to withstand further stress.

Another feature of this year has been some truly bizarre jet stream behavior at much lower latitudes, starting early. Where I live in CA, this has been the year of the closed low. I mean, like I've never seen, the frequency of them, just stuck off our coast, bringing monsoon where monsoon shouldn't often come. All summer.

So another question that comes to mind is how much the behavior of the jet is interacting in ways that may _temporarily_ take some of the dipole pressure off of the arctic basin -- nature tends, in most of what I've ever studied, to do an awful lot of filtering changes around in an attempt to regain some kind of equilibrium-ish state -- sort of passing the buck, the stress filters through the system, and it can temporarily take some stressful change out of someplace at the expense of someplace else. If the polar atmosphere has swapped for the moment to an older pattern for this year, the jet stream sure missed the memo.

And of course, it always stands as a possibility that other effects from elsewhere have instead effected the polar atmosphere, instead of the polar atmosphere's response being _always_ primarily about the ice and vice versa. By which I mean that the change in the dipole this year as opposed to the last few could have nothing to do with the progression of ice loss in itself, and could be related to some other pattern or effect that has temporarily provided the ice with a bit of an atmospheric buffer. Coincidence of timing with a different pattern.

I dunno. Just random thoughts on a sleepy Friday. I think this is a great thread to start. I'll lurk about reading it with interest, in the hopes that others with lots more meteorology background than mine chime in. Regardless, this has truly been a bizarre year, one I hope we can learn something from as we see how it all plays out.

ChrisReynolds

  • Nilas ice
  • Posts: 1764
    • View Profile
    • Dosbat
  • Liked: 20
  • Likes Given: 9
Re: The Cause of the Muted Melt of 2013
« Reply #11 on: August 10, 2013, 10:16:23 AM »
Lurky,

Ice state is one thing on my mind. However the pattern starts in June and at this stage post 2007 the difference between 2008/09 and previous years isn't much. CT Area seems to pick up melt ponds quite well, and in June (2007, 2010 - 2013) there is a large drop in CT Area anomalies over June. In 2007 this was due to early onset of recession of the ice edge, in 2010 onwards this seems to be due to a large amount of FYI in the Siberian Sector. The problem is it doesn't explain 2008 and 2009, and I've been unable to identify an atmospheric response to this. Although PIOMAS shows a spring melt post 2010 (muted in 2013 - see above).

However there is one paper by Bluthgen that finds that initial ice retreat enhanced by an Arctic Dipole in 2007 is the maintained throughout the summer by sea ice feedbacks.

The issue at the centre of this is the Greenland atmospheric ridge, which is marked since 2007. The atmosphere has been expanding over the NH for the last 30 years, if I subtract the average depth of the atmosphere  north of 30 degN at the 500mb level from the Greenland ridge height the Greenland ridge is seen to jump even more after 2007.

There is a similar behaviour in the atmospheric height over East Siberia, adjacent to the Bering Strait, it appears when one subtracts 500mb height plots for 1977 to 2006 from 2007 to 2013. That happens in May, and again is intensified when considered with reference to overall NH height, however 2011 shows that the ridge fails. So despite it happening in May after 2007 it seems unlikely to be a precursor to the Greenland ridge and resultant summer pattern. There is still some work I need to do on this issue.

Nightvid Cole

  • Frazil ice
  • Posts: 438
    • View Profile
  • Liked: 5
  • Likes Given: 0
Re: The Cause of the Muted Melt of 2013
« Reply #12 on: August 10, 2013, 07:23:04 PM »
Lurky,

Ice state is one thing on my mind. However the pattern starts in June and at this stage post 2007 the difference between 2008/09 and previous years isn't much. CT Area seems to pick up melt ponds quite well, and in June (2007, 2010 - 2013) there is a large drop in CT Area anomalies over June. In 2007 this was due to early onset of recession of the ice edge, in 2010 onwards this seems to be due to a large amount of FYI in the Siberian Sector. The problem is it doesn't explain 2008 and 2009, and I've been unable to identify an atmospheric response to this. Although PIOMAS shows a spring melt post 2010 (muted in 2013 - see above).

However there is one paper by Bluthgen that finds that initial ice retreat enhanced by an Arctic Dipole in 2007 is the maintained throughout the summer by sea ice feedbacks.

The issue at the centre of this is the Greenland atmospheric ridge, which is marked since 2007. The atmosphere has been expanding over the NH for the last 30 years, if I subtract the average depth of the atmosphere  north of 30 degN at the 500mb level from the Greenland ridge height the Greenland ridge is seen to jump even more after 2007.

There is a similar behaviour in the atmospheric height over East Siberia, adjacent to the Bering Strait, it appears when one subtracts 500mb height plots for 1977 to 2006 from 2007 to 2013. That happens in May, and again is intensified when considered with reference to overall NH height, however 2011 shows that the ridge fails. So despite it happening in May after 2007 it seems unlikely to be a precursor to the Greenland ridge and resultant summer pattern. There is still some work I need to do on this issue.

Be careful. Some of these pattern changes could be a result of changes in snow, as opposed to ice.

Steven

  • Grease ice
  • Posts: 957
    • View Profile
    • Arctic sea ice data and graphs
  • Liked: 481
  • Likes Given: 19
Re: The Cause of the Muted Melt of 2013
« Reply #13 on: August 10, 2013, 08:41:02 PM »
it always stands as a possibility that other effects from elsewhere have instead effected the polar atmosphere, instead of the polar atmosphere's response being always primarily about the ice and vice versa.  By which I mean that the change in the dipole this year as opposed to the last few could have nothing to do with the progression of ice loss in itself, and could be related to some other pattern or effect that has temporarily provided the ice with a bit of an atmospheric buffer.

What about the sudden stratospheric warming that occurred in January 2013?  R. Gates suggested that this SSW is similar to one that occurred in January 2006, for example in this blog post from April, or in the comments of this one.  It seems 2013 and 2006 have a somewhat similar spring/summer atmospheric pattern, and the SSW's may be related to that.  Or maybe it's just a coincidence.  There are other people on the forum who probably know more about that.

There was also a major SSW at the beginning of 2009.  Maybe it's one of the reasons why the atmospheric summer pattern in 2009 started later than in the other post 2007 years, leading to the slow start of the Arctic melting season in 2009? 

In any case, there are probably many other factors involved.  Not at least the decadal variations in ocean heat content, ocean currents etc.  It's hard to say if the atmospheric pattern in 2007-2012 will be the new standard in the future, or if it was partly due to a favorable configuration in the decadal patterns.

Something related to this that I've been wondering about is the effect of the early widespread cracking of the ice on atmospheric dynamics this year. Not just the event itself, to be clear -- but also the refreezing process on those cracks, since it was so early, and the overall thermodynamic effect on the surroundings of a massive crack/refreeze/remelt process.

I'm also wondering about that.  If early fracturing becomes more common in the future, then it's important to know if this has an effect on the atmospheric/ocean patterns during the Arctic spring/summer.  2013 could give a hint on that.  It's too early to say.
« Last Edit: August 11, 2013, 07:30:34 AM by Steven »

TerryM

  • First-year ice
  • Posts: 6002
    • View Profile
  • Liked: 893
  • Likes Given: 5
Re: The Cause of the Muted Melt of 2013
« Reply #14 on: August 10, 2013, 09:01:24 PM »
Thanks Steve. The heat vented by the SSW had to make some difference & if there is a historic linkage to other "recovery" years it strengthens the connection.
I also see the fracturing event as being a net gain for the ice.

Terry

LurkyMcLurkerson

  • New ice
  • Posts: 27
    • View Profile
  • Liked: 0
  • Likes Given: 0
Re: The Cause of the Muted Melt of 2013
« Reply #15 on: August 10, 2013, 09:35:11 PM »
it always stands as a possibility that other effects from elsewhere have instead effected the polar atmosphere, instead of the polar atmosphere's response being always primarily about the ice and vice versa.  By which I mean that the change in the dipole this year as opposed to the last few could have nothing to do with the progression of ice loss in itself, and could be related to some other pattern or effect that has temporarily provided the ice with a bit of an atmospheric buffer.

What about the sudden stratospheric warming that occurred in January 2013?  R. Gates suggested that this SSW is similar to one that occurred in January 2006, for example in this blog post from April, or in the comments of this one.  It seems 2013 and 2006 have indeed a somewhat similar atmospheric pattern, and the SSW's may be related to that.  Or maybe it's just a coincidence.  There are other people on the forum who probably know more about that.

There was also a major SSW at the beginning of 2009.  Maybe it's one of the reasons why the atmospheric summer pattern in 2009 started later than in the other post 2007 years, leading to the slow start of the Arctic melting season in 2009? 

In any case, there are probably many other factors involved.  Not at least the decadal variations in ocean heat content, ocean currents etc.  It's hard to say if the atmospheric pattern in 2007-2012 will be the new standard in the future, or if it was partly due to a favorable configuration in the decadal patterns.

Something related to this that I've been wondering about is the effect of the early widespread cracking of the ice on atmospheric dynamics this year. Not just the event itself, to be clear -- but also the refreezing process on those cracks, since it was so early, and the overall thermodynamic effect on the surroundings of a massive crack/refreeze/remelt process.

I'm also wondering about that.  If early fracturing becomes more common in the future, then it's important to know if this has an effect on the atmospheric/ocean patterns during the Arctic spring/summer.  2013 could give a hint on that.  It's too early to say.

The SSW came to mind for me, too, but I have to admit to knowing so little about the atmospheric science involved that I can't even begin to guess how it might play in. I would guess that it could, certainly -- I've poked at the science enough there to note from a few papers that tropical temp and height anomalies tend to be coupled with major SSW events, too, and there look to be ripples all the way to the ionosphere in major SSW events. The complexity of them seems to be amazing. That stuff gets way beyond what my background can do, though, so I can't begin to guess about the longer effects on any particular system. It certainly wouldn't surprise me to find that it plays in somehow with the unusual (in recent terms) weather at the pole this year, though.

It generally will be interesting to see whether the dipole/Greenland ridging that Chris Reynolds has noted turns out to be a strong correlating factor with more rapid ice loss (though in truth, I do worry that at this point the ice is so weak that it will be in bad shape at the end anyway, leaving little room for it to clarify the process as well as if the ice weren't in such death throes -- either a solid crash at the end or simply a setup for dramatic loss next season looks likely to me, though probably more the latter than the former at this point.)

I also wonder whether the ridging drives the ice losses, or whether the pattern of ice loss drives the ridging, honestly. Head scratcher, that, and possible that both are true. We're certainly seeing different _locations_ of higher melt this year, and that could have major effects across the rest of the system, too.

Snow cover hadn't honestly even entered my mind yet, but is also a really good point. So many things to ponder in it!

ChrisReynolds

  • Nilas ice
  • Posts: 1764
    • View Profile
    • Dosbat
  • Liked: 20
  • Likes Given: 9
Re: The Cause of the Muted Melt of 2013
« Reply #16 on: August 11, 2013, 12:34:08 PM »
Nightvid Cole,

The snow issue is as difficult as the ice. Furthermore the snow issue doesn't explain the step jump in 2007, although the behaviour of ice since then could in part be due to the atmosphere.

Steven,

The problem with SSWs is that 2006, 2010 and 2013 all show higher 50mb geopotential heights, by a small margin. In July 2010 the pattern was absent, also in June July and so far August of 2013. 2009 doesn't feature because the correlation for June is 0.678, the following are post 2007 correlations by month, in order (June July August):

2007   0.721    0.741    0.538
2008   0.616    0.772    0.553
2009   0.678    0.780    0.442
2010   0.643    -0.391    0.628
2011   0.795    0.790    0.829
2012   0.626    0.315    0.436
2013   -0.747    -0.076    

The AO Index looks more feasible. Here is the DJF AO Index for recent years.

2005   0.11   
2006   -0.81   <
2007   1.00   
2008   0.86   
2009   0.26   
2010   -3.42   <
2011   -0.91   ?
2012   0.66   
2013   -1.12   <

However as with every other facet I've looked at, there is a problem. Here 2011 had a low AO index over winter, but high correlation with the pattern over the summer.

Terry,

I'm writing a blog post about the thinning of the ice over winter and low level warming. There's a region off Siberia where PIOMAS thickness (inverted) tracks surface temperatures very closely (R2 = 0.7), in other words as the ice thins the air over that ice warms.


The warming and thinning is fairly linear, there's no post 2007 jump, but the post 2007 period shows the relative warming against the baseline (1981 - 2010). It is quite possible that the post 2007 jump in Greenland GPH represents a non linear shift in response to factors such as this warming and snow loss. In that sens the May jump in GPH over eastern Siberia that I mentioned above could also be part of the same atmospheric response.

ChrisReynolds

  • Nilas ice
  • Posts: 1764
    • View Profile
    • Dosbat
  • Liked: 20
  • Likes Given: 9
Re: The Cause of the Muted Melt of 2013
« Reply #17 on: August 11, 2013, 12:42:30 PM »
I also wonder whether the ridging drives the ice losses, or whether the pattern of ice loss drives the ridging, honestly. Head scratcher, that, and possible that both are true. We're certainly seeing different _locations_ of higher melt this year, and that could have major effects across the rest of the system, too.

Snow cover hadn't honestly even entered my mind yet, but is also a really good point. So many things to ponder in it!

The question of whether the ridging drives the ice loss or vice-versa may turn out to be that it works both ways, with the ridging and ensuing dipole over the Arctic being both a result of ice loss and driving ice loss.

Snow cover is the favoured driver suggested by Overland, Wang, Francis and Hanna in a 2012 paper. The problem is if snow cover is the driver it is not overall northern hemisphere cover, since correlation with snow cover does not reveal anything like the summer pattern and Greenland ridging. However the east Siberian ridging I mentioned up thread may be a result of a regional snow cover change, the same may be true for the Greenland ridge. But overall it seems that whatever is happening is likely to be a non-linear response that regression or correlation analysis aren't going to pick up.

FredFriendly

  • New ice
  • Posts: 7
    • View Profile
  • Liked: 0
  • Likes Given: 0
Re: The Cause of the Muted Melt of 2013
« Reply #18 on: August 11, 2013, 03:55:29 PM »
Isn't all this driven in the end by air and sea temperature?  Winds and ridges matter, but in the end it is the amount of ice generated on a year to year basis and the amount melted in place or further south.  This year was very weird from a over 80N temp.  The temp above 80N is almost always very consistent as the sun is up for 24 hours a day and little variation exists.  This year the amount below the average during melt season has been way below the norm (which generally tracks the green line average very closely during melt season):

« Last Edit: August 11, 2013, 04:02:55 PM by FredFriendly »

Shared Humanity

  • Guest
Re: The Cause of the Muted Melt of 2013
« Reply #19 on: August 11, 2013, 04:30:21 PM »
Isn't all this driven in the end by air and sea temperature?  Winds and ridges matter, but in the end it is the amount of ice generated on a year to year basis and the amount melted in place or further south.  This year was very weird from a over 80N temp.  The temp above 80N is almost always very consistent as the sun is up for 24 hours a day and little variation exists.  This year the amount below the average during melt season has been way below the norm (which generally tracks the green line average very closely during melt season):


Fascinating reads on ASI this week were the articles on hothouse climates and the collapse of the 3 cells into a single NH cell. The effect of this would be what the authors described as an "equable" climate. The mid latitude weather would see a reduction in seasonal extremes with generally warmer winters and cooler summers. I have noticed this trend for at least a decade in Chicago. Our winters have become remarkably and  consistently milder as compared to the 1980's. Similarly, we have seen cooler summers. We are currently in our second straight week of high 70's F temperatures with the long term forecast saying this will continue until the end of August. Could this chart actually be capturing this? It shows a warmer than average winter and cooler than average summer. If this trend were to continue or become more persistent year to year, wouldn't the winter freeze be the main focus of interest in terms of the polar ice health?

Might we expect to see a slower refreeze as it relates to PIOMAS? Certainly, surface freeze would be quick but could the warmer temperatures result in a trend of lower mass by the end of the freeze?

Steven

  • Grease ice
  • Posts: 957
    • View Profile
    • Arctic sea ice data and graphs
  • Liked: 481
  • Likes Given: 19
Re: The Cause of the Muted Melt of 2013
« Reply #20 on: August 11, 2013, 04:45:33 PM »
The problem with SSWs is that 2006, 2010 and 2013 all show higher 50mb geopotential heights, by a small margin. In July 2010 the pattern was absent, also in June July and so far August of 2013. 2009 doesn't feature because the correlation for June is 0.678, the following are post 2007 correlations by month, in order (June July August):

Chris, I was referring to the spring and summer patterns.  More precisely, I think it's worth considering the May/June atmospheric pattern separately  (or maybe a weighted mean over the daily data from April/May/June/July).  This gives information on the date at which the snow melts, melt ponds form and the albedo starts to drop, in the period near Summer Solstice.  I think this albedo feedback is important enough to consider it separately. 

The same atmospheric pattern in May or June may have a different net effect on the Arctic sea ice than it has in August. 

In his blog post, R. Gates mentions the SSW's at the beginning of 2013, 2009, 2006, 2003, 2001.  I don't know exactly why he picked these years, since there were major SSW's in other years like 2010.  But anyway, the years in Gates' list are all uptick years for the September mean extent of Arctic sea ice.  This list of years also reminds me of "summer heat in Western Europe", or more precisely, uptick years in the UK summer temperature graph in one of your earlier posts on the forum.  But I don't know where to find the scientific literature about all these possible connections.

SSW's are probably one of several factors that effect the melting of Arctic sea ice.  The timing and nature of the SSW's appear to be important, as well as the different atmospheric/ocean patterns during winter and spring.  I don't know the answers.  But it seems worth looking at in more detail. 

Edit: corrected an error in the third paragraph and stated it more clearly. 
« Last Edit: August 12, 2013, 01:09:10 PM by Steven »

ChrisReynolds

  • Nilas ice
  • Posts: 1764
    • View Profile
    • Dosbat
  • Liked: 20
  • Likes Given: 9
Re: The Cause of the Muted Melt of 2013
« Reply #21 on: August 11, 2013, 04:51:27 PM »
Shared Humanity,

I don't know where the single cell issue was being discussed, but I find that idea hard to believe.

As for the cooler summers, look at the second graphic. Chicago is in the American wing of the low pressure during June July and August due to the post 2007 summer pattern.

Fred Friendly,

Ridges etc matter because they've been driving warmer air input into the Arctic. The lack of this in 2013 is what I'm arguing has caused the cooler temperatures in the graph you post.

ChrisReynolds

  • Nilas ice
  • Posts: 1764
    • View Profile
    • Dosbat
  • Liked: 20
  • Likes Given: 9
Re: The Cause of the Muted Melt of 2013
« Reply #22 on: August 11, 2013, 05:03:55 PM »
Steven,

The graph you linked to that I posted is the difference from the trend of the Central England Temperature series, the drop post 2007 is due to low pressure dominated summers due to the post 2007 summer pattern I'm talking about.

I agree that the spring and summer patterns can be considered separately, but I've been looking for a precursor signature in the atmosphere that precedes the summer pattern and could be used to predict its development (for sea ice prediction) and to try to make the mechanism more clear.

You're correct that SSWs are very common, and could play a role in 2010. Judah Cohen has done work on the 2010 winter and finds that waves initiated by rapid snowline advance in Siberia break in the stratosphere and cause warming. This is the major problem with the article by R Gates. He assumes that the SSWs are due to transport of air, but the air would cool as it rises. A more likely explanation is that he's detecting tropospheric waves that break in the stratosphere compressing air and causing warming.

The main problem with SSWs is establishing a mechanism by which they'd have a lasting atmospheric impact, so as to affect spring/summer conditions. Also I'm not aware of SSWs changing post 2007, although whilst they don't seem to play a role in starting the summer pattern (or the May Siberian ridge) they could feasibly cause conditions that impede the formation of those patterns (both of which show a step change of behaviour in 2007). I'll try to make time to post two graphs in a while.

kynde

  • New ice
  • Posts: 21
    • View Profile
  • Liked: 6
  • Likes Given: 65
Re: The Cause of the Muted Melt of 2013
« Reply #23 on: August 12, 2013, 01:41:00 PM »
Shared Humanity,

I don't know where the single cell issue was being discussed, but I find that idea hard to believe.

I believe he was referring to Bill Langford presentation "Hadley Cell Expansion in Today's Climate and Paleoclimates" (April 28, 2011). I can't remember where exactly it was discussed in here, probably in ASIB (*).
Pdf here: http://www.fields.utoronto.ca/programs/scientific/10-11/biomathstat/Langford_W.pdf

I'm not making any implications here, only pointing it out. It's a fascinating(**) read and certainly warrants some attention. How big a role such a thing is playing in any one melt year is another matter.

EDIT:
(*) found it, it was in the "Second storm" post comments few weeks ago.
(**) understatement for me at least, reading that turned my stomach so bad I had to visit the toilet.
« Last Edit: August 12, 2013, 01:52:13 PM by kynde »

mati

  • Frazil ice
  • Posts: 268
    • View Profile
  • Liked: 1
  • Likes Given: 0
Re: The Cause of the Muted Melt of 2013
« Reply #24 on: August 12, 2013, 04:31:24 PM »
Shared Humanity,

I don't know where the single cell issue was being discussed, but I find that idea hard to believe.

I believe he was referring to Bill Langford presentation "Hadley Cell Expansion in Today's Climate and Paleoclimates" (April 28, 2011). I can't remember where exactly it was discussed in here, probably in ASIB (*).
Pdf here: http://www.fields.utoronto.ca/programs/scientific/10-11/biomathstat/Langford_W.pdf

I'm not making any implications here, only pointing it out. It's a fascinating(**) read and certainly warrants some attention. How big a role such a thing is playing in any one melt year is another matter.

EDIT:
(*) found it, it was in the "Second storm" post comments few weeks ago.
(**) understatement for me at least, reading that turned my stomach so bad I had to visit the toilet.

That was one scary read.  I wonder how close we are to the tipping point of switching to one hadley cell.  If that occurs it has implications for the ice melt at the poles......
and so it goes

Neven

  • Administrator
  • First-year ice
  • Posts: 9470
    • View Profile
    • Arctic Sea Ice Blog
  • Liked: 1333
  • Likes Given: 617
Re: The Cause of the Muted Melt of 2013
« Reply #25 on: August 12, 2013, 04:53:10 PM »
That reminds me of this blog post from 2008 (!) on the Thoughts on the Roof blog.
The enemy is within
Don't confuse me with him

E. Smith

Shared Humanity

  • Guest
Re: The Cause of the Muted Melt of 2013
« Reply #26 on: August 12, 2013, 05:18:53 PM »
Shared Humanity,

I don't know where the single cell issue was being discussed, but I find that idea hard to believe.

I believe he was referring to Bill Langford presentation "Hadley Cell Expansion in Today's Climate and Paleoclimates" (April 28, 2011). I can't remember where exactly it was discussed in here, probably in ASIB (*).
Pdf here: http://www.fields.utoronto.ca/programs/scientific/10-11/biomathstat/Langford_W.pdf

I'm not making any implications here, only pointing it out. It's a fascinating(**) read and certainly warrants some attention. How big a role such a thing is playing in any one melt year is another matter.

EDIT:
(*) found it, it was in the "Second storm" post comments few weeks ago.
(**) understatement for me at least, reading that turned my stomach so bad I had to visit the toilet.

Yes...that's the one. I found it a fascinating read. I believe there was a second link to a more technical research article. The statistics in that one was beyond my comprehension.

The connection I made (purely unscientific) was whether the shrinking of the Ferrel cell and the expansion of the Hadley cell were somehow related to the shift of the jet stream north and already resulting in a more equable climate in the mid-latitudes. This is distinct from weather extremes in a particular season but rather a shrinking of the gap between summer and winter, much warmer winters on average across the NH with a smaller increase in average summer temperatures.
« Last Edit: August 12, 2013, 05:27:36 PM by Shared Humanity »

Steven

  • Grease ice
  • Posts: 957
    • View Profile
    • Arctic sea ice data and graphs
  • Liked: 481
  • Likes Given: 19
Re: The Cause of the Muted Melt of 2013
« Reply #27 on: August 12, 2013, 08:29:33 PM »
This is the major problem with the article by R Gates. He assumes that the SSWs are due to transport of air, but the air would cool as it rises. A more likely explanation is that he's detecting tropospheric waves that break in the stratosphere compressing air and causing warming.

Chris, one of the things I wrote yesterday about R. Gates' list of years was imprecise, so I corrected it in my previous post.  The various relationships are still there, although the underlying mechanisms for the individual years in the list may be different.  I agree it's important to have a realistic physical explanation for how these SSW's, or "tropospheric waves breaking in the stratosphere", or whatever they are, could possibly effect (or impede) the spring /summer atmospheric patterns.  The work by Judah Cohen that you mention looks interesting.  But I am not sure if 2010 is a good comparison with the other years.

Anyway, for 2013, it seems difficult to separate the effects of the SSW, the abundance of FYI, and the early fracturing of the sea ice.  It's hard to distinguish between cause and consequence.  Hopefully there will be more information in September when the melt season ends.

ChrisReynolds

  • Nilas ice
  • Posts: 1764
    • View Profile
    • Dosbat
  • Liked: 20
  • Likes Given: 9
Re: The Cause of the Muted Melt of 2013
« Reply #28 on: August 12, 2013, 08:52:19 PM »
Regards the Bill Langford presentation...

Kynde, thanks for linking to it, fascinating and a lot more persuasive than the initial suggestion seemed.

I've downloaded NCEP/NCAR surface temperatures for the region between 30degN and 30degS (Tropics) and the Arctic (north of 65degN). I've calculated the temperature difference between the datasets by month from 1948 to 2013. I've then calculated a baseline average from 1981 to 2010 (NCEP/NCAR standard baseline) and used this set of averages (one per month) to calculate the anomaly from the baseline. Finally to avoid spaghetification of the graph I've presented the averages for meteorological seasons (e.g. MAM = March,April,May).


The baseline average Arctic/Equator temperature differences are:
MAM   37.07
JJA   19.69
SON   33.84
DJF   45.27

So the observed closure of the pole equator difference is small, so far. If Langford is right, which seems reasonable then for deep convection to start the summer is probably the best bet. Once the sea ice is gone for much of the summer the ocean will start to increase average Arctic temperatures. At present JJA anomalies have levelled after 2007 probably due to the large amounts of ice being melted. Like ice in a drink, once it's gone the drink can start to warm, energy is no longer taken up by melting ice. With a warmer ocean and increased heat flux from the south the Arctic could form a blanket of cloud and start to become more temperate over the winter (Abbot/Tziperman).


I'd love to still be around when that happens, what a thing to witness!  ;D

ChrisReynolds

  • Nilas ice
  • Posts: 1764
    • View Profile
    • Dosbat
  • Liked: 20
  • Likes Given: 9
Re: The Cause of the Muted Melt of 2013
« Reply #29 on: August 12, 2013, 09:04:16 PM »
Steven,

I've blogged a fair bit on Dr Cohen's work.

Here I go over the paper about 2010.
http://dosbat.blogspot.co.uk/2011/10/cold-winters-siberian-snowfall.html

Here I go over a later paper about the Arctic linkage to cold boreal winters.
http://dosbat.blogspot.co.uk/2011/12/cold-winters-arctic-connection.html

2010 was just a classic case of a pattern that's been playing out over recent winters. It happened again this winter from my reading of the data, although it's been some time since I was in regular contact with Dr Cohen (who has seen those posts BTW).

Trying to tease out what's going on is a nightmare. I've got over 200 graphics from NCEP/NCAR and three spreadsheets on the subject outlined in the main post of this thread. Now I have to try to develop an understanding without cluttering my mind further.

It would help if I had proper training.  :o

John Batteen

  • Frazil ice
  • Posts: 225
    • View Profile
  • Liked: 60
  • Likes Given: 3
Re: The Cause of the Muted Melt of 2013
« Reply #30 on: August 13, 2013, 01:22:57 AM »
The connection I made (purely unscientific) was whether the shrinking of the Ferrel cell and the expansion of the Hadley cell were somehow related to the shift of the jet stream north and already resulting in a more equable climate in the mid-latitudes. This is distinct from weather extremes in a particular season but rather a shrinking of the gap between summer and winter, much warmer winters on average across the NH with a smaller increase in average summer temperatures.

As I understand it, this is the case.  This is a highly idealized model of atmospheric circulation, but you can see the location of the subtropical jet is dependent on the Hadley cell.


And the Hadley cells are indeed moving north by up to 2 degrees per decade in the northern hemisphere.

Quote
Recent trends of the tropical hydrological cycle inferred from Global Precipitation Climatology Project and International Satellite Cloud Climatology Project data ā€“ Zhou et al. (2011) ā€œScores of modeling studies have shown that increasing greenhouse gases in the atmosphere impact the global hydrologic cycle; however, disagreements on regional scales are large, and thus the simulated trends of such impacts, even for regions as large as the tropics, remain uncertain. The present investigation attempts to examine such trends in the observations using satellite data products comprising Global Precipitation Climatology Project precipitation and International Satellite Cloud Climatology Project cloud and radiation. Specifically, evolving trends of the tropical hydrological cycle over the last 20ā€“30 years were identified and analyzed. The results show (1) intensification of tropical precipitation in the rising regions of the Walker and Hadley circulations and weakening over the sinking regions of the associated overturning circulation; (2) poleward shift of the subtropical dry zones (up to 2Ā° decadeāˆ’1 in June-July-August (JJA) in the Northern Hemisphere and 0.3ā€“0.7Ā° decadeāˆ’1 in June-July-August and September-October-November in the Southern Hemisphere) consistent with an overall broadening of the Hadley circulation; and (3) significant poleward migration (0.9ā€“1.7Ā° decadeāˆ’1) of cloud boundaries of Hadley cell and plausible narrowing of the high cloudiness in the Intertropical Convergence Zone region in some seasons. These results support findings of some of the previous studies that showed strengthening of the tropical hydrological cycle and expansion of the Hadley cell that are potentially related to the recent global warming trends.ā€ Zhou, Y. P., K.-M. Xu, Y. C. Sud, and A. K. Betts (2011), Recent trends of the tropical hydrological cycle inferred from Global Precipitation Climatology Project and International Satellite Cloud Climatology Project data, J. Geophys. Res., 116, D09101, doi:10.1029/2010JD015197


Chris, great chart!  Could you make one that's absolute rather than relative?  It would be interesting to see how big the temperature differential is and how it changes with the seasons.

ChrisReynolds

  • Nilas ice
  • Posts: 1764
    • View Profile
    • Dosbat
  • Liked: 20
  • Likes Given: 9
Re: The Cause of the Muted Melt of 2013
« Reply #31 on: August 13, 2013, 07:41:02 AM »
John,

I've done it as anomalies because otherwise there are just four lines that look straight, but I gave the averages around which those anomaly lines vary.

If you still want an actual temperature graph I can do it tonight.

John Batteen

  • Frazil ice
  • Posts: 225
    • View Profile
  • Liked: 60
  • Likes Given: 3
Re: The Cause of the Muted Melt of 2013
« Reply #32 on: August 13, 2013, 03:37:46 PM »
Actually my curiosity could be satisfied without a chart now that I think about it.  I just want  to know how big the temperature difference is between the equator and the Arctic and how it changes with the seasons.  What are the numbers from which you computed the anomalies for each of the four meteorological seasons?

Thanks!!

ChrisReynolds

  • Nilas ice
  • Posts: 1764
    • View Profile
    • Dosbat
  • Liked: 20
  • Likes Given: 9
Re: The Cause of the Muted Melt of 2013
« Reply #33 on: August 13, 2013, 06:30:29 PM »
John,

Let's see if this works....

   Pole Equator Temperature difference                                 
   Jan   Feb   Mar   Apr   May   Jun   Jul   Aug   Sep   Oct   Nov   Dec
1948   48.767   48.669   46.116   38.232   27.183   20.382   17.863   19.750   25.495   32.716   40.854   50.017
1949   48.991   47.876   42.872   38.814   28.903   21.147   17.890   19.600   25.055   33.125   41.381   45.038
1950   48.722   48.870   43.546   37.769   27.507   20.429   17.770   19.523   26.369   35.416   42.928   47.528
1951   51.550   50.721   45.047   37.308   27.548   20.692   18.017   19.555   25.159   35.132   44.298   47.267
1952   49.682   48.357   46.684   38.228   27.646   20.624   17.593   19.910   25.821   36.211   43.357   47.166
1953   49.352   48.497   47.511   35.887   27.388   20.194   17.392   19.120   25.804   35.743   41.731   47.026
1954   48.452   49.222   45.831   36.514   27.695   20.284   16.938   18.027   25.245   33.363   41.822   45.921
1955   47.030   50.875   46.592   37.839   29.250   20.308   17.501   19.296   25.570   33.937   44.351   47.843
1956   47.571   46.781   44.608   38.188   29.014   20.347   17.052   19.758   26.197   36.361   42.121   44.317
1957   46.886   47.512   45.104   36.829   28.104   20.799   17.569   19.063   26.355   34.262   44.262   49.669
1958   47.245   48.732   45.738   40.107   29.771   21.281   17.775   19.497   26.165   35.192   44.219   46.843
1959   47.617   47.380   45.247   38.635   28.874   21.016   18.138   19.613   26.071   35.001   41.051   46.793
1960   47.709   48.900   45.960   39.283   28.165   20.390   17.388   19.758   26.099   35.440   43.671   44.740
1961   48.397   49.163   47.035   39.230   29.728   20.958   17.673   20.121   26.339   34.643   42.903   47.391
1962   47.047   47.570   43.929   37.928   30.284   21.336   17.808   19.891   27.031   35.940   42.171   46.855
1963   48.043   48.269   48.136   38.676   29.346   21.639   18.518   20.160   27.082   36.378   43.804   46.058
1964   50.212   47.253   48.280   40.590   30.425   21.242   17.976   19.549   26.787   35.629   43.821   46.420
1965   48.694   48.768   44.902   37.971   29.403   21.449   17.886   19.943   27.017   36.817   41.645   48.111
1966   51.151   50.512   48.181   40.129   29.593   21.218   18.271   19.369   26.218   37.103   42.741   44.889
1967   48.962   49.743   44.522   38.180   28.587   21.762   18.213   20.174   25.868   34.709   42.931   45.218
1968   48.074   47.980   44.372   37.836   29.197   21.539   18.567   20.035   26.357   35.416   45.653   49.010
1969   48.417   49.585   48.467   40.392   30.228   22.061   18.349   19.962   26.588   34.975   42.965   44.470
1970   47.992   48.404   45.150   40.452   30.131   21.989   18.049   20.394   25.937   35.794   42.488   46.705
1971   49.679   47.500   44.825   39.026   28.964   20.974   17.713   19.384   25.387   34.950   42.657   46.992
1972   47.947   48.761   45.265   39.244   29.933   22.165   18.425   20.350   26.829   35.395   44.597   46.741
1973   47.711   48.975   46.241   38.492   29.682   21.434   18.196   19.621   26.298   35.356   42.466   46.765
1974   46.657   49.095   43.898   38.542   29.224   21.632   17.586   19.454   26.428   35.406   44.490   47.865
1975   49.232   46.755   45.101   37.861   28.858   21.149   18.191   19.572   26.927   35.330   43.188   45.912
1976   47.360   47.505   43.666   37.262   29.862   21.718   18.570   19.940   25.404   36.321   43.267   47.027
1977   45.158   49.238   47.599   38.724   28.676   21.541   18.310   19.880   26.365   35.961   42.638   46.723
1978   48.155   48.618   45.991   39.515   30.213   22.947   18.697   20.317   26.548   35.937   42.172   47.016
1979   48.052   52.472   46.722   40.133   29.846   22.134   18.001   20.026   26.705   35.980   42.307   46.228
1980   46.736   45.632   44.359   39.160   28.992   21.467   18.458   19.661   27.022   34.174   44.167   46.387
1981   44.546   46.344   44.555   37.881   28.681   21.025   18.258   19.250   26.421   33.916   40.316   44.860
1982   49.555   46.496   45.761   39.072   30.388   22.026   18.227   20.256   27.089   36.362   44.177   46.544
1983   48.623   48.787   44.710   39.764   30.236   21.928   18.443   20.197   26.641   36.266   42.407   45.294
1984   46.348   48.076   45.780   39.899   29.104   20.980   17.584   20.369   25.982   34.448   42.992   45.795
1985   46.697   48.510   45.900   40.278   29.462   21.068   18.317   20.081   26.099   35.599   41.225   44.724
1986   48.966   46.449   46.181   39.743   29.363   21.702   18.503   20.612   27.195   35.652   42.322   46.832
1987   48.176   50.290   46.646   39.910   30.126   22.110   18.571   20.461   27.795   35.425   44.744   47.404
1988   48.000   47.175   45.490   39.661   28.948   21.444   17.708   20.143   26.136   35.193   43.627   45.443
1989   50.116   44.832   44.417   37.849   29.266   21.058   18.186   19.463   26.039   35.517   43.787   45.676
1990   47.700   48.075   43.214   36.379   27.434   20.677   17.675   19.744   26.255   35.984   44.990   47.795
1991   47.223   47.991   45.193   38.880   28.235   21.105   17.537   19.452   25.683   34.617   42.114   45.862
1992   47.954   47.624   43.588   39.192   29.528   22.011   18.431   20.450   27.135   35.801   42.813   45.405
1993   47.409   45.907   45.505   38.170   28.541   20.883   17.727   20.058   26.238   34.798   42.391   48.118
1994   48.784   47.403   45.514   37.810   28.726   21.137   17.641   19.779   26.511   34.328   43.541   46.531
1995   46.888   45.268   45.297   35.191   28.038   21.219   18.361   19.516   25.124   34.100   40.702   46.999
1996   47.250   46.654   43.133   37.335   28.901   22.170   18.386   20.554   26.786   35.709   39.109   45.637
1997   48.987   48.342   43.387   37.500   29.123   21.704   18.481   20.401   25.325   33.536   41.231   46.543
1998   47.355   49.888   44.035   37.234   29.609   21.635   17.606   19.630   25.716   34.995   40.704   44.556
1999   47.757   46.823   44.425   37.690   29.392   21.779   18.127   19.812   25.247   34.679   40.919   44.342
2000   46.399   44.755   42.797   36.602   29.292   21.425   18.051   19.758   25.683   33.727   40.649   44.634
2001   46.085   45.519   44.982   38.385   29.674   21.784   17.825   19.429   24.931   33.979   40.404   42.911
2002   46.670   48.856   42.606   38.173   28.495   21.077   18.009   19.267   25.174   32.570   40.488   43.705
2003   46.226   47.616   43.563   36.585   28.117   21.668   17.568   18.879   24.128   32.072   40.484   44.240
2004   46.571   47.912   45.250   36.588   28.184   21.343   17.463   19.270   25.164   33.657   41.376   46.194
2005   44.268   44.799   43.500   37.342   27.791   20.917   17.939   19.434   24.958   32.527   39.551   43.414
2006   46.102   44.841   43.804   37.455   26.958   21.277   17.769   19.275   24.058   32.659   40.332   43.696
2007   45.782   46.697   44.327   34.977   29.077   20.824   17.346   18.717   24.257   30.889   39.969   43.316
2008   46.733   46.304   44.767   37.344   27.791   21.134   17.762   19.225   24.452   32.800   40.798   43.849
2009   44.986   47.521   45.164   37.670   28.018   21.534   17.893   19.399   24.410   32.497   40.856   43.863
2010   46.711   46.390   43.475   35.431   27.031   21.022   17.203   19.030   24.384   31.836   39.018   44.054
2011   44.800   46.234   41.434   36.793   27.862   20.437   17.237   18.922   23.946   31.957   40.542   43.549
2012   45.454   44.755   44.562   36.457   27.825   19.821   17.000   19.166   23.585   31.642   39.585   44.906
2013   46.459   48.546   44.652   36.457   28.735   20.651   17.425               

ChrisReynolds

  • Nilas ice
  • Posts: 1764
    • View Profile
    • Dosbat
  • Liked: 20
  • Likes Given: 9
Re: The Cause of the Muted Melt of 2013
« Reply #34 on: August 13, 2013, 06:39:13 PM »
OK!

As it worked, and should be readily useable, e.g. copy into Excel, here's what it is.

Using this site.
http://www.esrl.noaa.gov/psd/cgi-bin/data/timeseries/timeseries1.pl

I've selected Monthly, Jan-Dec, AreaWeightGrids=Yes, and output format as raw data. The tropics have been done as longitude 0 to 360, latitude -30 to +30. The Arctic as longitude 0 to 360, latitude 65 to 90. The above table is simply the difference  between the two resultant tables - i.e. Tropics minus Arctic. Figures in degC, but are not anomalies, are actual values.

I did dither over whether I should choose tropics as 0 to +30degrees latitude (i.e. NH only). But in the end decided to choose both north and southern hemispheres. The tropics move north and south with the seasons, taking the full average of both sides seemed best. I don't think there's a right answer here. But if anyone disagrees they have the option to download their own data and process as sees fit.

Steve Bloom

  • New ice
  • Posts: 20
    • View Profile
  • Liked: 0
  • Likes Given: 0
Re: The Cause of the Muted Melt of 2013
« Reply #35 on: August 14, 2013, 08:31:55 AM »
I rooted around a bit and found this MS thesis (of a Lewis grad student) from December, which seems to contain a few more recent developments (on the theory side, anyway):  https://ir.library.dc-uoit.ca/bitstream/10155/299/1/Babalola_David.pdf.

But note that it refers to the future work mentioned in the Langford slide show as still being in the future, which is a bit disappointing to all of us.  I hate to bother people in this way, but I'm very tempted to email Langford and ask him what's going on.

Chris, above you say that the decrease in pole-equator temp difference is as yet pretty small, but small relative to what?

You also mention expecting to see convection starting up at the pole assuming the transition to a single cell actually occurs, but is convection the right word given that the pole will be where the descending branch is?  Or were you referring to the two-cell state?

Thinking about all of this more in terms of a question I had a couple months back, these authors do seem to propose that the transition from current to Pliocene-like climate discussed by Ballantyne et al. should indeed be abrupt... although, relative to human lifetimes, how abrupt is abrupt?

Possible irony:  Is this basically quite scary material not the sort of mathematically rigorous modeling work that the denialists have been demanding?

I looked around for a free copy of the 2009 Hadley cell paper by Langford and Lewis (http://www.math.ualberta.ca/ami/CAMQ/table_of_content/vol_17/17_1e.htm) and couldn't find one.  Anyone?  But I suppose it's a good excuse to email Langford.

While looking for it, BTW, I came across this interesting slide show discussing some of the other metrics relating to the Hadley cell expansion:  http://coaps.fsu.edu/scatterometry/meeting/docs/2013/Surface%20Fluxes/Yu-Talk2-OVWST-2013-OAFlux.pdf.

Laurent

  • Young ice
  • Posts: 2546
    • View Profile
  • Liked: 13
  • Likes Given: 50
Re: The Cause of the Muted Melt of 2013
« Reply #36 on: August 14, 2013, 10:39:51 AM »
It appears to me that the atlantic is taking over the Fram strait. It seems to me there was less movement toward the fram this year (?). The atlantic seem to insulate the arctic keeping the cold where it is (?). At the same time, (if true) it does reduce the amount of heat from the pacific.

John Batteen

  • Frazil ice
  • Posts: 225
    • View Profile
  • Liked: 60
  • Likes Given: 3
Re: The Cause of the Muted Melt of 2013
« Reply #37 on: August 14, 2013, 04:06:57 PM »
I also found the Langfor paper fascinating, hence my interest in the temp difference.  Using the website Chris gave me (thanks!), I made my own chart to display the info I was looking for.  I am using LibreOffice rather than Excel, and I can't copy/paste the data from the site straight into LibreOffice.  Each row goes into one cell and I have to retype it into separate cells.  Quite a pain.  Thus, rather than doing an analysis each month of the year, I have chosen summer as Jul-Aug and winter as Jan-Feb.  I'd love to have a bit higher resolution on this and maybe some day I will have the time to retype all that but as it is now I'm happy with this.  It took me some time to make.

I'm actually surprised to see that the summertime pole/equator temp difference hasn't really changed any since 1948.  The wintertime decline is obvious but nothing much going on in the summer.  Could this mean that there's a different explanation for the increase in blocking patterns?  Or have summertime blocking patterns always been common and it's just fall/winter/spring that are growing in frequency?  Or maybe I have chosen the wrong latitudes to see the summertime temp diff change?  The thought occurred to me I could go a bit further south for my polar temps.

I'm guessing that since all the extra heat energy going north is being used to melt ice, the summer temperature differential won't really start to grow until all the Arctic ice is gone.  I'm not sure if the atmosphere could switch from triple to single cell circulation seasonally, or if once it made the jump in summer it would stay.  But at any rate, it appears that such a flop is a ways away.

This is all pretty speculative.


Shared Humanity

  • Guest
Re: The Cause of the Muted Melt of 2013
« Reply #38 on: August 14, 2013, 09:27:53 PM »
One question I have is, as the Hadley cell expands, will it be at the expense of the Ferrel and Polar cells equally or will one or the other see more shrinkage? The reason I am asking this is, if it is the Ferrel cell that ultimately disappears, then I see us rapidly switching to a single cell with upwelling at the equator and downwelling at the pole. If the polar cell disappears then a stable two cell could be the end result with upwelling at the equator, downwelling somewhere in the mid latitudes and upwelling at the pole.

I have no idea if this is a stupid question or not. What would the two scenarios mean as to northern hemisphere weather?

ChrisReynolds

  • Nilas ice
  • Posts: 1764
    • View Profile
    • Dosbat
  • Liked: 20
  • Likes Given: 9
Re: The Cause of the Muted Melt of 2013
« Reply #39 on: August 14, 2013, 09:52:43 PM »
Steve,

The decrease is small relative the size of the pole equator temperature difference. I think you misunderstand what I was saying about transition to one cell. I'm not saying it will start at the Arctic, merely that the Arctic warming is so large, and future potential warming so large, that it will probably be initiated by warming at the Arctic end.

I think abrupt means that after a lot more warming, I can't say how much, it could transition to a new state within as little as one year to a decade or so. But further work on that model would help answer that.

John,

Think about the causes of warming in seasons, in Autumn the warming is due to more open water and thinner ice. In winter thinner ice seems to be causing the warming over the pack - the atmospheric profile is of a low level warming, not the sort of deep warming associated with atmospheric heat transport increases (well not mainly).

For example, consider the winter warming shown in this plot.


I've used the region 30E to 190E, north of 70N, which pretty much covers the warming area over the Arctic ocean. The atmospheric warming profile is as the next plot, which shows the warming is concentrated at the surface, although there may be a component of atmospheric heat transport revealed by the warming further up in the atmosphere.


For that region I've calculated PIOMAS ice thickness to 2012 (can't do 2013 as they've not updated the concentration data only thickness).


The warming tracks the thinning closely. One might think this is due to warming thinning the ice, but the ice in this sector has been thinned by the process of loss of thick multi year ice, this is not just the landfast ice.

So in the winter warming is probably due to ice loss/thinning, this also applies in autumn and spring. But in the summer temperatures over the pack are pegged near zero due to melting ice. So there's less warming in summer, the energy goes into melting more ice not warming.

ChrisReynolds

  • Nilas ice
  • Posts: 1764
    • View Profile
    • Dosbat
  • Liked: 20
  • Likes Given: 9
Re: The Cause of the Muted Melt of 2013
« Reply #40 on: August 14, 2013, 09:56:48 PM »
Shared Humanity,

From my understanding the end result would be upwelling at the equator and downwelling at the pole. I don't know what this would mean for NH weather.

Apologies all if I've missed anything, feel free to prompt me, just had a long day and am very tired.

Richard Rathbone

  • Nilas ice
  • Posts: 1730
    • View Profile
  • Liked: 387
  • Likes Given: 24
Re: The Cause of the Muted Melt of 2013
« Reply #41 on: August 15, 2013, 12:51:46 AM »
One question I have is, as the Hadley cell expands, will it be at the expense of the Ferrel and Polar cells equally or will one or the other see more shrinkage? The reason I am asking this is, if it is the Ferrel cell that ultimately disappears, then I see us rapidly switching to a single cell with upwelling at the equator and downwelling at the pole. If the polar cell disappears then a stable two cell could be the end result with upwelling at the equator, downwelling somewhere in the mid latitudes and upwelling at the pole.

I have no idea if this is a stupid question or not. What would the two scenarios mean as to northern hemisphere weather?

For convective heat transport to be from the equator and to the pole, there has to be an odd number of cells. An even number of cells means something really weird is going on and I don't see how it could be stable for any length of time. A single cell means tropical weather everywhere.

Dromicosuchus

  • New ice
  • Posts: 48
  • Biophilia
    • View Profile
    • The Songs of Dejerara
  • Liked: 0
  • Likes Given: 0
Re: The Cause of the Muted Melt of 2013
« Reply #42 on: August 15, 2013, 01:42:22 AM »
Richard Rathbone:  I have no idea if something like this is possible on Earth, but I can imagine a two-cell configuration surviving in a situation somewhat similar to the current continental configuration, with cold continents surrounding a warm (due to oceanic currents) polar ocean.  If the oceanic heat transport were great enough, you might be able to manage air rising over a warm polar ocean and over the equator, and then descending somewhere between the two.  Again, though, no idea if the current continental and seabed configuration would allow something like that for Earth under any plausible climate state.

prokaryotes

  • Frazil ice
  • Posts: 284
    • View Profile
    • Climate State
  • Liked: 47
  • Likes Given: 37
Re: The Cause of the Muted Melt of 2013
« Reply #43 on: August 15, 2013, 02:00:57 AM »
I did not read into this but my guess would be things like increased freshwater influx, which insulates the sea ice and makes warmer water sink.

johnm33

  • Guest
Re: The Cause of the Muted Melt of 2013
« Reply #44 on: August 15, 2013, 11:58:20 AM »
Just throwing in the thought that perhaps the arctic cell could shrink to the size of a permanent cyclone centered on the pole. Is it saturn that has a permanent hexagonal storm going on at its pole?

TeaPotty

  • Frazil ice
  • Posts: 322
    • View Profile
  • Liked: 79
  • Likes Given: 121
Re: The Cause of the Muted Melt of 2013
« Reply #45 on: August 15, 2013, 07:17:34 PM »
Looks like its about to get quite toasty up there...  :o
Surface temperatures should be about 2-3 degrees higher I believe.

17th:

18th:

19th:

20th:

21st:

22nd:
« Last Edit: August 15, 2013, 09:19:26 PM by TeaPotty »

Andreas T

  • Nilas ice
  • Posts: 1149
    • View Profile
  • Liked: 18
  • Likes Given: 4
Re: The Cause of the Muted Melt of 2013
« Reply #46 on: August 15, 2013, 09:42:16 PM »
Looking at the GFS 2m temperature maps at Wetterzentrale temperatures are lower. Still getting above 0 deg C but not like the 850 temps, why do you choose those?

TeaPotty

  • Frazil ice
  • Posts: 322
    • View Profile
  • Liked: 79
  • Likes Given: 121
Re: The Cause of the Muted Melt of 2013
« Reply #47 on: August 15, 2013, 09:49:05 PM »
I'm quite a n00b at this, so any suggestions are happily taken  :)

Trying to learn. So, what's better to use?

ChrisReynolds

  • Nilas ice
  • Posts: 1764
    • View Profile
    • Dosbat
  • Liked: 20
  • Likes Given: 9
Re: The Cause of the Muted Melt of 2013
« Reply #48 on: August 15, 2013, 11:05:31 PM »
Andreas, T Potty,

850 mb is in the lower troposphere, it may be indicative of influx of warm air from lower latitudes, Wetterzentrale (WZ) doesn't do 500mb to check if the apparent influx is higher within the troposphere. 2m temperature from WZ is problematic because the melt of ice tends to peg temperatures at zero, or thereabouts. It is worth using WZ's archive to check to see how unusual things are - I see a lot of cases round here of people getting excited about things that aren't that unusual. NCEP/NCAR really is a good tool to get used to using, it only gives past data but you can use anomalies and timeseries to get a picture of what's odd.

Links to NCEP/NCAR data.
Monthly/Seasonal.
http://www.esrl.noaa.gov/psd/cgi-bin/data/composites/printpage.pl
Daily.
http://www.esrl.noaa.gov/psd/data/composites/day/
Timeseries.
http://www.esrl.noaa.gov/psd/cgi-bin/data/timeseries/timeseries1.pl

What I'm seeing isn't unusual for August in my opinion.

Vergent

  • Grease ice
  • Posts: 574
    • View Profile
  • Liked: 2
  • Likes Given: 2
Re: The Cause of the Muted Melt of 2013
« Reply #49 on: August 17, 2013, 09:22:36 PM »