Support the Arctic Sea Ice Forum and Blog

Author Topic: The 2014 Melting Season  (Read 1797467 times)

seattlerocks

  • Frazil ice
  • Posts: 100
    • View Profile
  • Liked: 0
  • Likes Given: 0
Re: The 2014 Melting Season
« Reply #1600 on: June 26, 2014, 04:06:11 PM »
Good day,
Lurking as usual, I was hoping find a weather analysis. I saw A lot of HP next 5 days but I dont know how to interpret it. Hey, not demanding, simply appreciating your work. Thank you guys.

iceman

  • Frazil ice
  • Posts: 285
    • View Profile
  • Liked: 7
  • Likes Given: 19
Re: The 2014 Melting Season
« Reply #1601 on: June 26, 2014, 04:34:12 PM »
The constraint on this melt season that can not be ignored is the low mean temperature.
It also appears as though ice movement (including Fram Strait export) has been anomalously low.  I don't see a way to set up y/y comparisons of the CICE speed and drift animations, but since late May it's been rather still with only brief swirls.
http://www7320.nrlssc.navy.mil/hycomARC/navo/arcticicespddrf_nowcast_anim30d.gif

DavidR

  • Grease ice
  • Posts: 740
    • View Profile
  • Liked: 36
  • Likes Given: 3
Re: The 2014 Melting Season
« Reply #1602 on: June 26, 2014, 04:50:04 PM »
Melt ponds form on first year, (flat) ice. First year ice probably melts out. Therefore melt  ponds are a good predictor of melt.
It's what  happens in August that  matters and NOBODY can predict that.  What  we can be confident  of this year is that  when sea ice extent reaches 7.750  M Km2 we should hang on to  our hats as the SIE  plummets past 2012.
Toto, I've a feeling we're not in Kansas anymore

BornFromTheVoid

  • Nilas ice
  • Posts: 1339
    • View Profile
  • Liked: 679
  • Likes Given: 299
Re: The 2014 Melting Season
« Reply #1603 on: June 26, 2014, 04:56:01 PM »
Dipping toward the late June/early July melt rate max. Will we join 2007 and 2013 with a mega melt week for early July (>1 million km2)?


As we approach July, we're at the point where warm air pulses into the Arctic ocean can cause some  large losses of extent, rather than just thinning and drops in concentration.
The current forecast does show high pressure moving in and becoming quite widespread, but unlike early July 2013, late June 2012 or late June/early July 2007, the current forecast high pressure doesn't carry much in the way of significant warmth with it, just a brief pulse of warm air along the Laptev sea.

Widespread high pressure just 4 days away


850hPa temperature anomalies not overly positive though.


June 30th 2014 vs 2012


Of course, with the ice as fragile as it is, even close to average temperatures will cause lots of melting at this time of year, especially when coupled with clear skies. We also have plenty of warmth over Hudson Bay, which still has around 900k to lose, and close to average temperatures over the weak looking ice in the Kara sea could do a lot of damage there (~800k remaining here)

So I'd say that despite the high pressure, weather conditions aren't massively conducive to rapid melting. But with the ice as thin as it is, it doesn't take a whole lot to do significant damage these days.
I recently joined the twitter thing, where I post more analysis, pics and animations: @Icy_Samuel

werther

  • Grease ice
  • Posts: 747
    • View Profile
  • Liked: 31
  • Likes Given: 0
Re: The 2014 Melting Season
« Reply #1604 on: June 26, 2014, 05:04:39 PM »
The constraint on this melt season that can not be ignored is the low mean temperature. At first I thought it would just be an aspect of importance for the CAB. DMI showing lower than mean temps for +80dNorth.
But after checking NCEP/NCAR it looks like it is a constraint for a large part of the Arctic Ocean.
The only Arctic Sea with higher temps compared to '12 during the last few days was Hudson Bay. And a small part of CAB near the Beaufort Sea.
Last year had even lower mean temps, but was considerably warmer on the Barentsz side...

Bottom line... the Arctic is, as ever, an intriguing place.

To get some more perspective, I used NCEP/NCAR data for the period corresponding to the DMI 'dip', which started about 11 May. That produces this map for this year:


(the right bar is in Kelvin, 3 steps 3dK, 273 = app. freeze-temp)

It gives a good idea of the area that had mean temps below zero for the period.

Having done that, I got the same for these dates in the haul 2000 - 2014.

This is the result in an excel graph:


(the left bar is in K km2's)

Of course I've been contemplating this. There are many aspects. I'd be honoured to hear any opinions.

deep octopus

  • Grease ice
  • Posts: 559
    • View Profile
  • Liked: 6
  • Likes Given: 17
Re: The 2014 Melting Season
« Reply #1605 on: June 26, 2014, 05:05:10 PM »
Prolonged exposure to sunlight and warm temperatures throughout the summer will really make a difference. It may come down to the final weeks–as bottom melt reigns in late July and August, and the ice's thinnest points are the most vulnerable to sudden changes (such as GAC 2012)–but there is no replacement for having the primer to lead into those weeks. Those formative days in May, June, and early July during peak insolation matter when the weather does persist. As 2013 showed, the brief and infrequent periods of clear skies and warm air intrusions that did appear amidst an overall cool and cloudy summer were simply not enough, and extent finished around 2009 levels. I think 2014 stands a good chance of finishing around 2007/2011 extent levels, if the most melt-conducive of weather we've seen thus far can persist. That said, the temperature has been average at best recently. 2012 is simply a very high threshold to attain; and I'll let the ice surprise me on the low end, rather than raise my expectations like I and a lot of others did last year.

Phil.

  • Grease ice
  • Posts: 542
    • View Profile
  • Liked: 76
  • Likes Given: 11
Re: The 2014 Melting Season
« Reply #1606 on: June 26, 2014, 05:32:05 PM »
Hi Jim slightly off topic but I always find your "days area below X' graphs interesting, any chance of updating them?  Thanks

Bruce

  • Frazil ice
  • Posts: 132
    • View Profile
  • Liked: 0
  • Likes Given: 0
Re: The 2014 Melting Season
« Reply #1607 on: June 26, 2014, 05:35:05 PM »
Of course I've been contemplating this. There are many aspects. I'd be honoured to hear any opinions.

This is very interesting, but I don't think I understand the final graph. Did you integrate the temperature from the previous plot over area (i.e., Integral(Temp * dA))? Did you then normalize by something? Else, why are the units on the vertical axis in the 10K range -- shouldn't they be ~ 10e6km^2 * 273K = 2.73e9?

Oh, wait, maybe I get it -- did you integrate only the area that was below freezing for the entire time window?

Tor Bejnar

  • Young ice
  • Posts: 4606
    • View Profile
  • Liked: 879
  • Likes Given: 826
Re: The 2014 Melting Season
« Reply #1608 on: June 26, 2014, 05:58:33 PM »
BornFromTheVoid's graph from «Today at 10:56:01 AM» shows one aspect of 2012's impressive melt:  three periods of times its weekly melt rate exceeded 2 SD and never melted statistically slowly by 2SD.  2014, on the other hand, has had statistically slow melt rates  (~2 SD) three periods of times so far.  As only a few named years data is shown, I do not know how other years' data wobble around the mean.  Is 2012's trace really exceptional? 

BFTV, could you occasionally (or just once) post the graph showing more year's data?  (I understand that too many lines on a regular basis would be messy, etc.)  I'm curious if other years besides 2007 and 2012 never had 2 SD slow melt rates, or if other years' data bounces up and down like 2014's.
Arctic ice is healthy for children and other living things because "we cannot negotiate with the melting point of ice"

BornFromTheVoid

  • Nilas ice
  • Posts: 1339
    • View Profile
  • Liked: 679
  • Likes Given: 299
Re: The 2014 Melting Season
« Reply #1609 on: June 26, 2014, 06:45:04 PM »
BornFromTheVoid's graph from «Today at 10:56:01 AM» shows one aspect of 2012's impressive melt:  three periods of times its weekly melt rate exceeded 2 SD and never melted statistically slowly by 2SD.  2014, on the other hand, has had statistically slow melt rates  (~2 SD) three periods of times so far.  As only a few named years data is shown, I do not know how other years' data wobble around the mean.  Is 2012's trace really exceptional? 

BFTV, could you occasionally (or just once) post the graph showing more year's data?  (I understand that too many lines on a regular basis would be messy, etc.)  I'm curious if other years besides 2007 and 2012 never had 2 SD slow melt rates, or if other years' data bounces up and down like 2014's.

Here's the graph with 08, 09, 10 and 11 added. I reduced the size of the other years lines and made them dashed so the new years would be more clear. It's still a bit messy though.


If you want any specific years or groups of years feel free to ask.
I recently joined the twitter thing, where I post more analysis, pics and animations: @Icy_Samuel

jdallen

  • Young ice
  • Posts: 3412
    • View Profile
  • Liked: 651
  • Likes Given: 244
Re: The 2014 Melting Season
« Reply #1610 on: June 26, 2014, 06:45:27 PM »
The constraint on this melt season that can not be ignored is the low mean temperature. At first I thought it would just be an aspect of importance for the CAB. DMI showing lower than mean temps for +80dNorth.
But after checking NCEP/NCAR it looks like it is a constraint for a large part of the Arctic Ocean.
The only Arctic Sea with higher temps compared to '12 during the last few days was Hudson Bay. And a small part of CAB near the Beaufort Sea.
Last year had even lower mean temps, but was considerably warmer on the Barentsz side...

Bottom line... the Arctic is, as ever, an intriguing place.

To get some more perspective, I used NCEP/NCAR data for the period corresponding to the DMI 'dip', which started about 11 May. <snippage>

Of course I've been contemplating this. There are many aspects. I'd be honoured to hear any opinions.

I am not convinced low average temperatures are the cause of reduced melt as much as they are a side effect or buffer of melt.  Unless the average temps drop significantly below -2C, I don't think they retard melt.

95% + of the power required for melt comes via insolation.  Direct thermal transfer from atmosphere and currents comparatively are relatively small.  My sense is, in particular with currents, the effect is more long term, via raising the net enthalpy of the system at depth; something which doesn't become readily visible without eckman pumping during storms.  Rain is an outlier/in between, but I suspect far more dangerous earlier in the season when it can strip snow pack and reduce albedo.

One of the powerful negative, ice supportive feed backs we have seen has come from low to mid level cloudiness.  Much of the moisture for that is derived locally, through evaporation which as a phase change, similarly takes up just as much sensible heat as melt. Further, as there is no practical limit to the water available for this heat sink phase change, it can continuously buffer heat transfer to ice. To wit, I think if we were to examine relative humidity changes, we may very well see exactly where that missing heat has gone.

So to summarize...

I don't think lower average temps are a contributor to reduced melt.

I think they may be a direct result of increased evaporation.

I think reduction in rates of ice loss may be tied directly to this.
This space for Rent.

werther

  • Grease ice
  • Posts: 747
    • View Profile
  • Liked: 31
  • Likes Given: 0
Re: The 2014 Melting Season
« Reply #1611 on: June 26, 2014, 06:58:24 PM »
Of course I've been contemplating this. There are many aspects. I'd be honoured to hear any opinions.

This is very interesting, but I don't think I understand the final graph. Did you integrate the temperature from the previous plot over area (i.e., Integral(Temp * dA))? Did you then normalize by something? Else, why are the units on the vertical axis in the 10K range -- shouldn't they be ~ 10e6km^2 * 273K = 2.73e9?

Oh, wait, maybe I get it -- did you integrate only the area that was below freezing for the entire time window?

Hi Bruce,
I integrated only the area for the whole N Hemisphere that had mean temp below zero and for the period 11/05 to 23/06. So it works as a proxy for 'temperature melt-conductiveness'. That's great English, isn't it :P?
It doesn't tell anything about the intensity of that conduc...you know what. So it is a crude assessment.

Anyway, as far as 2m-temps are important, this year is slightly on the cold side of the average and back in the 2008-9 ballpark, like last year.  I tossed with theories that thin, melting ice and a lot of leads/polynia's could actually keep 2m-temps on the low side. So I looked up in the troposphere (metaphorically speakin'..) at 925 and 850 Mb to see if there could be anything adiabatic or the opposite involved. No large differences. There's no indication that the much debated jet-stream weakening could enhance warmth transport per the undulating Rossby waves. At least, not in the Arctic spring.

I have only 'winter-power', integrated for the last two winter periods, to maybe illustrate a slight upwards trend in warming (that I assume to fit with the GISStemp warming that is most pronounced in the Arctic).

So how could '05/'06 be outliers while the first great extent dip was during '07? And the dip in '12 cannot be credited to the jet-stream-weirdness alone.
At least the 2010 spring temp warmth seems to coincide with the massive volume 'cliff' that year...

werther

  • Grease ice
  • Posts: 747
    • View Profile
  • Liked: 31
  • Likes Given: 0
Re: The 2014 Melting Season
« Reply #1612 on: June 26, 2014, 07:14:30 PM »
....
One of the powerful negative, ice supportive feed backs we have seen has come from low to mid level cloudiness.  Much of the moisture for that is derived locally, through evaporation which as a phase change, similarly takes up just as much sensible heat as melt. Further, as there is no practical limit to the water available for this heat sink phase change, it can continuously buffer heat transfer to ice. To wit, I think if we were to examine relative humidity changes, we may very well see exactly where that missing heat has gone.
....

Thanks JDA,

In my post "06:48" I wrote something similar: "... that thin, melting ice and a lot of leads/polynia's could actually keep 2m-temps on the low side...". Still, when there's not much sign that warming could be a tad stronger aloft, that physical process doesn't seem to be the leading feedback.
I've done some checks on relative and specific humidity/precipitable water via NCEP/NCAR, but was never struck with an 'aha-erlebnis' (I'm sure Goethe would have liked that one...), yet. If I recall right, the Arctic used to be very dry. So the warming should coincide with rising humidity (to be investigated...).

Lord M Vader

  • Nilas ice
  • Posts: 1406
    • View Profile
  • Liked: 60
  • Likes Given: 39
Re: The 2014 Melting Season
« Reply #1613 on: June 26, 2014, 07:49:38 PM »
CC_Reanalyzer showed that some more warming will be on the way the next days. The GFS 12z run was in the longer end of the forecast not too melt friendly (days 6-7) which are having a degree of uncertainity...

5 days left of this month, should be interesting to see where we are when we put July 1 and JAXAs numbers for June 30 will be up.. With current melting we'll end up around 9,3 Mn km2...

The very year as the PDO switches back to its positive phase it will be goodbye to Arctic sea ice.. Combine the temps in DMI graph for summer 1991 with the sunshine that 2007 had and we'll get a huge crash.. Anyone who knows how the weather in the Arctic was during the summer of 1991, eg. SLP?

//LMV

jdallen

  • Young ice
  • Posts: 3412
    • View Profile
  • Liked: 651
  • Likes Given: 244
Re: The 2014 Melting Season
« Reply #1614 on: June 26, 2014, 08:42:17 PM »
....
One of the powerful negative, ice supportive feed backs we have seen has come from low to mid level cloudiness.  Much of the moisture for that is derived locally, through evaporation which as a phase change, similarly takes up just as much sensible heat as melt. Further, as there is no practical limit to the water available for this heat sink phase change, it can continuously buffer heat transfer to ice. To wit, I think if we were to examine relative humidity changes, we may very well see exactly where that missing heat has gone.
....

Thanks JDA,

In my post "06:48" I wrote something similar: "... that thin, melting ice and a lot of leads/polynia's could actually keep 2m-temps on the low side...". Still, when there's not much sign that warming could be a tad stronger aloft, that physical process doesn't seem to be the leading feedback.
I've done some checks on relative and specific humidity/precipitable water via NCEP/NCAR, but was never struck with an 'aha-erlebnis' (I'm sure Goethe would have liked that one...), yet. If I recall right, the Arctic used to be very dry. So the warming should coincide with rising humidity (to be investigated...).
I will have to meditate on the forces driving warming above 2M, and the degree of coupling they have with the system elsewhere.

My reflexive thought is, higher levels would be more subject to re radiation out of the atmosphere, but I'm sure there is more there to consider.
This space for Rent.

LRC1962

  • Frazil ice
  • Posts: 447
    • View Profile
  • Liked: 11
  • Likes Given: 3
Re: The 2014 Melting Season
« Reply #1615 on: June 26, 2014, 09:07:00 PM »
Maybe it is my imagination, but it seems that we have been having a lot of fog in the Arctic this year. That means a lot of available open water (leads, fragmentation etc.). Came across the thesis, http://dare.uva.nl/document/514172 . Although it was based around Greenland, I believe it may also apply to the Arctic as a whole. Note it does emphasize that little has been studied about Arctic fog because of lack of on site stations.
"All truth passes through three stages: First, it is ridiculed; Second,  it is violently opposed; and Third, it is accepted as self-evident."
       - Arthur Schopenhauer

Tor Bejnar

  • Young ice
  • Posts: 4606
    • View Profile
  • Liked: 879
  • Likes Given: 826
Re: The 2014 Melting Season
« Reply #1616 on: June 26, 2014, 09:39:11 PM »
Thanks BFTV for your « Reply #1610 on: Today at 12:45:04 PM »

(and thanks for taking time to minimize the busyness of the busy graph!).   

It does show how special the 2012 melt season was, with multiple periods of time with statistically-high-for-the-date melt rates.  Of recent years, 2014 is already unusual with its multiple slow melt periods.
Arctic ice is healthy for children and other living things because "we cannot negotiate with the melting point of ice"

Frivolousz21

  • Nilas ice
  • Posts: 1915
  • Live in Belleville, IL..15 miles SE of St. Louis.
    • View Profile
  • Liked: 598
  • Likes Given: 7
Re: The 2014 Melting Season
« Reply #1617 on: June 26, 2014, 10:14:40 PM »
Models are brutal the rest of the month into early July.  Major in-situ melt all over the place.

Expect area to drop hard as concentration slowly falls apart over the basin.

But extent drop will probably be a bit slower.  Pending howfast the Kara, Hudson, and Baffin go.

I got a nickname for all my guns
a Desert Eagle that I call Big Pun
a two shot that I call Tupac
and a dirty pistol that love to crew hop
my TEC 9 Imma call T-Pain
my 3-8 snub Imma call Lil Wayne
machine gun named Missy so loud
it go e-e-e-e-ow e-e-e-e-e-e-blaow

werther

  • Grease ice
  • Posts: 747
    • View Profile
  • Liked: 31
  • Likes Given: 0
Re: The 2014 Melting Season
« Reply #1618 on: June 26, 2014, 10:29:48 PM »
Thanks LRC, a good find on fog and humidity. I plan to read it during the week-end.

Ah, BFTV, that graph reminds me of the excitement when I saw the CT-dip early July '07. I was just heading for holiday and knew instantly that Al Gore's movie would get an illustration...

On the relatively low mean spring temps... I have a hunch that they are related to the global re-arrangement reflected in ENSO, PDO, AMO and jetstream behaviour. I do not think that the temp constrain in spring will turn the tide for sea-ice. The structural damage already done is too strong and the low spring temp effect is compensated through less 'winter-power' and oceanic influences.

jdallen

  • Young ice
  • Posts: 3412
    • View Profile
  • Liked: 651
  • Likes Given: 244
Re: The 2014 Melting Season
« Reply #1619 on: June 26, 2014, 10:47:55 PM »
Models are brutal the rest of the month into early July.  Major in-situ melt all over the place.

Expect area to drop hard as concentration slowly falls apart over the basin.

But extent drop will probably be a bit slower.  Pending howfast the Kara, Hudson, and Baffin go.

I'll be surprised if much of the Hudson and Baffin survive more than two weeks.  I give the Kara until the end of July, but not much more.

I think the story of August will be the CAB and ESS - do they, or do they not melt sufficient to pass 2013/2011/2007/2012...
This space for Rent.

Frivolousz21

  • Nilas ice
  • Posts: 1915
  • Live in Belleville, IL..15 miles SE of St. Louis.
    • View Profile
  • Liked: 598
  • Likes Given: 7
Re: The 2014 Melting Season
« Reply #1620 on: June 27, 2014, 12:21:12 AM »

Man looking at the models melting in general is pretty bad all over in places that are quickly getting bad.

The Kara region still holds a lot of "ice"


The ESS is another region with a lot to give.  And I thin it will area wise.


Both areas get punked pretty hard. 


ESS really gets busted with winds, warmth, some rain, and mostly above 0C+ the entire period.

The Excitement grows.

I got a nickname for all my guns
a Desert Eagle that I call Big Pun
a two shot that I call Tupac
and a dirty pistol that love to crew hop
my TEC 9 Imma call T-Pain
my 3-8 snub Imma call Lil Wayne
machine gun named Missy so loud
it go e-e-e-e-ow e-e-e-e-e-e-blaow

wili

  • Young ice
  • Posts: 3342
    • View Profile
  • Liked: 602
  • Likes Given: 409
Re: The 2014 Melting Season
« Reply #1621 on: June 27, 2014, 12:32:03 AM »
Good points on all fronts, Friv. But surely this is pretty much true for most years recently, hence the steep drop in most of them this time of year. It seems to me that the main question is if this melting can 'catch up' with the earlier starts that 2012 and 2007 got on their melt. The smart money seems to say, no. But I've always tried to avoid being smart. 8) I do think that it is more than possible still for relatively clear skies to toast a lot of thin, broken-up ice up there in short order, especially in the peripheral areas you mentioned, but also closer to the pole. We'll see soon enough.
"A force de chercher de bonnes raisons, on en trouve; on les dit; et après on y tient, non pas tant parce qu'elles sont bonnes que pour ne pas se démentir." Choderlos de Laclos "You struggle to come up with some valid reasons, then cling to them, not because they're good, but just to not back down."

Frivolousz21

  • Nilas ice
  • Posts: 1915
  • Live in Belleville, IL..15 miles SE of St. Louis.
    • View Profile
  • Liked: 598
  • Likes Given: 7
Re: The 2014 Melting Season
« Reply #1622 on: June 27, 2014, 12:49:31 AM »
Catching 2007 is probably very unlikely and 2012 would need an all out blow out to the season into mid Sept.
I got a nickname for all my guns
a Desert Eagle that I call Big Pun
a two shot that I call Tupac
and a dirty pistol that love to crew hop
my TEC 9 Imma call T-Pain
my 3-8 snub Imma call Lil Wayne
machine gun named Missy so loud
it go e-e-e-e-ow e-e-e-e-e-e-blaow

Bruce

  • Frazil ice
  • Posts: 132
    • View Profile
  • Liked: 0
  • Likes Given: 0
Re: The 2014 Melting Season
« Reply #1623 on: June 27, 2014, 01:21:52 AM »
Frivolous, can you explain your final plot (animation)? I get that the white contours are isobars (I think), but what are the colored contours? Temperature? If so, what is the scale? The units on the scalebar don't make a lot of sense to me.

Thanks.

Bruce

  • Frazil ice
  • Posts: 132
    • View Profile
  • Liked: 0
  • Likes Given: 0
Re: The 2014 Melting Season
« Reply #1624 on: June 27, 2014, 01:35:08 AM »
Wipneus pointed out this feature in his home brew thread, but I thought I'd update with today's image. It's a pretty impressive crack. It's starting to curve north, so it may not connect up with the weak spot north of Greenland (indicated at the bottom right of the picture), but if the current conditions hold, it looks like a very, very big chunk of ice might go wandering off. Not much to stop it -- everywhere around it there's big polnyas or highly fragmented ice.


jonthed

  • New ice
  • Posts: 69
    • View Profile
  • Liked: 1
  • Likes Given: 0
Re: The 2014 Melting Season
« Reply #1625 on: June 27, 2014, 05:50:27 AM »
Bruce,

that crack is similar to what the HYCOM thickness forecast is predicting.

from the ASI graphs page:


look what happens to the most easterly chunk that breaks away in the forecast!

Let's see what happens...

Bruce

  • Frazil ice
  • Posts: 132
    • View Profile
  • Liked: 0
  • Likes Given: 0
Re: The 2014 Melting Season
« Reply #1626 on: June 27, 2014, 06:37:01 AM »
that crack is similar to what the HYCOM thickness forecast is predicting.

look what happens to the most easterly chunk that breaks away in the forecast!
Yeah, it just disintegrates. That's a great animation. It looks like these current conditions continue for a few days. It'll be interesting to see if that crack opens up.

The figure shows some detail of another thing I'm watching: when do the Beaufort and Chukchi join up? Once that happens, there's not much anchoring the ice. Looks like it could happen late next week.

Bruce

  • Frazil ice
  • Posts: 132
    • View Profile
  • Liked: 0
  • Likes Given: 0
Re: The 2014 Melting Season
« Reply #1627 on: June 27, 2014, 06:56:11 AM »

I integrated only the area for the whole N Hemisphere that had mean temp below zero and for the period 11/05 to 23/06. So it works as a proxy for 'temperature melt-conductiveness'. That's great English, isn't it :P?
It doesn't tell anything about the intensity of that conduc...you know what. So it is a crude assessment.
Werther,
I've been thinking about your plot. I agree that integrating only < 0 through the winter months doesn't take into account the intensity of the cold. It would be interesting to use a baseline for each grid point for each day using an average over as many years as you have, and then integrate the product of the anomaly * area (maybe normalized by total area). That could give some idea of the "stored potential" (i.e., how much (relative) energy it would take to melt the accumulated ice). I think warmer winters have as much to do with the melting of the Arctic ice as warmer summers -- maybe more. And I don't thing volume or area or extent tell the whole story; there's a quality to the ice that has changed. I think we're all seeing it, but we don't really have a way to quantify it.

Frivolousz21

  • Nilas ice
  • Posts: 1915
  • Live in Belleville, IL..15 miles SE of St. Louis.
    • View Profile
  • Liked: 598
  • Likes Given: 7
Re: The 2014 Melting Season
« Reply #1628 on: June 27, 2014, 07:16:58 AM »
The GFS is brutal.

Huge ridging/HP/melt all over endlessly. 

Rebuilding and organizing the big -NAO in the medium range.  All signs pointing words lots and lots of in-situ melting and decent compaction at times.

If the models jumping on the rebuilding of the big -NAO is right. 

We can expect the warm weather to probably go out another week or two at least into July, but that is way  out there.


I got a nickname for all my guns
a Desert Eagle that I call Big Pun
a two shot that I call Tupac
and a dirty pistol that love to crew hop
my TEC 9 Imma call T-Pain
my 3-8 snub Imma call Lil Wayne
machine gun named Missy so loud
it go e-e-e-e-ow e-e-e-e-e-e-blaow

Frivolousz21

  • Nilas ice
  • Posts: 1915
  • Live in Belleville, IL..15 miles SE of St. Louis.
    • View Profile
  • Liked: 598
  • Likes Given: 7
Re: The 2014 Melting Season
« Reply #1629 on: June 27, 2014, 09:17:59 AM »
Euro is terrible.

I got a nickname for all my guns
a Desert Eagle that I call Big Pun
a two shot that I call Tupac
and a dirty pistol that love to crew hop
my TEC 9 Imma call T-Pain
my 3-8 snub Imma call Lil Wayne
machine gun named Missy so loud
it go e-e-e-e-ow e-e-e-e-e-e-blaow

BornFromTheVoid

  • Nilas ice
  • Posts: 1339
    • View Profile
  • Liked: 679
  • Likes Given: 299
Re: The 2014 Melting Season
« Reply #1630 on: June 27, 2014, 11:07:58 AM »
Frivolous, can you explain your final plot (animation)? I get that the white contours are isobars (I think), but what are the colored contours? Temperature? If so, what is the scale? The units on the scalebar don't make a lot of sense to me.

Thanks.

The colour scale is 500hPa geopotential height in decameters, so the height you have to reach to get to 500hPa pressure level. It's a measure of the upper level pattern, which is generally more stable and predictable than the surface features.

For what it's worth, the ECM doesn't look that bad to me. Temperature anomalies across the Arctic ocean are above average now, moving to close to average in 3-4 days and below average in 5-6 days. So losses close to recent years over the next 3-4 days, then possibly heading below average based on the forecast. The high pressure lacks substantial upper level support, and isn't carrying warm air northward with it, like many high pressure scenarios we've seen in the past. The pattern could be a lot better, could be a lot worse. If the high pressure manages to stick around and pulls in some warmer air from the mid-latitudes, then we could have a very interesting July ahead of us though.
The ECM temperature anomalies at 850hPa can be viewed here http://www.meteociel.fr/modeles/ecmwf.php?ech=72&mode=100&map=1&type=0&archive=0
I recently joined the twitter thing, where I post more analysis, pics and animations: @Icy_Samuel

Frivolousz21

  • Nilas ice
  • Posts: 1915
  • Live in Belleville, IL..15 miles SE of St. Louis.
    • View Profile
  • Liked: 598
  • Likes Given: 7
Re: The 2014 Melting Season
« Reply #1631 on: June 27, 2014, 11:15:28 AM »
Bad news on the Pacific side between the Chukchi and ESS.  Warm water is bunched right up against the pack ice.  Out by Wrangle Island. 

The things blow off the open water along that area of the Pacific side quite a bit this week around the anti-cyclonic flow + low pressure systems that travel into NE Siberia also help bring an Easterly flow off the Bering straight region fetch.

It's not every moment like this.  But the ESS is very shallow.  This water source is tied to the warm Pacific layer that dives under the arctic fresh top water layer. However in this case


The natural surface current is for the water to travel West to East over the ESS Basin towards the Chukchi.

This wind reversal is like a wall of warm water being pushed into the ice pack.  There is no where for it to mix under the ice except with the fresh water layer where it will go to bottom ice melt. 

Or thru the ice as it cracks and all that.  I think this is part of the great ESS meltdown of 2007 IIRC.

But that doesn't show the heat within the ice pack that the satellite can't pick up properly.


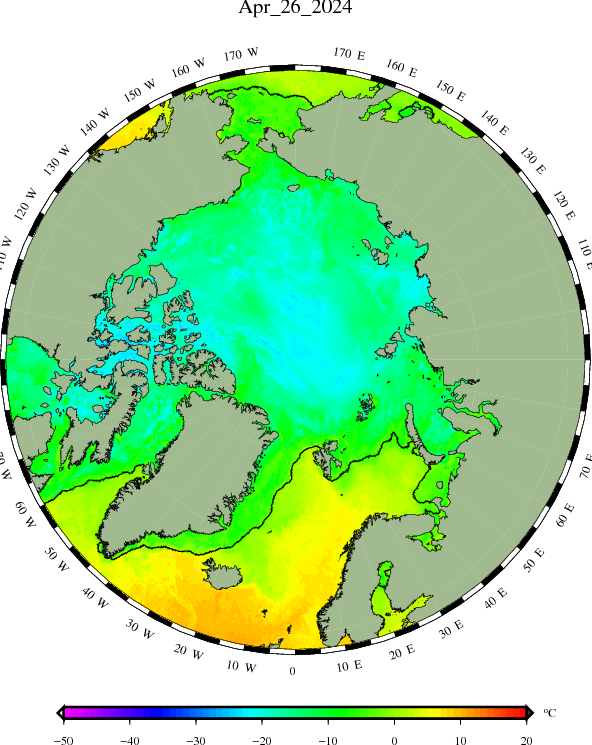
On this graphic I circled in blue areas of the ESS with reporting stations of 1C sst within the ice pack.  This is not uncommon they are relatively close to the shore.  But not all of them.  Another potential forming warm pool is around wrangle Island.

The DMI graphic is updated an hour or two ago.  The black and white one is a day old.  New one is normally out by now. 


The Red arrow points to the strip of warm water you see on the DMI chart. 

You can also see the ice along the shore is breaking/opening up.  Warm water will be able to flow under/thru/over this area quickly really tearing the ice up.


Then we combine the 8 day weekly mean of the GFS showing above normal temps and 0C+ average + 500w/m2 solar potential.

I think not just the ESS but the entire Pacific side basin is going to get funky.  As well as the Atlantic side/Laptev/Kara.

North of GIS/NA is pretty warm who knows how much surface melt will go on there.

But in terms of areas of potential melt out.  Insitu melt is going to be paramount under the kind of weather we are under.

The melting process is a positive feedback and major melt can happen fast.  Most of the Pacific/Atlantic basin side is well under 2M now.

Hell most of the arctic is.

Some of that is already melted.  But most melts from mid July-late August.

The ESS hasn't been looking to hot.  If the ice here melts out fast the water depth is 20-30M over a large large area.  The faster this region melts the faster it can warm up and be a staging point for invasions of the ice further North.

These are the little things I love to watch unfold and see their impact.


I got a nickname for all my guns
a Desert Eagle that I call Big Pun
a two shot that I call Tupac
and a dirty pistol that love to crew hop
my TEC 9 Imma call T-Pain
my 3-8 snub Imma call Lil Wayne
machine gun named Missy so loud
it go e-e-e-e-ow e-e-e-e-e-e-blaow

JayW

  • Grease ice
  • Posts: 607
    • View Profile
  • Liked: 226
  • Likes Given: 292
Re: The 2014 Melting Season
« Reply #1632 on: June 27, 2014, 11:20:27 AM »
Frivolous, can you explain your final plot (animation)? I get that the white contours are isobars (I think), but what are the colored contours? Temperature? If so, what is the scale? The units on the scalebar don't make a lot of sense to me.

Thanks.

Bruce,

     The colored contours are the 500hpa geopotential heights.  Which is the altitude where the atmospheric pressure is 500hpa, in decameters.  High geopotential heights are associated with upper level riding and generally clear, fair weather.  Low heights are associated with troughiness and unsettled weather.  The jet stream or streams (polar, arctic, and sub-tropical) generally meander around these features.   The simple way I determine the jet stream is that I follow the 576dm contour for the sub-tropical jet, the 552dm for the arctic jet, and 528dm for the polar vortex.  I'm just a novice, but hope that helps. 

Edit:  BFTV beat me to it as I was typing  :)
« Last Edit: June 27, 2014, 01:26:34 PM by JayW »
"To defy the laws of tradition, is a crusade only of the brave" - Les Claypool

Frivolousz21

  • Nilas ice
  • Posts: 1915
  • Live in Belleville, IL..15 miles SE of St. Louis.
    • View Profile
  • Liked: 598
  • Likes Given: 7
Re: The 2014 Melting Season
« Reply #1633 on: June 27, 2014, 11:51:41 AM »
Frivolous, can you explain your final plot (animation)? I get that the white contours are isobars (I think), but what are the colored contours? Temperature? If so, what is the scale? The units on the scalebar don't make a lot of sense to me.

Thanks.

The colour scale is 500hPa geopotential height in decameters, so the height you have to reach to get to 500hPa pressure level. It's a measure of the upper level pattern, which is generally more stable and predictable than the surface features.

For what it's worth, the ECM doesn't look that bad to me. Temperature anomalies across the Arctic ocean are above average now, moving to close to average in 3-4 days and below average in 5-6 days. So losses close to recent years over the next 3-4 days, then possibly heading below average based on the forecast. The high pressure lacks substantial upper level support, and isn't carrying warm air northward with it, like many high pressure scenarios we've seen in the past. The pattern could be a lot better, could be a lot worse. If the high pressure manages to stick around and pulls in some warmer air from the mid-latitudes, then we could have a very interesting July ahead of us though.
The ECM temperature anomalies at 850hPa can be viewed here http://www.meteociel.fr/modeles/ecmwf.php?ech=72&mode=100&map=1&type=0&archive=0

How does having 0c or 5C  temps at 1500M matter that much at the surface where there should be a stout surface inversion preventing mixing ? 

The entire basin is forecasted to be its  0C+ the entire period with anomalous high pressure and height fields. 

Does having 5C 850mb temps have an effects on solar insolation versus 0C 850MB temps?

If all else is equal surface ice albedo, full sun, same surface pressure and heights.

But one scenario has cooler low to mid level temps?


Why is the warmer mid levels solution so much worse for the ice?

To say the current euro forecast is not that bad?


I have to be missing something. This is about melting a sheet of ice not warming the lower troposphere.

I have seen 1.5C buoy temps With sunny skies and 0c. I have seen 1.5C buoy temps and with 10C+ 850mb temps.

Why would warmer temps aloft melt more ice?


« Last Edit: June 27, 2014, 02:27:44 PM by Frivolousz21 »
I got a nickname for all my guns
a Desert Eagle that I call Big Pun
a two shot that I call Tupac
and a dirty pistol that love to crew hop
my TEC 9 Imma call T-Pain
my 3-8 snub Imma call Lil Wayne
machine gun named Missy so loud
it go e-e-e-e-ow e-e-e-e-e-e-blaow

lanevn

  • New ice
  • Posts: 91
    • View Profile
  • Liked: 0
  • Likes Given: 0
Re: The 2014 Melting Season
« Reply #1634 on: June 27, 2014, 12:08:05 PM »
What's wrong with Beaufort last days - is it really refreeze?

Frivolousz21

  • Nilas ice
  • Posts: 1915
  • Live in Belleville, IL..15 miles SE of St. Louis.
    • View Profile
  • Liked: 598
  • Likes Given: 7
Re: The 2014 Melting Season
« Reply #1635 on: June 27, 2014, 12:34:31 PM »
What's wrong with Beaufort last days - is it really refreeze?

No it is not refreezing. 


I forgot to throw this in about the ESS area earlier.  Looks like a large weak area just South of that nasty patch of fog.  Full sun, peak heating.


I got a nickname for all my guns
a Desert Eagle that I call Big Pun
a two shot that I call Tupac
and a dirty pistol that love to crew hop
my TEC 9 Imma call T-Pain
my 3-8 snub Imma call Lil Wayne
machine gun named Missy so loud
it go e-e-e-e-ow e-e-e-e-e-e-blaow

johnm33

  • Guest
Re: The 2014 Melting Season
« Reply #1636 on: June 27, 2014, 04:14:48 PM »
Bruce, My take on that crack is that it's where the tides wash up against the temporary winter ice shelf, if the fast ice is going to break away I suspect it'll be where that shelf is grounded close to shore. For the last 3/4 days the winds have been blowing more or less paralell to the coast which tends to shift the ice north away from the coast, if it's free to move, there's space to move into or the ice is easily compactable, since the same wind reaches all the way to the pole I can't imagine it not moving.
http://earth.nullschool.net/#current/wind/surface/level/orthographic=-56.26,85.26,512
    When it moves water will be sucked in to replace it, if thats Pacific water near the surface the crack will widen rapidly, if it's deeper atlantic water it will erode the connection to the land. There seems to be plenty of warm water poised by Mackenzie bay, I can't recall this ever looking so dramatic although the anomoly in the bay was quite something in 2012. http://polar.ncep.noaa.gov/sst/ophi/color_newdisp_anomaly_north_pole_stereo_ophi0.png
If it does break off at the grounding line given current conditions that thick ice will likely get recycled into Beaufort via CAB.

Tor Bejnar

  • Young ice
  • Posts: 4606
    • View Profile
  • Liked: 879
  • Likes Given: 826
Re: The 2014 Melting Season
« Reply #1637 on: June 27, 2014, 04:25:41 PM »
The crack north of the CAA shows up nicely on Neven's "Arctic Sea Ice Graphs" "Concentration Maps" tab at https://sites.google.com/site/arcticseaicegraphs/concentration-maps
Arctic ice is healthy for children and other living things because "we cannot negotiate with the melting point of ice"

Bruce

  • Frazil ice
  • Posts: 132
    • View Profile
  • Liked: 0
  • Likes Given: 0
Re: The 2014 Melting Season
« Reply #1638 on: June 27, 2014, 05:01:21 PM »
Thanks, BFTV and JayW -- the explanations are much appreciated.

Frivolous -- That depth chart was fascinating; I had no idea that the whole Siberian shelf was so shallow. That kind of water can warm up quickly. (You can also get light all the way to the bottom. I wonder if the scuba diving is any good?)

I posted this pic over on Wipneus' thread, but I'll repost here. It's the first good shot we've seen of the Kara in a while. Judge the ice for yourselves.

jdallen

  • Young ice
  • Posts: 3412
    • View Profile
  • Liked: 651
  • Likes Given: 244
Re: The 2014 Melting Season
« Reply #1639 on: June 27, 2014, 07:02:47 PM »
Thanks, BFTV and JayW -- the explanations are much appreciated.

Frivolous -- That depth chart was fascinating; I had no idea that the whole Siberian shelf was so shallow. That kind of water can warm up quickly. (You can also get light all the way to the bottom. I wonder if the scuba diving is any good?)

I posted this pic over on Wipneus' thread, but I'll repost here. It's the first good shot we've seen of the Kara in a while. Judge the ice for yourselves.

Following ice like this last year in the Chukchi... When it reached this stage, it was about a week away from being reduced to random isolated floes.  Pretty much anything smaller than about 10km in diameter disappeared.  Not much visible that size or larger here.
This space for Rent.

Nightvid Cole

  • Frazil ice
  • Posts: 438
    • View Profile
  • Liked: 6
  • Likes Given: 0
Re: The 2014 Melting Season
« Reply #1640 on: June 27, 2014, 10:55:03 PM »
ACNFS SST's suggest very high bottom melt rates in the Pacific sector all the way up to 85 degrees North and beyond (up to the crude dotted line I drew on the image). This penetration into the central Arctic has no precedent and if it is real, we may have a September minimum ice pack which is positioned to just flow out the Fram this winter.

If this occurs, we will start off 2015 with almost 100% FYI, apart from a narrowish band of MYI along the CAA.

I'm starting to think the non-slushpuppie ice pack could be gone forever, already.


Nick_Naylor

  • Frazil ice
  • Posts: 291
    • View Profile
  • Liked: 0
  • Likes Given: 0
Re: The 2014 Melting Season
« Reply #1641 on: June 27, 2014, 11:01:50 PM »
It seems like Siberian wildfires are threatening a repeat of their 2012 shenanigans, potentially darkening the snow & ice and enhancing the melt:

http://robertscribbler.wordpress.com/


Lord M Vader

  • Nilas ice
  • Posts: 1406
    • View Profile
  • Liked: 60
  • Likes Given: 39
Re: The 2014 Melting Season
« Reply #1642 on: June 27, 2014, 11:31:41 PM »
Nightvid Cole: models tells one thing, the reality another... But I agree with one thing: it would be extremely fascinating - and tragic - if the scenario you point out would come true already this year...

Oh, the GFS seems to weaken the Arctic HP in about 4 days which should be good news for the ice and certainly slow down things hugely as clouds in combo with temps above 80N still are below normal... The EURO on the other hand have the HP still in charge through the forecast period...

//LMV

Lord M Vader

  • Nilas ice
  • Posts: 1406
    • View Profile
  • Liked: 60
  • Likes Given: 39
Re: The 2014 Melting Season
« Reply #1643 on: June 27, 2014, 11:34:54 PM »
I had barely posted my last post before I went in to DMI and saw asmoking fresh update showing a big uptick in airtemp above 80N to normal temps now... Interesting!!! :) If EURO keeps to be in charge with HP, how quick melt may there be in that case?

//LMV

Neven

  • Administrator
  • First-year ice
  • Posts: 9518
    • View Profile
    • Arctic Sea Ice Blog
  • Liked: 1337
  • Likes Given: 618
Re: The 2014 Melting Season
« Reply #1644 on: June 28, 2014, 12:01:48 AM »
I have added June 19-24 to the SLP Patterns page:

The enemy is within
Don't confuse me with him

E. Smith

Nightvid Cole

  • Frazil ice
  • Posts: 438
    • View Profile
  • Liked: 6
  • Likes Given: 0
Re: The 2014 Melting Season
« Reply #1645 on: June 28, 2014, 12:26:40 AM »
Nightvid Cole: models tells one thing, the reality another... But I agree with one thing: it would be extremely fascinating - and tragic - if the scenario you point out would come true already this year...

Oh, the GFS seems to weaken the Arctic HP in about 4 days which should be good news for the ice and certainly slow down things hugely as clouds in combo with temps above 80N still are below normal... The EURO on the other hand have the HP still in charge through the forecast period...

//LMV

Reality tells another? We don't have any buoys in that part of the Arctic, so it's not contradicted by observation regarding bottom melt (And it's a forecast for July 2nd anyways).

The buoys we do have in the Beaufort show that bottom melt began very early this year in that area, presumably due to the thinness and greater-than-usual transparency of the ice there which allowed solar heating of the upper ocean to be more than normal. As far as the central Arctic is concerned, especially the region around 80 - 85N , 135-180W, there are no buoys but it's clear from MODIS that the highly reflective dry snow cover is gone the way of the dodo and the ice may be unusually translucent in that area too and will become more so over the next 5 days.

If the ice is both broken up into slush and highly ponded, it could easily allow an unprecedented 25% of light to pass thru to the ocean (Unprecedented for central Arctic this early in the season, anyway). Both surface and bottom melt rates will be quite high, even if the latter may not be as extreme as in the Beaufort. Therefore, the hints from ACNFS are not implausible...
« Last Edit: June 28, 2014, 12:31:51 AM by Nightvid Cole »

Michael Hauber

  • Nilas ice
  • Posts: 1116
    • View Profile
  • Liked: 168
  • Likes Given: 16
Re: The 2014 Melting Season
« Reply #1646 on: June 28, 2014, 01:35:39 AM »
Interesting observation.  I've kind of given up looking closely at Arctic region SSTs because so often it seems that warm SSTs following melt rather than predicting melt.  However I know a pulse of warm water from Pacific was one of the factors associated with the 2007 melt.  Looking at satellite SSTs in the Bering Straight seems to show definitely warmer water than this time 2012, and similar to 2007.  There was quite a lot of warm southerly wind pushing into this area in winter and spring, so maybe this is now starting to have an effect.  Even if the incursion started in the coldest part of the year the Pacific water 100 metres down should be relatively toasty compared to the Arctic waters.
Climate change:  Prepare for the worst, hope for the best, expect the middle.

jdallen

  • Young ice
  • Posts: 3412
    • View Profile
  • Liked: 651
  • Likes Given: 244
Re: The 2014 Melting Season
« Reply #1647 on: June 28, 2014, 02:43:58 AM »
The next week may be pretty decisive for two areas... The Beaufort and the Kara.

Uni. Of Maine Climate Reanalyzer shows persistent ridging out through the middle of next week, and temperature spikes along the coast(s) of 20C and higher. Temperatures within the pack are predicted to be persistently above freezing, under high pressure.

It is hard to imagine ice in those areas resisting this well.

http://cci-reanalyzer.org/Forecasts/
This space for Rent.

sydb

  • New ice
  • Posts: 11
    • View Profile
  • Liked: 0
  • Likes Given: 0
Re: The 2014 Melting Season
« Reply #1648 on: June 28, 2014, 04:38:41 AM »
A pulse of warm Pacific water into the shallow ESS might also melt a lot of methane hydrate.

davidsanger

  • New ice
  • Posts: 30
    • View Profile
  • Liked: 0
  • Likes Given: 0
Re: The 2014 Melting Season
« Reply #1649 on: June 28, 2014, 05:20:41 AM »
Jaxa Sea Ice Extent down -121,504 June 27th.
Only 222,653 above the all-time low for the date (2010)

[corrected]
« Last Edit: June 28, 2014, 07:02:07 AM by davidsanger »