JDAllen,
I'm very much in two minds about this melt season. I actually think it's shaping up into a more exciting season than 2012, because in 2012 it was pretty obvious a new record was on the cards from early on. It may be worth quoting the text of an email I sent to someone the other day.
QUOTE
....But on the subject of sea ice, which is my main interest. I'm seeing mixed signals.
I know you'll be busy so I'll condense this from what's on my blog. This, for what it's worth, is my current assessment.
This year has been unusually cold in May, which has caused a late start to the melt. This is seen in Anomalies of Cryosphere Today Area (CT Area)
http://farm4.staticflickr.com/3814/8961914348_0b70bd1354_o.jpgBut the anomalies are finally showing the start of what we're calling the June Cliff, more up to date detail of the above graph.
http://farm8.staticflickr.com/7381/8994638997_bbd735c1b1_o.jpgAlthough today's data shows a slight uptick for 2013. Note from the above, 2007, 2011 and 2012 all show a June Cliff, and all years were record years (2011 record in some indices only). So whatever the mechanism (I suspect melt ponding plays a role), an aggressive June cliff seems to be related to aggressive ice loss later in the season. Both a real drop in concentration caused by thinner ice after 2010, and melt ponding caused by more flat first year ice, would serve to pre-condition the pack for losses later in the season.
PIOMAS difference between May (average) 2013 and 2012 is here:
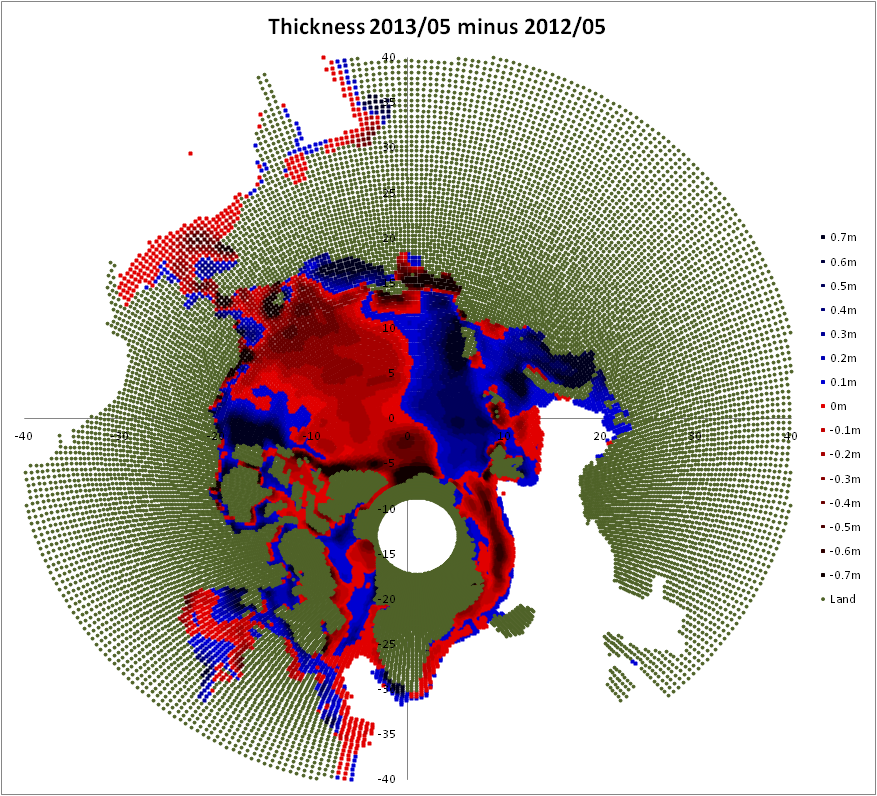
There's a large swath across the Arctic that's thinner this year, and unlike last year there isn't a band of multi-year ice (which was in the area of the low concentration region that was hit by the August Storm of 2012). But the US Navy HYCOM system is repeatedly forecasting a massive drop in thickness/concentration in Laptev. Both factors could cause a surprisingly 'enthusiastic' melt in July and August.
http://www7320.nrlssc.navy.mil/hycomARC/navo/arcticictn_nowcast_anim30d.gifSometimes as time proceeds HYCOM backtrack on projected loss as new forecasts of weather come in. I think it significant that this is not happening. The take home is - watch Laptev now, and expect a more rapid recession from the East Siberian sea than in 2012.
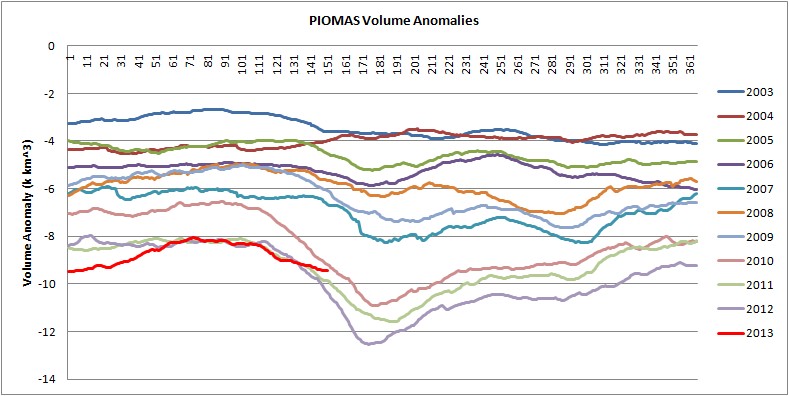
However PIOMAS volume loss after end June has been pretty invariant*, the post 2010 increase in melt season losses has happened before the June solstice.
This is also seen in the month to month differences of PIOMAS volume (monthly averages).
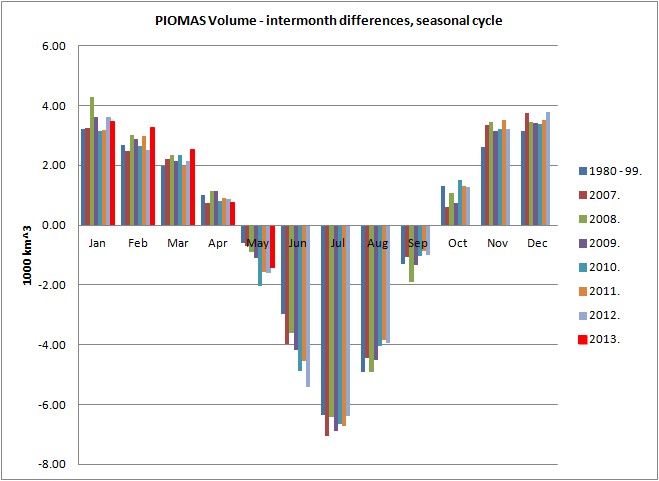
Note the slope to June losses, but lack of slope in July and August. Why this is happening I am unsure. The June increase in loss is likely due to transition to predominantly thinner first year ice, but the July/August lack of increased loss remains a puzzle. I suspect that typical ice condition in those months is such that the limiting factor is insolation, not ice state.
The late start seems to have eaten into the spring melt, to see a new record we would have to see melt increase after June, which hasn't happened since 2010.
I had been expecting a new crash this year, my estimate had been a pdf peaking around 1.75 to 2M km^2 CT Area, biased towards the high end with a short tail below 1.75M km^2. I now expect 2011 to be beaten, but 2012 may not be beaten.
END QUOTE
*Hat tip to Chris Randles, but that wasn't stated in the email as the recipient wouldn't know Chris.


