Chris,
I'm afraid my knowledge of these things isn't very extensive. I'm still learning how these processes work, even just learning the terminology and how to read the plots has been difficult at times. So be a bit more than skeptical of what I say

. The plots show the temperature of wave(s). Wave 1 is a singular bubble of warmth invading the polar stratosphere. The wave 1 plot shows that we had a small SSW mid-late October, and another currently occurring.
Edit: looking closer, technically the plots are showing the height of the wave(s), but I believe that the increase in heights can be attributed to warm air expanding, creating a bulge. Hope my thoughts make sense, my brain moves faster than my fingers. I'll gladly attempt to clarify any of what I say.
Thos animation illustrates it nicely.
A wave 2 response would involve two separate warm intrusions at the same time, and wave 3, 3 areas. My very limited knowledge is that wave 1+2 are the most important. With warming that begins at the top of the stratosphere and propagates downward being the most disruptive.
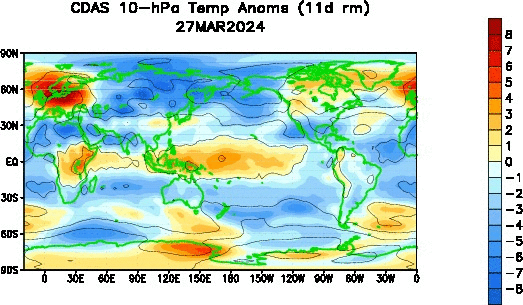
The earth.nullschool image is the 10hPa winds and temps. It shows just how anomalous the temps are with these SSW events. It's in the vicinity of +45°C ! I think the stratosphere begins at about 100hpa, so despite no real sensible weather in the stratosphere, much can happen there that effects the big picture.
I agree that this is likely related to the strong Siberian snow advance this past October. Interestingly, the snow cover has actually stalled in Siberia for most of November and expanded in North America recently.
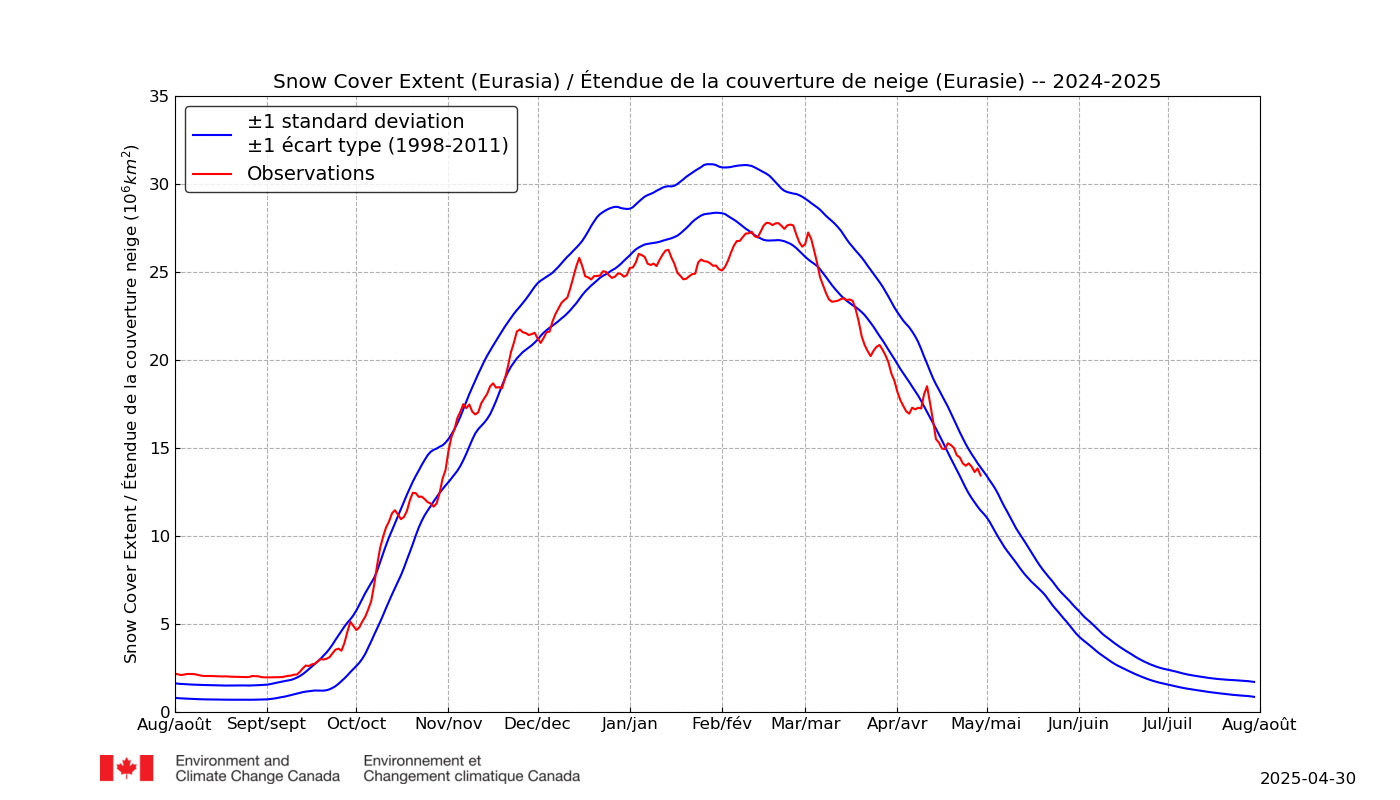 https://www.ccin.ca/home/ccw/snow/current
But my understanding is that the events are set in motion in October. I believe last winter we saw a largely +AO, just displaced. I can't really speak about how common these events are, I've only really been trying to educate myself on all matters meteorological in the past 12-18 months, full disclosure, I was hoping some folks more knowledgeable about this stuff would correct me or expand.
I don't mind taking a stab at things and being wrong, it's how I learn.
Hope that helps a little. If I'm in error anywhere I apologize, I'm just a carpenter, weather is a hobby.

The wave activity plots from the CPC are available here
http://www.cpc.ncep.noaa.gov/products/stratosphere/strat-trop/This is a great resource for ECMWF stratospheric output.
http://www.geo.fu-berlin.de/en/met/ag/strat/produkte/winterdiagnostics/index.html


