Support the Arctic Sea Ice Forum and Blog

Author Topic: Arctic Summer Sea Ice transition  (Read 68944 times)

jai mitchell

  • Nilas ice
  • Posts: 2362
    • View Profile
  • Liked: 208
  • Likes Given: 60
Arctic Summer Sea Ice transition
« on: October 12, 2014, 06:09:53 PM »
Topic Moved from PIOMAS October thread:

Haiku of Futures Passed
My "burning embers"
are not tri-color bar graphs
+3C today

ChrisReynolds

  • Nilas ice
  • Posts: 1764
    • View Profile
    • Dosbat
  • Liked: 20
  • Likes Given: 9
Re: Arctic Summer Sea Ice transition
« Reply #1 on: October 12, 2014, 08:16:42 PM »
Jai,

There is a thread called 'The Slow Transition' about winter ice growth
http://forum.arctic-sea-ice.net/index.php/topic,933.0.html

jai mitchell

  • Nilas ice
  • Posts: 2362
    • View Profile
  • Liked: 208
  • Likes Given: 60
Re: Arctic Summer Sea Ice transition
« Reply #2 on: October 12, 2014, 10:34:15 PM »
I.  IPCC

When I said that the IPCC is structurally designed to be overly conservative and is compromised by allowing political entities to appoint lead authors and specific scientific studies to be included in the report you responded to say that the IPCC reports accurately on the studies that it references within the body of its report.

These two statements are independent of each other, the second does not reference the first.  in effect your response is a non-sequitur.

The main issue, besides selection bias as outlined above is the Type I Error Avoidance Bias.

This means that new and challenging problems are not included in the report due to perceived uncertainty.  This bias prevents the inclusion of important scientific effects. 

For example:  There is a significant "fat tail" on the ECS analysis, What has not been included in the projections is an effect of the higher ECS range causing a sooner ice-free arctic state.  Then The compounding regional warming due to albedo loss is not considered when modelling permafrost degradation and carbon release.  Then these additional feedbacks (albedo and additional emissions, as well as other arctic-related carbon cycle feedbacks - peat and forest declines) are not considered in the long-term analysis.

This, in my opinion is a fatal flaw in the study.  It isn't that they don't report well on the science that is included, it is just that the science that is excluded, due to uncertainty, will make or break or potential for mitigating a doomsday scenario.

2.  June Vs. July insolation values

When we are talking about complete ice-free states we must realize that the existence of ice is what has kept the polar region so temperature steady during the summer months.  As soon as that ice is gone, the albedo shift will significantly raise regional ambient air temperatures (I have seen upwards to 20'C higher than current averages).

The change in albedo means that the absorbed heat energy is cumulative, so no, it isn't 20% it is more like 400%.

3.  Slow vs. fast transition.

I told you that I do not believe that tietsche correctly modeled atmospheric feedbacks in the paper.  you responded by saying that they used a GCM for the arctic.  That is good that they did, I would expect that they did.  However, I do not believe that they included the regional land and extreme ocean surface warming that a June 1 ice free state would bring.  I have seen the enthalphy increase curves for 2007 near shore ESAS and they are MASSIVE, having an ice-free state on June 1st is a scenario that has not been properly modeled.  The primary near term effect is high humidity and residual heat preventing surface air temperatures to drop far below zero for a significant period. 

The second is that the high temperature body of water below the halocline will continue to produce under ice melt.

Finally, relying on those models as a projection of future warming is not realistic because. . .

4.  DURACK et al.

You said that the information doesn't change the 1.5 to 6 C ECS value, are you sure you are not still a climate denier? (being tongue-in-cheek here)

I said that the cumulative energy gain over the last 30 years has been underestimated by between 10 and 30%.  And that the models appeared to fit the northern hemisphere.  Which likely means that the effect of northern hemisphere aerosols has also been severely understated.

These two factors indicate then that the lower range of the ECS is no possible so instead of a 1.5C it is closer to 2.5C as an unlikely minimum.  The fat tail of ECS is now fatter and the most likely value of 3C is now 3.6 to 4 C with a high end range of 8C for a doubling of CO2. 

If long and slow feedbacks are also included (i.e. albedo changes,  ice free arctic, carbon cycle responses) we are already looking to push global temperatures past 4C at CURRENT CO2 abundance levels.
« Last Edit: October 13, 2014, 02:41:45 AM by jai mitchell »
Haiku of Futures Passed
My "burning embers"
are not tri-color bar graphs
+3C today

jai mitchell

  • Nilas ice
  • Posts: 2362
    • View Profile
  • Liked: 208
  • Likes Given: 60
Re: Arctic Summer Sea Ice transition
« Reply #3 on: October 13, 2014, 01:10:29 AM »
This 2008 presentation by David Wasdell  I concour

Haiku of Futures Passed
My "burning embers"
are not tri-color bar graphs
+3C today

jai mitchell

  • Nilas ice
  • Posts: 2362
    • View Profile
  • Liked: 208
  • Likes Given: 60
Re: Arctic Summer Sea Ice transition
« Reply #4 on: October 13, 2014, 01:38:45 AM »
This is a video of Michael Mann describing the inherent conservatism in the IPCC and the intentional downplaying of the high-end scenarios.

Haiku of Futures Passed
My "burning embers"
are not tri-color bar graphs
+3C today

jai mitchell

  • Nilas ice
  • Posts: 2362
    • View Profile
  • Liked: 208
  • Likes Given: 60
Re: Arctic Summer Sea Ice transition
« Reply #5 on: October 13, 2014, 01:49:08 AM »
Other potential IPCC miscalculations:

It should be noted that there are a few basic assumptions involved in the RCP4.5 assumption:


1.  (Saviour Technology) CO2 carbon capture from coal plants will be implemented and emissions will be held steady state after 2035 with reduced emissions even during population growth after 2035.  Current projections hold China to emit 180 GT of carbon by 2100.

2.  Arctic sea ice loss rates will (magically) slow and then stop before summer seas become ice free in the arctic until after 2065 (projections around 2085) allowing for much less global albedo change and keeping summer arctic temperatures closer to the 20-year average.

3.  Magically slower Arctic sea ice loss rates allow for a much slower arctic permafrost melt and associated natural emissions feedbacks.

4.  Thermohaline current continues at only a very slightly decreased intensity, allowing for continued significant natural CO2 sink in the North Sea.

5.  Boreal forests and boreal peat do not significantly contribute to natural emissions.

6.  Greenland and Western Antarctic ice loss rates do not rise significantly due to natural feedbacks and the lack of saviour technology (CCS) to halt emissions.

7.  Amazon forest carbon sequestration continues at current rates.

8.  Climate forcing is consistent with a 2XCO2 sensitivity of 2.3 and not 4.3 'C per doubling of CO2 (Arctic Summmer sea ice free by 2030 scenario).

9.  Natural methane sources do not increase significantly due to magically slow arctic sea ice loss.


as long as those assumptions hold true then we can stay within the RCP 4.5 scenario as well as expect only 1Metre of Sea level rise by 2100.  Otherwise, the scenario is closer to 6-8C of average warming by 2100 with closer to 5 Metres of sea level rise.
Haiku of Futures Passed
My "burning embers"
are not tri-color bar graphs
+3C today

ChrisReynolds

  • Nilas ice
  • Posts: 1764
    • View Profile
    • Dosbat
  • Liked: 20
  • Likes Given: 9
Re: Arctic Summer Sea Ice transition
« Reply #6 on: October 13, 2014, 08:24:07 AM »
1) IPCC. Fat tail? That's the 4.5degC, which takes into account a wide range of evidence. e.g. Annan & Hargreaves, 2006, "Using multiple observationally-based constraints to estimate climate sensitivity" "Based on some conservative assumptions regarding the value of independent estimates, we conclude that climate sensitivity is very unlikely (<5% probability) to exceed 4.5°C. We cannot assign a significant probability to climate sensitivity exceeding 6°C without making what appear to be wholly unrealistic exaggerations about the uncertainties involved."

There is another issue of bias, that is the bias of selecting a small number of studies at the periphery of the main body of evidence to satisfy a preset bias, such as the bias that AGW is not an issue or the bias that AGW is going to be catastrophic in the short term. The IPCC seeks, successfully in my opinion, to tread the middle ground between these extremes.

2) You say: "The change in albedo means that the absorbed heat energy is cumulative, so no, it isn't 20% it is more like 400%" Please provide the calculations for that estimate. While considering this consider how low albedo already gets, and whether it is reasonable to expect ice albedo to fall much further than it has for most of the pack in recent years where it has been first year ice.


Perovich & Polashenski, 2012, "Albedo evolution of seasonal Arctic sea ice."

3) I have outlined to you the massive potential for energy loss from ocean to atmosphere and how this will be more intense the later the open water persists into the autumn/winter. I note that you have ignored my argument on this issue. I also note that in the reply immediately above this in your further points 2 and 3 you perjoratively use the term 'magically', despite having had the mechanism carefully explained to you.

In short the thickness growth feedback is easily powerful enough to overcome massive summer heat gains in the ocean with early ice melt.

4)

Quote
These two factors indicate then that the lower range of the ECS is no possible so instead of a 1.5C it is closer to 2.5C as an unlikely minimum.  The fat tail of ECS is now fatter and the most likely value of 3C is now 3.6 to 4 C with a high end range of 8C for a doubling of CO2. 


Calculations please.

Quote
If long and slow feedbacks are also included (i.e. albedo changes,  ice free arctic, carbon cycle responses) we are already looking to push global temperatures past 4C at CURRENT CO2 abundance levels.

Calculations please.

Surely long and slow are the same thing? The equilibrium operates over centuries so is not relevant to the fate of sea ice this century.

***

Regards your further post: "Other potential IPCC miscalculations:" I agree that IPCC will be biassed low as it is with SLR because key uncertain factors are not included. The IPCC needs to be conservative otherwise they will be open to easy attack.

However the door of uncertainty swings both ways, it remains impossible to say how large these factors will be relative to anthropogenic emissions of CO2. Immediately assuming they represent a catastrophic outcome relative to the anthro-CO2 is not sound. These additional factors, especially methane, may prove not to be a substantial amplfier beyond what is already factored into IPCC WG1 Scientific Basis, just as they may turn out to be significant. FWIW methane is likely to be "chronic not catastrophic" (I agree with Dr Archer here).

ChrisReynolds

  • Nilas ice
  • Posts: 1764
    • View Profile
    • Dosbat
  • Liked: 20
  • Likes Given: 9
Re: Arctic Summer Sea Ice transition
« Reply #7 on: October 13, 2014, 05:13:47 PM »
Jai,

Regards point 2.

The difficult thing about this calculation could be the variation of insolation with both latitude and time.


The albedo evolution could be simplified.


Would it be reasonable to simplify the albedo evolution into three phases?
Winter ice (unmelted surface) = 0.83, absorbed would be 17%, call that 20%.
Ponded ice = 0.3, absorbed would be 70%.
Open water = 0.5, absorbed would be 99.5%, call that 100%.

For May the drop from the solstice is something like 20% at the pole, a bit less at 60degN, but simplify that May is say 17% of June/July insolation, likewise for August (that errs on your side with a high estimate for August insolation).

Take our baseline as the graph of albedo evolution. Consider May to August, percentage absorbed of units of insolation, where 100 units is insolation in June and July.

May 20% of 80
June 70% of 100
July 70% of 100
August 70% of 80

197.6 units of insolation are absorbed - that is the baseline for calculating percent change.

Now lets start the melt ponding on 1 May, and open water through August.

May 70% of 80
June 70% of 100
July 70% of 100
August 100% of 80

276 units of insolation are absorbed, a 40% increase.

Now lets stick with the start of melt ponding on 1 May, but we have open water through July and August.

May 70% of 80
June 70% of 100
July 100% of 100
August 100% of 80

306 units of insolation are absorbed, a 60% increase (rounded up).

So I don't see a 400% increase as likely.

Let me know if this seems a reasonable way of getting a ballpark figure. Got to dash.
« Last Edit: October 13, 2014, 05:20:46 PM by ChrisReynolds »

jai mitchell

  • Nilas ice
  • Posts: 2362
    • View Profile
  • Liked: 208
  • Likes Given: 60
Re: Arctic Summer Sea Ice transition
« Reply #8 on: October 13, 2014, 07:19:35 PM »
1.  You are using 90N as a representation of the arctic region, an integral of insolation per m^2 between 75N and 90N and over time say, May 1st through Sept 30th.

2.  Then an average albedo regime can be inferred over the arctic area.  (assume percent melt pond and ice cover.  Realize that we are talking about much thinner ice in the early melt scenario. so different melting dynamics (more from the center out than the outside in.)

3.  Since we are talking about relative values cloud cover can be neglected, In later analyses they can be included to develop a temperature regime change.


fortunately, this work has been done before and the integrals are available online: http://www.ncdc.noaa.gov/paleo/pubs/huybers2006b/huybers2006b.html

I recommend using this matlab script.

ftp://ftp.ncdc.noaa.gov/pub/data/paleo/climate_forcing/orbital_variations/huybers2006insolation/daily_insolation.m

This matlab script will successfully perform the necessary calculations just use zero as the thousands of years before present (it is a paleo analysis program).

I don't have matlab currently available but could install, do you run it?

Average albedo over time

for June 1st vs July 1st.

1.  Assume melt ponding forms may 1st for both the june and july melts
2.  Assume May 1st ponding is 80% for June 1 and 20% for July 1st (increasing to 80% by june 1st)

according to this regime, the difference in albedo between (A) june 1st and (B) july 1st is estimated to be the following:

A - May 1-June 1 = .3
B - May 1 - June 1 = .6

A June 1 - Sept 30 = .1

B June 1 - July 1 = .4
B July 1 - Sept 30 = 1.

So, use the matlab script to determine solar insolation values between 75N and 90N for the above dates and multiply those values by the averages I propose.  Then you will get a daily absorbed value.

Sum the dailies between the two regimes and voila!
« Last Edit: October 13, 2014, 07:36:15 PM by jai mitchell »
Haiku of Futures Passed
My "burning embers"
are not tri-color bar graphs
+3C today

iceman

  • Frazil ice
  • Posts: 285
    • View Profile
  • Liked: 7
  • Likes Given: 19
Re: Arctic Summer Sea Ice transition
« Reply #9 on: October 14, 2014, 12:47:42 PM »
....
Would it be reasonable to simplify the albedo evolution into three phases?
....

That helps with the calculations for a ballpark estimate.  However, my impression from Schröder et.al. and the CICE simulation is that the timing of the first albedo dip (between melt pond formation and drainage) is crucial.  An early start to melt ponding, or a longer interval before the ponds drain, could have a disproportionate effect on ice area/extent later in the season.

ChrisReynolds

  • Nilas ice
  • Posts: 1764
    • View Profile
    • Dosbat
  • Liked: 20
  • Likes Given: 9
Re: Arctic Summer Sea Ice transition
« Reply #10 on: October 14, 2014, 06:53:42 PM »
Jai,

I was just trying to help out with a simple estimate for one of the statements for which I asked for calculations. Didn't get round to looking at the others - I'm so tired now I can't recall what they were.

However if you want to use a more complex calculation then feel free. It was after all one of the figures I asked you to justify.

Iceman,

Given the massive crash in albedo due to melt ponding, the impact on thinning, and the impact of thinning on open water production, I agree early melt ponding is important. This is likely to be especially the case for ice around 2m thick because even a small increase in net summer thinning (typical 1.5m IIRC) can have a large impact on end of season open water production - the April thickness being relatively close to typical seasonal thinning.

jai mitchell

  • Nilas ice
  • Posts: 2362
    • View Profile
  • Liked: 208
  • Likes Given: 60
Re: Arctic Summer Sea Ice transition
« Reply #11 on: October 14, 2014, 08:03:07 PM »
Chris

Simply using this analog:

Quote
A - May 1-June 1 = .3
B - May 1 - June 1 = .6

A June 1 - Sept 30 = .1

B June 1 - July 1 = .4
B July 1 - Sept 30 = 1.

We can see that the difference in cumulative energy deposition during the melt season is significantly greater for the June 1st ice loss regime.

The point being that, instead of 20% more heat energy, the earlier regime will produce a much greater regional warming, subsurface warm pool intensity and delayed ice reformation (with accompanying under ice mass loss effects)

what is also not considered is regional land-heating effects and surface water runoff effects.  Once the ice is gone we will see a 20C regional temperature spike and convective heating becoming a major factor as well as down/shortwave absorption.
Haiku of Futures Passed
My "burning embers"
are not tri-color bar graphs
+3C today

ChrisReynolds

  • Nilas ice
  • Posts: 1764
    • View Profile
    • Dosbat
  • Liked: 20
  • Likes Given: 9
Re: Arctic Summer Sea Ice transition
« Reply #12 on: October 14, 2014, 10:25:50 PM »
OK, so we're moving on...

"delayed ice reformation (with accompanying under ice mass loss effects)."

But I have argued that the delayed ice reformation may not produce as much a thinning in winter as some seem to think. Using Semptner's simple model (which seems to me to be at the heart of sea ice growth, and the modelling thereof), I have used a simple example to demonstrate the effect.

An objection has been raised that taking it to May is unrealistic, this is not the case, in the Central Arctic thickening continues to May, and as the peripheral seas are mainly seasonal now (even in the last two years), the Central Arctic region is the one that matters.

What is unrealistic is the constant -15degC. However -15degC is not as cold as in mid winter over the Central Arctic, and I wanted to keep things simple to pull out the effect I outline.

Heat flux through the ice is proportional to 1/thickness (of sea ice). To generate various freeze start dates the temperature of the surface is kept at the same temperature of the ice/ocean interface (i.e. -1.8degC), until I want freezing to start, at which time it is set to -15degC.


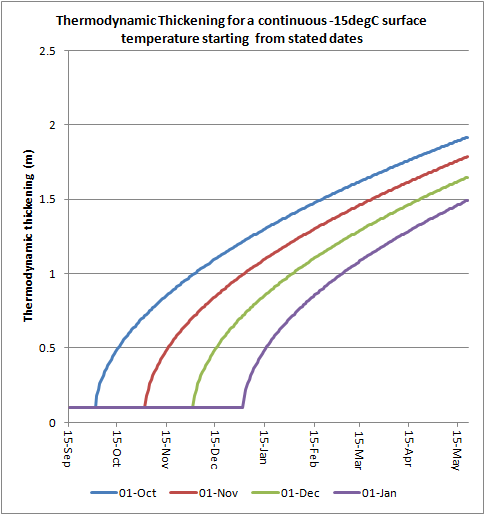
Looking at the end thickness on 15 May and the proportion of the freeze season, the impact of delayed freeze can be seen. For 1 October being 100% of the freeze season, and for the 1 October case thickness on 15 May being 100% thickness:

For 87% of the freeze season growth is 93%.
For 74% of the freeze season growth is 87%.
For 61% of the freeze season growth is 79%.

So there is a diminishing return on delaying the freeze season, although at some point you will get substantially thinner ice, the point is the large growth rates as the freeze starts and the rate reduces as the ice thickens, so the effect of delaying the freeze season is not as much as expected by many.

In reality of course the late start will happen as the ocean vents heat warming the atmosphere, and the thinner ice later in the season will also allow heat through, leading to further winter warming of the atmosphere. How to treat this in a simple way as we don't have a public copy of PIOMAS on which to perform experiments.

Here I turn to Freezing Degree Days (FDD), where monthly avg temperature is negative, I've used the sum of monthly average temperature multiplied by days in month for September through to the following April, temperature being NCEP/NCAR 2m temperature for the ESS.

Take 2007 and 2012 they had FDDs of 3972, and 3869 respectively. The average FDD for the 2000s was 3953. So even those extreme lows were unable to severely reduce FDD, the ice thickness resulting were of the order of 2m thick.

The problem is this: Winter is damned cold. Every way I look at it I have found that winter will remain damned cold, cold enough to make sure much of the pack is near 2m thick minimum within the Arctic Ocean, such thicknesses are not melting out totally.

To get to a July loss regime, virtually ice free (or at least substantil open water in July), PIOMAS April thickness needs to drop by around 1m in April from thicknesses typical of recent years, as shown by experiment. Now I am prepared to be loose on this, we don't know at what point between 2m and 1m early June loss is feasible, So I'll give down to 1.5m as the sort of April thickness needed to give massive open water by July, that's at least 2 months at the end of summer with near as damn it virtually ice free conditions.

I'm struggling to see anything but words supporting your June 1st loss scenario, no papers, no math, in other words nothing convincing. I'll meet you 'halfway' with a July loss scenario at an April thickness of around 1.5m. But to get that FDDs need to drop by around half.


Now maybe we're talking at cross purposes, maybe you envisage this happening after 2025, OK I reckon mid 2020s to mid 2030s. But I get the feeling you're talking about something more imminent than that (this decade?).

Quote
what is also not considered is regional land-heating effects and surface water runoff effects.  Once the ice is gone we will see a 20C regional temperature spike and convective heating becoming a major factor as well as down/shortwave absorption.

Once again, where is the evidence for your stated 20degC spike?

Lawrence et al "Accelerated Arctic land warming and permafrost degradation during rapid sea ice loss." finds a warming of 3degC/decade in Oct Nov Dec during periods of rapid ice loss on land immediately adjacent to the Arctic Ocean in CCSM 3. However post 2007 the average temperature for OND is -17degC, which implies many decades to get the region to zero degC. Lets say that's biassed low, let's double the warming rate (not happening right now 1979 to 1986 avg OND temperature was -22.7degC, 1999 to 2006 was -19.0degC).... Let's double it to 6degC per decade, and assume it applies from now onwards, that is still three decades until OND temperatures are around 0 degC.

River discharges will affect that peripheral seas, and may be a significant factor in them already being seasonal. But remember, to get the pack to virtually zero in the late summer we're looking at the Central Arctic, where the effect of river discharge will be less.

jai mitchell

  • Nilas ice
  • Posts: 2362
    • View Profile
  • Liked: 208
  • Likes Given: 60
Re: Arctic Summer Sea Ice transition
« Reply #13 on: October 15, 2014, 12:33:18 AM »
Chris,

Quote
The problem is this: Winter is damned cold. Every way I look at it I have found that winter will remain damned cold, cold enough to make sure much of the pack is near 2m thick minimum within the Arctic Ocean, such thicknesses are not melting out totally.

Yes, it will definitely be cold (damn cold!) but we cannot assume that ice coverage and thickness will remain at todays value through. . .when? forever?  You say you have trouble "seeing it" but mention in your own references that the shift to a perennially ice free state will occur under current warming scenarios.

Thickness over the CAB last year maxed out with an average value less than 2 meters.  http://www7320.nrlssc.navy.mil/hycomARC/navo/arcticictn/nowcast/ictn2014042218_2014042500_039_arcticictn.001.gif

What do you suppose it will be at 500 ppmv co2?

Do you have a good value for FDD for last year, I seem to think it will be lower than recent values.

Papers? you want papers?

Serreze, M. C., Holland, M. M. & Stroeve, J. Perspectives of the Arctic’s shrinking
ice cover. Science 315, 1533–1536 (2007).

Comiso, J. C., Parkinson, C. L., Gersten, R. & Stock, L. Accelerated decline in the
Arctic sea ice cover. Geophys. Res. Lett. 35, doi:10.1029/2007GL031972 (2008).
https://courses.seas.harvard.edu/climate/seminars/pdfs/comiso_etal_2008.pdf

I have been looking for the reference paper for some time now and can't seem to locate it, I will try again at another date.  I have always been a "conceptualist" I take a synergistic and holistic approach to my understanding of the nature of things and utilize thought experiments to approach reasoned assessments.  In doing this, I can tell you why the Eemian climate optimum only was 1.5C higher than todays values and also show why WAIS calving will move inland faster than sublimation can make up for the ice loss in future decades.   Similarly, I can see what regional water surface and land surface contributions to air temperatures are going to do in a June 1st ice free arctic state. 

However, I am specifically referencing a paper from a UC Santa Cruz researcher (I think) that modelled an Ice free June 1st and used regional temperature warming to imply a permafrost disassociation model.  I cannot for the life of me find it. 

There is a significant body of work that says that it will be much higher:

well, here is one, it only shows an 8C temperature increase (average summer season) 
http://www.gfdl.noaa.gov/bibliography/related_files/mw0901.pdf
Sea Ice–Albedo Feedback and Nonlinear Arctic Climate Change


but this is the one you are probably most interested in:
Current GCMs’ Unrealistic Negative Feedback in the Arctic
http://journals.ametsoc.org/doi/pdf/10.1175/2009JCLI2885.1

Quote
To get to a July loss regime, virtually ice free (or at least substantial open water in July), PIOMAS April thickness needs to drop by around 1m in April from thicknesses typical of recent years, as shown by experiment.

Remember, we are not talking about conditions similar to recent years, we are talking about a scenario where there is ice free states in June 1st.  The July 1st ice free state would have occurred some decade (ish) before that.

Have you considered a scenario that is mimicking the late Eeocene?  I am talking a total collapse of the arctic cell with the Ferrell cell moving vast amount of subtropic (and occasional tropic) moisture into the CAB.


I am talking about rain on the CAB in April. 
« Last Edit: October 15, 2014, 04:11:22 AM by jai mitchell »
Haiku of Futures Passed
My "burning embers"
are not tri-color bar graphs
+3C today

AbruptSLR

  • Multi-year ice
  • Posts: 19703
    • View Profile
  • Liked: 2268
  • Likes Given: 286
Re: Arctic Summer Sea Ice transition
« Reply #14 on: October 15, 2014, 06:01:19 PM »
First, I would like to admit that I have relatively little to contribute to this conversation; however, I would like to note that it is my opinion that the faux global warming hiatus acting since about 1999, has masked some of the potential Arctic Amplification that the Arctic might have otherwise experienced, and the linked reference indicates that for high rates of GHG emissions (such as we have now) "… there is little chance of a hiatus decade occurring beyond 2030, even in the event of a large volcanic eruption."

As I believe that we are now entering a positive phase of the IPO, this research implies that we may never see another negative phase of the IPO (for the rest of this century).  Therefore, I expect Arctic Amplification to accelerate in the coming decades:

a) As La Nina's become less frequent and as El Nino's vent more sequestered heat from the ocean;
 b) As China cleans-up its aerosol emission (thus reducing a major negative feedback);
c) As the North Pacific comes into sync with the North Atlantic 
d) As the permafrost (both on land and underwater) degradation accelerates;
e) As ocean acidification suppresses the production of dimethylsulphide (DMS);
f) As NH albedo increases due to reduced snow cover, and increased plant growth in the northern latitudes;
g) As the Arctic atmospheric OH supply diminishes thus increasing the GWP of regional atmospheric CH4;
h) As the frequency and extent of wildfires increase (particularly in northern latitudes);
i) As the size of plankton diminishes, thus making it more difficult for the oceans to sequester CO₂;
j) As increasing upwelling (particularly in the Southern Ocean) increases CO₂venting from the oceans;
k) As heat stress decreases the ability of terrestrial plants to sequester CO2;
l) As world populations continue to grow;
m) As the amount of volatile organic compounds (VOCs) emitted by forests decrease (due to climate change related stress).


Nicola Maher, Alexander Sen Gupta and Matthew H. England, (2014), "Drivers of decadal hiatus periods in the 20th and 21st Centuries", Geophysical Research Letters, DOI: 10.1002/2014GL060527


http://onlinelibrary.wiley.com/doi/10.1002/2014GL060527/abstract


Abstract: "The latest generation of climate model simulations are used to investigate the occurrence of hiatus periods in global surface air temperature in the past and under two future warming scenarios. Hiatus periods are identified in three categories, (i) those due to volcanic eruptions, (ii) those associated with negative phases of the Interdecadal Pacific Oscillation (IPO) and (iii) those affected by anthropogenically released aerosols in the mid 20th Century. The likelihood of future hiatus periods is found to be sensitive to the rate of change of anthropogenic forcing. Under high rates of greenhouse gas emissions there is little chance of a hiatus decade occurring beyond 2030, even in the event of a large volcanic eruption. We further demonstrate that most non-volcanic hiatuses across CMIP5 models are associated with enhanced cooling in the equatorial Pacific linked to the transition to a negative IPO phase."
« Last Edit: October 16, 2014, 05:15:26 PM by AbruptSLR »
“It is not the strongest or the most intelligent who will survive but those who can best manage change.”
― Leon C. Megginson

AbruptSLR

  • Multi-year ice
  • Posts: 19703
    • View Profile
  • Liked: 2268
  • Likes Given: 286
Re: Arctic Summer Sea Ice transition
« Reply #15 on: October 15, 2014, 06:40:19 PM »
The linked reference in the March 2014 issue of the Proceedings of the National Academy of Sciences suggests that the Arctic amplification effect, hypothesized nearly 50 years ago, is considerably larger than climate models have predicted. The researchers found that thanks to shrinking sea ice, the albedo of the Arctic has decreased by about 50 percent since 1979. This in turn has resulted in a considerable amount of solar energy being added to the Arctic Ocean region (6.4 ± 0.9 W/m2).

Averaged over the globe, the heat buildup from the decrease of Arctic albedo, if averaged over the globe, is equal to 25 percent of the warming due to the increase in carbon dioxide in the atmosphere since 1979.

http://www.pnas.org/content/111/9/3322.full.pdf+html

While, this type of research findings are probably already accounted for in the discussion in this thread, I am posting it because Arctic amplification may well be a non-linear positive feedback mechanism, that could well become much more significant in the next few decades, than in the past few decades.
“It is not the strongest or the most intelligent who will survive but those who can best manage change.”
― Leon C. Megginson

ChrisReynolds

  • Nilas ice
  • Posts: 1764
    • View Profile
    • Dosbat
  • Liked: 20
  • Likes Given: 9
Re: Arctic Summer Sea Ice transition
« Reply #16 on: October 16, 2014, 07:15:21 PM »
Freezing degree days worked out from NCEP/NCAR monthly data, so it's not ideal but gives an indication. Data for the ESS, NCEP/NCAR is down so I can't get the data for the central Arctic and I'm not set up to use netcdf (I need to write code to access such files). Anyway winter over the Central Arctic is colder.

Year   FDD
1979   5005.59
1980   5053.11
1981   4840.23
1982   4491.6
1983   4861.47
1984   4991.37
1985   4902.51
1986   4906.11
1987   5056.83
1988   5073.78
1989   4541.19
1990   4422.06
1991   4825.71
1992   4432.77
1993   4780.26
1994   4913.61
1995   4538.43
1996   4171.5
1997   4528.29
1998   4463.79
1999   4562.16
2000   4168.92
2001   4141.32
2002   4068.9
2003   3721.98
2004   3782.64
2005   4108.35
2006   4167.96
2007   3938.88
2008   3972.69
2009   4021.59
2010   3847.86
2011   3497.61
2012   4185.48
2013   3869.16
2014   3798.27

The stated year cover September in the preceding year to May in the stated year, only months with negative average temperature contribute.

It will very likely take decades for winter temperatures to increase enough for April thickness to be thin enough to ensure summer melt out. It will take even longer for winter ice cover to crash, that will probably be due to cloud radiative feedback (e.g. Abbott & Tzipperman).

Grid box effective thickness in PIOMAS for April in the CAA, 2007 to 2014
2.093816276
2.255792241
2.193888985
2.018353525
1.859688135
1.997487094
1.91567155
2.054618919


Papers? Serreze et al, Comiso et al, sorry I'm struggling to understand the relevance.

Winton 2008, based on an energy balance model and ECHAM5. See this page:
http://www.smhi.se/forskning/forskningsomraden/klimatforskning/regional-arctic-scenario-experiments-with-rcao-1.8830
ECHAM5 shows drops with recoveries before 2050 but only shows persistent near ice free state after the 2050s. So again, I'm sorry but I struggle to see the relevance.

I blogged about Boe et al in the spring of 2012:
http://dosbat.blogspot.co.uk/2012/04/musings-on-models.html

Quote
Remember, we are not talking about conditions similar to recent years, we are talking about a scenario where there is ice free states in June 1st.  The July 1st ice free state would have occurred some decade (ish) before that.

I asked above whether you thought the process would be slow or fast, OK the question was more implied than direct:
Quote
Now maybe we're talking at cross purposes, maybe you envisage this happening after 2025, OK I reckon mid 2020s to mid 2030s. But I get the feeling you're talking about something more imminent than that (this decade?).

We seem to have shifted again, you now seem to be advancing well beyond the time we can expect the first regular late summer virtually ice free state, and jumping 'decades' ahead to June open water. Say we accept that the virtually ice free (VIF) starts to be regular from the mid 2020s to mid 2030s, say we accept that a decade is needed for each month of such a state, August VIF in 2045(ish), July VIF in 2055(ish), June VIF in 2065(ish). Might be somewhat aggressive, but I wouldn't argue strongly against such a timescale, if emissions continue to increase, and are augmented by cloud radiative feedback over winter.

ChrisReynolds

  • Nilas ice
  • Posts: 1764
    • View Profile
    • Dosbat
  • Liked: 20
  • Likes Given: 9
Re: Arctic Summer Sea Ice transition
« Reply #17 on: October 16, 2014, 07:20:03 PM »
Abrupt SLR,

Due to enhanced warming in the Arctic, Arctic Amplification may well have been enhanced as mid latitudes have not warmed as much as they would without the hiatus. But the time period is too short to say anything with confidence.

Here is a plot of the temperature difference between the Arctic and mid latitudes from an old blog post of mine up to 2012, not got round to updating.


You can see that despite the 'hiatus' in GW the temperature difference has continued to fall (the Arctic warming faster than mid latitudes).

AbruptSLR

  • Multi-year ice
  • Posts: 19703
    • View Profile
  • Liked: 2268
  • Likes Given: 286
Re: Arctic Summer Sea Ice transition
« Reply #18 on: October 16, 2014, 07:46:25 PM »
Abrupt SLR,

Due to enhanced warming in the Arctic, Arctic Amplification may well have been enhanced as mid latitudes have not warmed as much as they would without the hiatus. But the time period is too short to say anything with confidence.

...

You can see that despite the 'hiatus' in GW the temperature difference has continued to fall (the Arctic warming faster than mid latitudes).

Chris,

First, I concur that the statistical time period is too short to say anything with confidence.

Second, my point was not that the faux hiatus was redistributing surface heat away from mid-latitudes to the polar regions (which would incorrectly imply that Polar Amplification was a short-term phenomena temporarily created by the faux hiatus); instead I meant to implies that during the faux hiatus surplus heat was temporarily going into the ocean; which may have limited the amount of Artic Amplification that would have occurred without the faux hiatus, and that furthermore, when the PDO & AMO move synchronously into warming phases in the next ten to twenty years that Arctic Amplification may accelerate.

Third, paleo-evidence indicates that Polar Amplification is a real, long-term, trend that cannot be ignored as indicated by the following Brigham-Grette et al (2013) reference:

Julie Brigham-Grette, Martin Melles, Pavel Minyuk, Andrei Andreev, Pavel Tarasov, Robert DeConto, Sebastian Koenig, Norbert Nowaczyk, Volker Wennrich, Peter Rosén, Eeva Haltia, Tim Cook, Catalina Gebhardt, Carsten Meyer-Jacob, Jeff Snyder, Ulrike Herzschuh, (2013), "Pliocene Warmth, Polar Amplification, and Stepped Pleistocene Cooling Recorded in NE Arctic Russia", Science, Vol. 340 no. 6139 pp. 1421-1427, DOI: 10.1126/science.1233137


http://www.sciencemag.org/content/340/6139/1421.abstract


Abstract: "Understanding the evolution of Arctic polar climate from the protracted warmth of the middle Pliocene into the earliest glacial cycles in the Northern Hemisphere has been hindered by the lack of continuous, highly resolved Arctic time series. Evidence from Lake El’gygytgyn, in northeast (NE) Arctic Russia, shows that 3.6 to 3.4 million years ago, summer temperatures were ~8°C warmer than today, when the partial pressure of CO2 was ~400 parts per million. Multiproxy evidence suggests extreme warmth and polar amplification during the middle Pliocene, sudden stepped cooling events during the Pliocene-Pleistocene transition, and warmer than present Arctic summers until ~2.2 million years ago, after the onset of Northern Hemispheric glaciation. Our data are consistent with sea-level records and other proxies indicating that Arctic cooling was insufficient to support large-scale ice sheets until the early Pleistocene."

Best,
ASLR
“It is not the strongest or the most intelligent who will survive but those who can best manage change.”
― Leon C. Megginson

P-maker

  • Frazil ice
  • Posts: 389
    • View Profile
  • Liked: 72
  • Likes Given: 0
Re: Arctic Summer Sea Ice transition
« Reply #19 on: October 16, 2014, 08:34:28 PM »
Jai, Chris, ASLR et al.

You have been looking for cases, where a rapid warming (phase change) will lead to a 20 degrees C spike in the Arctic.

I know of one example (see here:  http://www.dmi.dk/fileadmin/Rapporter/DKC/dcc07-02.pdf )

If you take a closer look at figure 7 (e), you may see an area north of Svalbard, where future temperatures are expected to be 20 degrees warmer than now during winter.

Do I have to remind you, that this area was already considerably warmer during this past winter (DJF). According to this link:  http://www.yr.no/place/Norway/Svalbard/Longyearbyen/statistics.html Svalbard Airport was approaching the 20 K anomaly for several weeks this winter, which indicates that the modelling results may be correct wrt. the 20 K anomaly, but just off by some 70 years. 

Cheers P

AbruptSLR

  • Multi-year ice
  • Posts: 19703
    • View Profile
  • Liked: 2268
  • Likes Given: 286
Re: Arctic Summer Sea Ice transition
« Reply #20 on: October 16, 2014, 10:48:06 PM »
I would also like to note that in the Antarctic folder I has suggested that if/when the West Antarctic Ice Sheet, WAIS, collapses this will raise sea levels south of the Bering Strait (see the attached image of the normalized change in local sea level for a one unit contribution to SLR from the WAIS), which will result in warm ocean water pushing north from the Pacific Ocean through the Bering Strait into the Arctic Ocean, where it will accelerate the loss of Arctic Sea Ice.  While many/most people believe that the potential collapse of the WAIS could not begin for some appreciable length of time in the future; however, the forward to the linked (free access) US Department of Defense report on Climate Change Adaption, includes the following statement:

extract: "In places like the Hampton Roads region in Virginia, which houses the largest concentration of US military sites in the world, we see recurrent flooding today, and we are beginning work to address a projected sea-level rise of 1.5 feet over the next 20 to 50 years."

http://www.acq.osd.mil/ie/download/CCARprint.pdf

http://www.newscientist.com/article/dn26379-pentagon-warns-the-us-military-of-climate-change.html#.VD7h_KPn_IU

This statement by the US Secretary of Defense Chuck Hagel indicates that at the upper end, the US military is planning to deal with 1.5 ft of sea-level rise over 20 yrs; which is an average of 22.9 mm/yr; however as currently, SLR is 3.17 mm/yr, and using a linear approximation, this implies that the military is planning for a SLR of about 43 mm/yr by 2034 offshore of Virginia.  This is only possible if the US military is acknowledging that it is plausible that key parts of the WAIS could begin collapsing within the next approximately 5 years.
« Last Edit: October 17, 2014, 12:25:48 AM by AbruptSLR »
“It is not the strongest or the most intelligent who will survive but those who can best manage change.”
― Leon C. Megginson

viddaloo

  • Nilas ice
  • Posts: 1302
  • Hardanger Sometimes
    • View Profile
  • Liked: 1
  • Likes Given: 0
Re: Arctic Summer Sea Ice transition
« Reply #21 on: October 17, 2014, 01:10:37 AM »
Say we accept that the virtually ice free (VIF) starts to be regular from the mid 2020s to mid 2030s, say we accept that a decade is needed for each month of such a state, August VIF in 2045(ish), July VIF in 2055(ish), June VIF in 2065(ish). Might be somewhat aggressive, but I wouldn't argue strongly against such a timescale, if emissions continue to increase, and are augmented by cloud radiative feedback over winter.
Aggressive?! Simple crash graphs for each month will give you crash years that indicate the next 5 months will follow September and go ice–free in well under a decade. How long the Winter months will take to go ice–free after that, is more uncertain, but it seems pretty obvious 50% of the months will have (some) ice–free days 5–10 years after September has its first Zero Ice Day.
[]

AbruptSLR

  • Multi-year ice
  • Posts: 19703
    • View Profile
  • Liked: 2268
  • Likes Given: 286
Re: Arctic Summer Sea Ice transition
« Reply #22 on: October 17, 2014, 04:02:07 AM »
The linked NASA article indicates that more data is required in order to see deeper into the Arctic's cloudy future:

http://science.nasa.gov/science-news/science-at-nasa/2014/15oct_seaice2/
“It is not the strongest or the most intelligent who will survive but those who can best manage change.”
― Leon C. Megginson

ChrisReynolds

  • Nilas ice
  • Posts: 1764
    • View Profile
    • Dosbat
  • Liked: 20
  • Likes Given: 9
Re: Arctic Summer Sea Ice transition
« Reply #23 on: October 17, 2014, 07:32:06 PM »
Say we accept that the virtually ice free (VIF) starts to be regular from the mid 2020s to mid 2030s, say we accept that a decade is needed for each month of such a state, August VIF in 2045(ish), July VIF in 2055(ish), June VIF in 2065(ish). Might be somewhat aggressive, but I wouldn't argue strongly against such a timescale, if emissions continue to increase, and are augmented by cloud radiative feedback over winter.
Aggressive?! Simple crash graphs for each month will give you crash years that indicate the next 5 months will follow September and go ice–free in well under a decade. How long the Winter months will take to go ice–free after that, is more uncertain, but it seems pretty obvious 50% of the months will have (some) ice–free days 5–10 years after September has its first Zero Ice Day.

I don't know what you mean by 'crash graphs'.

crandles

  • Young ice
  • Posts: 3379
    • View Profile
  • Liked: 239
  • Likes Given: 81
Re: Arctic Summer Sea Ice transition
« Reply #24 on: October 17, 2014, 08:18:28 PM »

jai mitchell

  • Nilas ice
  • Posts: 2362
    • View Profile
  • Liked: 208
  • Likes Given: 60
Re: Arctic Summer Sea Ice transition
« Reply #25 on: October 17, 2014, 09:39:20 PM »
Regional ice loss sends Barrow AK autumn temperatures soaring.

http://www.climatenewsnetwork.net/2014/10/ice-loss-sends-alaskan-temperatures-soaring/
Quote
In the last 34 years, the average October temperature in Barrow has risen by more than 7°C − an increase that, on its own, makes a mockery of international efforts to prevent global temperatures from rising more than 2°C above their pre-industrial level.
A study by scientists at the University of Alaska Fairbanks analysed several decades of weather information. These show that temperature trends are closely linked to sea ice concentrations, which have been recorded since 1979, when accurate satellite measurements began.

In that period, the average annual temperature rose by 2.7°C. But the November increase was far higher − more than six degrees. And October was the most striking of all, with the month’s average temperature 7.2°C higher in 2012 than in 1979.

and

Quote
They have ruled out the effects of sunlight because, by October, the sun is low in the sky over Barrow and, by late November, does not appear above the horizon.

Instead, they say, the north wind picks up stored heat from water that is no longer ice-covered in late autumn and releases it into the atmosphere.
Haiku of Futures Passed
My "burning embers"
are not tri-color bar graphs
+3C today

AbruptSLR

  • Multi-year ice
  • Posts: 19703
    • View Profile
  • Liked: 2268
  • Likes Given: 286
Re: Arctic Summer Sea Ice transition
« Reply #26 on: October 17, 2014, 11:08:12 PM »
The linked NASA article indicates that more data is required in order to see deeper into the Arctic's cloudy future:

http://science.nasa.gov/science-news/science-at-nasa/2014/15oct_seaice2/

I believe that the linked NASA article is referring to the linked reference as it discusses potentially important absorbed solar radiation (ASR) – Arctic sea ice concentration (SIC) relationship. This ASR-SIC relationship is currently not represented in most of the current climate models, and thus the majority of GCM projections may possibly underestimate the important positive feedback mechanism of Arctic amplification, and if true this would mean that they underestimate projections of future increases in mean global warming:

Yong-Sang Choi, Baek-Min Kim, Sun-Kyong Hur, Seong-Joong Kim, Joo-Hong Kim and Chang-Hoi Ho, (2014), "Connecting early summer cloud-controlled sunlight and late summer sea ice in the Arctic", Journal of Geophysical Research Atmospheres DOI: 10.1002/2014JD022013

http://onlinelibrary.wiley.com/doi/10.1002/2014JD022013/abstract

Abstract: "This study demonstrates that absorbed solar radiation (ASR) at the top of the atmosphere in early summer (May–July) plays a precursory role in determining the Arctic sea ice concentration (SIC) in late summer (August–October). The monthly ASR anomalies are obtained over the Arctic Ocean (65°N–90°N) from the Clouds and the Earth's Radiant Energy System during 2000–2013. The ASR changes primarily with cloud variation. We found that the ASR anomaly in early summer is significantly correlated with the SIC anomaly in late summer (correlation coefficient, r  ≈ −0.8 with a lag of 1 to 4 months). The region exhibiting high (low) ASR anomalies and low (high) SIC anomalies varies yearly. The possible reason is that the solar heat input to ice is most effectively affected by the cloud shielding effect under the maximum TOA solar radiation in June and amplified by the ice-albedo feedback. This intimate delayed ASR-SIC relationship is not represented in most of current climate models. Rather, the models tend to over-emphasize internal sea ice processes in summer."
“It is not the strongest or the most intelligent who will survive but those who can best manage change.”
― Leon C. Megginson

jdallen

  • Young ice
  • Posts: 3411
    • View Profile
  • Liked: 651
  • Likes Given: 244
Re: Arctic Summer Sea Ice transition
« Reply #27 on: October 17, 2014, 11:30:49 PM »
Jumping into the fray with a few quick thoughts...

Regarding what 500ppm CO2 do to the freeze\melt - not much until total heat in the system catches up with the change in forcing. It's current heat in the system that will determine outcomes, not the incremental small prompt increases in forcing.

Regarding the hiatus in warming ... I wish people wouldn't say that, because heat inputs into the system haven't changed, and the forcing from CO2 continues to increase.  The heat is just getting directed to where we can't  seeing it, instead of atmospheric temperatures.

Regarding degree days, and 20C+ changes to cut them such that we see full melt out - this is not going to be consistent, period.  There's a spot just off west Svalbard where an upwelling has kept SSTs above 8C for a couple of years.  It contributed to keeping the basin immediately north of the island (~100K KM2) ice free until weather started pushing the pack hard enough to overwhelm it.  My point here is, we are starting to see discrete regional changes where major increases are  in play.  Year to year metrics are going to start swinging pretty wildly and randomly.  I think our ability to skillfully predict anything beyond about a three month window will have such a range of probability to be almost nonsensical.
This space for Rent.

ChrisReynolds

  • Nilas ice
  • Posts: 1764
    • View Profile
    • Dosbat
  • Liked: 20
  • Likes Given: 9
Re: Arctic Summer Sea Ice transition
« Reply #28 on: October 18, 2014, 06:56:04 AM »
Abrupt SLR,

Choi et al: This is really confirming what many of us have thought for some time, about the preconditioning of early melt on the pack under open skies before and around the solstice. Using net top of atmosphere sunlight, a cloudy period will reflect sunlight back up, resulting in less net light because the amount reflected back into space reduces the amount that hits the ice.

JD Allen,

The warm anomaly off Svalbard seems to me to be a result of open water being there instead of ice. The ice insulates the atmosphere from ocean, and in the past it was more typical there. Now that it is gone temperatures are much higher than the climatology.

Obviously warming plays a role in ice loss. However viewing the warming as causing ice loss in cases such as Svalbard may not be sound - because the high temperatures are the result of a lack of ice, not the cause.

Crandles,

I suspect it is this graph:
http://forum.arctic-sea-ice.net/index.php/topic,119.msg37908.html#msg37908

However as with the statement I questioned, Viddaloo has been rather vague about the method behind the above graph. I have managed to produce a very similar graph using monthly PIOMAS data, the points shown could be the zero crossing years for an exponential fit extrapolated to zero for each month. Of course that method is unsound because of the preferrential thinning of thick multi year ice. But because Viddaloo remains rather vague I cannot say whether that affects the graph I linked to above.

jdallen

  • Young ice
  • Posts: 3411
    • View Profile
  • Liked: 651
  • Likes Given: 244
Re: Arctic Summer Sea Ice transition
« Reply #29 on: October 18, 2014, 07:14:22 AM »
Abrupt SLR,
JD Allen,

The warm anomaly off Svalbard seems to me to be a result of open water being there instead of ice. The ice insulates the atmosphere from ocean, and in the past it was more typical there. Now that it is gone temperatures are much higher than the climatology.

Obviously warming plays a role in ice loss. However viewing the warming as causing ice loss in cases such as Svalbard may not be sound - because the high temperatures are the result of a lack of ice, not the cause.

My sense has been its an artifact of current - a persistent limb of the North Atlantic Drift split off driven to the surface by sea bottom topology.  We shall have to plumb the depths to sort it, as it were, I suspect.

The key is it is heat.  I'm a little skeptical of the ice being able to squelch it by overriding it; that's an awful serious hot spot.  That said, you may be right about it not really being key to affecting the sea surface north of Svalbard.  It has been typically pretty localized.
This space for Rent.

ChrisReynolds

  • Nilas ice
  • Posts: 1764
    • View Profile
    • Dosbat
  • Liked: 20
  • Likes Given: 9
Re: Arctic Summer Sea Ice transition
« Reply #30 on: October 18, 2014, 09:04:19 AM »
Yes, the lack of ice in Svalbard probably is due to warmer north Atlantic waters. But at only a few degrees warmer that doesn't explain the massive anomalies (IIRC as high as +10degC) in air temperature we've been seeing. Those anomalies are caused by the difference between how cold it got in the past with more ice cover, and the lack of ice causing air temperatures above zero degC in recent years.

viddaloo

  • Nilas ice
  • Posts: 1302
  • Hardanger Sometimes
    • View Profile
  • Liked: 1
  • Likes Given: 0
Re: Arctic Summer Sea Ice transition
« Reply #31 on: October 18, 2014, 05:26:16 PM »
There's no mystery or vagueness, only the pretense of mystery and vagueness: Already posted in August, with equation and all. And, I believe, already criticized by Chris 2 months ago.
[]

crandles

  • Young ice
  • Posts: 3379
    • View Profile
  • Liked: 239
  • Likes Given: 81
Re: Arctic Summer Sea Ice transition
« Reply #32 on: October 18, 2014, 08:27:35 PM »
y=0x^3 + 5531.722x

looks like it should be a straight line with high y values. (Perhaps particularly high y values if x is supposed to be 4 digit year.)

It therefore doesn't look like the fitted line shown in the graph. Even if you assume a small x^3 component and move the decimal place four places and assume year 2000 is x=0, it still doesn't look anything like the fitted line.

(Edit: found an older one saying y=0.001x^3+11986.691x - can't figure that out either. y=32000000 for x=2000 so divide by 100000000 and it still doesn't work)

If it is a cubic equation, at lease that isn't as bad as an exponential....

... though using percent melt increases the upturn in the graph, and the shape of graph assumes that it doesn't get harder to melt when we start to get to the remnant thicker ice where ice tends to move to as opposed to the easy areas to melt where ice moves out of the areas.

At least 2014 is plotted.

You do know that the PIOMAS team don't think such extrapolations of their data are valid as a forecast method?
« Last Edit: October 18, 2014, 11:17:16 PM by crandles »

ChrisReynolds

  • Nilas ice
  • Posts: 1764
    • View Profile
    • Dosbat
  • Liked: 20
  • Likes Given: 9
Re: Arctic Summer Sea Ice transition
« Reply #33 on: October 18, 2014, 09:40:38 PM »
There's no mystery or vagueness, only the pretense of mystery and vagueness: Already posted in August, with equation and all. And, I believe, already criticized by Chris 2 months ago.

1) Show me where I criticised that 2 months ago, I don't recall it at all.

2) Vagueness? Yes vagueness. Your vagueness meant I thought you were referring to this graph.
http://forum.arctic-sea-ice.net/index.php/topic,119.msg37908.html#msg37908
I do recall criticising that graph.

3) I second Crandles comment, especially the critisism by PIOMAS team.
http://www.realclimate.org/index.php/archives/2012/04/arctic-sea-ice-volume-piomas-prediction-and-the-perils-of-extrapolation/
Note Dr Schweiger and Dr Lindsay are colleagues of Dr Zhang at the PSC. Dr Zhang is the lead scientist behind PIOMAS.

4) Statistical extrapolation is termed 'naive' extrapolation in the literature. Because it has no physical basis it is termed naive not as an insult, but because it is not informed by physics. Naive: "Lacking worldly experience, wisdom, or judgement; unsophisticated."

5) Er

6) That's it.  ;D

crandles

  • Young ice
  • Posts: 3379
    • View Profile
  • Liked: 239
  • Likes Given: 81
Re: Arctic Summer Sea Ice transition
« Reply #34 on: October 18, 2014, 11:09:45 PM »
Looks like it is "the 2014 melting season" thread: occasional posts on pages 66, 67, 69 & 70
http://forum.arctic-sea-ice.net/index.php/topic,778.3250.html

Chris Reynolds said
Quote
The model being used on this thread is wrong. It is based on the decline of volume primarily due to loss of multi-year ice, that won't continue.

but not to Viddaloo, I suspect he has mis-remembered that it was OSweetMrMath that made quite a long post (#3274) about the graph having problems for forecast purposes.

viddaloo

  • Nilas ice
  • Posts: 1302
  • Hardanger Sometimes
    • View Profile
  • Liked: 1
  • Likes Given: 0
Re: Arctic Summer Sea Ice transition
« Reply #35 on: October 18, 2014, 11:24:58 PM »
I believe Dr Zhang has himself made some especially crazy far–out extrapolations of PIOMAS data, forecasting an ice–free Summer in the Arctic way after 2050. I would call that naive, as he takes IPCC scenarios to be a valid representation of our world. Two of the curves in Dr Zhang's crazy graph assume no human–caused global warming at all. Zhang doesn't include two extra curves that are more dramatic than the crazy IPCC scenarios, so his bias is very clear. Maybe Dr Zhang himself shouldn't be allowed to use PIOMAS data for forecasts about our common future?

When run as a projection into the future PIOMAS shows a long tail (from Zhang et al 2010 "Arctic sea ice response to atmospheric forcings with varying levels of anthropogenic warming and climate variability"). The dashed lines are September volume, the full lines are annual average volume, four IPCC SRES scenarios shown.

Edit: 2100 corrected to 2050 for Dr Zhang's graph.
« Last Edit: October 18, 2014, 11:48:54 PM by viddaloo »
[]

Neven

  • Administrator
  • First-year ice
  • Posts: 9502
    • View Profile
    • Arctic Sea Ice Blog
  • Liked: 1336
  • Likes Given: 618
Re: Arctic Summer Sea Ice transition
« Reply #36 on: October 18, 2014, 11:33:06 PM »
I believe Dr Zhang has himself made some especially crazy far–out extrapolations of PIOMAS data, forecasting an ice–free Summer in the Arctic way after 2100. I would call that naive, as he takes IPCC scenarios to be a valid representation of our world. Two of the curves in Dr Zhang's crazy graph assume no human–caused global warming at all. Zhang doesn't include two extra curves that are more dramatic than the crazy IPCC scenarios, so his bias is very clear. Maybe Dr Zhang himself shouldn't be allowed to use PIOMAS data for forecasts about our common future?

What graph are you referring to, vid? I can't remember Zhang ever 'forecasting an ice–free Summer in the Arctic way after 2100'.
The enemy is within
Don't confuse me with him

E. Smith

viddaloo

  • Nilas ice
  • Posts: 1302
  • Hardanger Sometimes
    • View Profile
  • Liked: 1
  • Likes Given: 0
Re: Arctic Summer Sea Ice transition
« Reply #37 on: October 18, 2014, 11:49:54 PM »
EDIT: Assumptions proven with math, here. Conclusion:
The simple trendline will be too conservative, real–life more severe, 60% of the time.


Why curve–fitting is too conservative and more reliable than most IPCC models

Let us begin carefully with the basics. When you make a scatter plot of data points from actual measurements in the past, you are fact-based and not relying on any theory, model or hypothesis. When you add a trendline to that scatter plot, you merely apply mathematics to describe what is in the data — a gain or a loss — and to give a hint of the near future. In essense, this is no more 'wrong' or 'unscientific' than talking about a 'rainy summer' or a 'global warming pause'. We use math to understand what we see, and to understand what to expect.

What we expect — without math — is most often a mess. We mostly expect it to get 'warmer' and for sea ice to 'melt'. Pretty general stuff. Some of us expect sea ice to 'recover' based only on two years. Others expect 'the pause' to 'continue'. So seing what you and I expect without any tools isn't very impressive. We can accept tools. We are not luddites or purists who demand thought to be free of pen & paper and other tools.

The beauty of a fact-based scatter plot with a simple trendline is that it's theory free. The graph simply tells you this is what we've got. This has happened, and this other thing will probably happen if things continue in the same way. The math has no theory for the ice-movement, the heat transport, the cyclones, el-niños, or for the polar bears crushing all the ice to use for their drinks. Math tells it like it is.

Now, an important thing was said in that last paragraph: «if things continue in the same way». Call it a Zero Theory or non-theory theory, if you will, as there is of course an unspoken or inherent 'theory' in your math tool's extension of your curve from the past to the future, one that says life will go on, things will carry on in much the same way as they have done.

Will things continue in the same way? Well, the reason I said a curve-fitting trendline was conservative, in the context of climate change, is that we're aware of the very real risk of *abrupt* and/or runaway climate change. Sudden events, like el–niños, megafires, methane releases etc. Math tools expecting things to carry on as they have been are then suddenly conservative and drama–avoiding diplomats, much like the IPCC scientists and polluticians. In the very likely case of abrupt changes, the curve–fitting before those new data points (reflecting the abrupt changes) will of course have been too careful, erring on the side of least drama, if you will. But your simple math tool, the graph tool and the trendline tool, will pick up, include the new data points, and restate its assumptions. You now have a curve–fitting graph that includes one or more cases of abrupt climate change. Simply by adding new data, with no need for changing the graph setup.

IPCC models, on the other hand, get it wrong for so many reasons. Firstly, they are lagging behind current science immensely, unheard of in this day and age. Secondly, they are negotiated and arm–twisted by polluticians, corporations and heads of state. The real power that doesn't need or want people to worry about a thing. Everything is under control, you just have to keep shopping and keep the economy going. Thirdly, they are always in any case reliant on judgement and interpretations, done by human beings, proverbially and literally error–prone.

IPCC history should be more than telling. They have been wrong. Conservative. Deceptive. Compromized. Calming to both polluticians and populations. The Panel — in a nutshell — has become a 'Nanny Panel'. When you — the child — need to go to sleep, Nanny Panel will tell you exactly what you want to hear: Everything is going to be all right. Don't you worry about a thing!
« Last Edit: October 20, 2014, 08:00:30 PM by viddaloo »
[]

ChrisReynolds

  • Nilas ice
  • Posts: 1764
    • View Profile
    • Dosbat
  • Liked: 20
  • Likes Given: 9
Re: Arctic Summer Sea Ice transition
« Reply #38 on: October 19, 2014, 07:28:53 AM »
Viddaloo,

I'm sorry but in all that you have said nothing. Put some physics behind it and I may have a response.

viddaloo

  • Nilas ice
  • Posts: 1302
  • Hardanger Sometimes
    • View Profile
  • Liked: 1
  • Likes Given: 0
Re: Arctic Summer Sea Ice transition
« Reply #39 on: October 19, 2014, 07:57:32 AM »
I believe Jai already answered your very general dismissal here:

Second.  The Piomas data is ROBUST.  it is an indication of the actual events of the arctic.  To challenge the "basis in physics" of the use of this chart is to ask, "do you have a physical explanation for (the actual events of the arctic).  or to put it another way.  "Do you have the absolute solution to what is causing the rapid sea ice loss that has been observed by all forms of scientific study of the region.

If he had, quite magically, said "yes it is . . .and gave the correct answer" then they could have all just packed up and gone home because he would have superseded all remaining presentations and discussion of the science of arctic sea ice.

it was an impossible question, and a gratuitous one.  It was an impossible one to answer and to challenge it is to challenge the proven piomas data.  (which is what wadhams should have said.)  "I don't need to have a function model for this, this is real, historical data." 
[]

ChrisReynolds

  • Nilas ice
  • Posts: 1764
    • View Profile
    • Dosbat
  • Liked: 20
  • Likes Given: 9
Re: Arctic Summer Sea Ice transition
« Reply #40 on: October 19, 2014, 09:20:24 AM »
And I search this page for that quote, yet find nothing (I searched for a sentence from that quote using the browser - 1 match, your quote). So I wonder where the hell you got that from, and what the context was. You really are very vague and exasperating.

Anyway. Yes, the PIOMAS data is robust. Using the PIOMAS model a study has already been done to identify the cause of the volume loss. The cause of PIOMAS volume loss is known, Lindsay and Zhang have identified it:
http://dosbat.blogspot.co.uk/2014/03/what-caused-volume-loss-in-piomas.html
http://forum.arctic-sea-ice.net/index.php/topic,722.0.html
http://journals.ametsoc.org/doi/abs/10.1175/JCLI3587.1?

However PIOMAS is a model, not real world data. Note that in both of those I ask what caused the volume loss in PIOMAS, this was not an accident. That is because we can say confidently what caused the PIOMAS volume loss (AGW amplified by the ice/ocean albedo feedback), how well that question addresses the real world remains a matter of judgment.

FWIW I think the results of Lindsay and Zhang apply fully to the real world.

Once again. You have not addressed the physics in my argument. You fail to put forward physics in your argument. You fail to consider that the very model that produces the volume data you use to prognisticate a rapid crash of Arctic sea ice does not show a rapid crash of summer volume and shows that winter volume maintains - in diametric opposition to your claims.

viddaloo

  • Nilas ice
  • Posts: 1302
  • Hardanger Sometimes
    • View Profile
  • Liked: 1
  • Likes Given: 0
Re: Arctic Summer Sea Ice transition
« Reply #41 on: October 19, 2014, 09:36:36 AM »
And I search this page for that quote, yet find nothing (I searched for a sentence from that quote using the browser - 1 match, your quote). So I wonder where the hell you got that from, and what the context was. You really are very vague and exasperating.
I included a link so that you could click the link in case you needed the link. You could have clicked that link.

http://en.wikipedia.org/wiki/Hyperlink

Hyperlinking a cited reference is not generally considered 'vague', but maybe you're just having a bad day/week/month?

Moderator: Can we have some control on the swearing and ad hominem attacks in this forum? Thanks.
[]

ChrisReynolds

  • Nilas ice
  • Posts: 1764
    • View Profile
    • Dosbat
  • Liked: 20
  • Likes Given: 9
Re: Arctic Summer Sea Ice transition
« Reply #42 on: October 19, 2014, 09:49:56 AM »
And I search this page for that quote, yet find nothing (I searched for a sentence from that quote using the browser - 1 match, your quote). So I wonder where the hell you got that from, and what the context was. You really are very vague and exasperating.
I included a link so that you could click the link in case you needed the link. You could have clicked that link.

Ah yes - my bad.

I stumbled upon the source and came back here to say I had found it.

"Can we have some control on the swearing and ad hominem attacks in this forum?"
No swearing. No ad homs. No grounds for complaint.

You are still being vague on the physics!


ChrisReynolds

  • Nilas ice
  • Posts: 1764
    • View Profile
    • Dosbat
  • Liked: 20
  • Likes Given: 9
Re: Arctic Summer Sea Ice transition
« Reply #43 on: October 19, 2014, 09:54:02 AM »
Actually, if you're feeling 'put upon' I will leave you to your beliefs. It's no big deal and I have other work to do that this faux debate is interfering with.

viddaloo

  • Nilas ice
  • Posts: 1302
  • Hardanger Sometimes
    • View Profile
  • Liked: 1
  • Likes Given: 0
Re: Arctic Summer Sea Ice transition
« Reply #44 on: October 19, 2014, 10:01:41 AM »
"Can we have some control on the swearing and ad hominem attacks in this forum?"
No swearing. No ad homs. No grounds for complaint.

Chris, you wrote to me: «So I wonder where the hell you got that from, and what the context was.»

I found that quite unpleasant, as it contains swearing, and the very next sentence contains an ad–hominem attack on my person. The ad–hominem this time was a follow–up of a multi–day attack on me by yourself, first and foremost. I wish someone could tell you to stop it, preferably someone you either respect or are afraid of.
[]

Neven

  • Administrator
  • First-year ice
  • Posts: 9502
    • View Profile
    • Arctic Sea Ice Blog
  • Liked: 1336
  • Likes Given: 618
Re: Arctic Summer Sea Ice transition
« Reply #45 on: October 19, 2014, 11:09:56 AM »
Moderator: Can we have some control on the swearing and ad hominem attacks in this forum? Thanks.

Sure, but that sword cuts both ways, vid. In another thread you imply that Dr Zhang is crazy, which I found somewhat unpleasant.

I don't mind you criticizing and attacking mainstream climate science, but you have to understand that it's only logical that people will try to pin you on the scientific accuracy of your claims (because a lot of people here are scientifically minded, which doesn't mean they automatically agree with the IPCC etc).

This is the Internet, people are more aggressive, sometimes they will lose their patience. This is all normal, and I don't think it's productive to complain about that (unless things really get out of hand). Just shrug it off and keep explaining your positions. I'm sorry, that's just how Internet forums work.

Besides, I don't have the time or the inclination to be judge, jury and executioner here. So I'm counting on all of you to help me with that. I'm busy enough keeping the spambots and the occasional fake skeptic at bay. :)
The enemy is within
Don't confuse me with him

E. Smith

viddaloo

  • Nilas ice
  • Posts: 1302
  • Hardanger Sometimes
    • View Profile
  • Liked: 1
  • Likes Given: 0
Re: Arctic Summer Sea Ice transition
« Reply #46 on: October 19, 2014, 01:29:43 PM »
Of course, Neven. We're not children. It's just that after more than a week this hatred started to escalate, and then I felt it better to notify you than just return the 'love' and keep the spiral spiraling down to a mudfight :)
[]

viddaloo

  • Nilas ice
  • Posts: 1302
  • Hardanger Sometimes
    • View Profile
  • Liked: 1
  • Likes Given: 0
Re: Arctic Summer Sea Ice transition
« Reply #47 on: October 19, 2014, 01:45:46 PM »
FWIW I think the results of Lindsay and Zhang apply fully to the real world.

Once again. You have not addressed the physics in my argument. You fail to put forward physics in your argument. You fail to consider that the very model that produces the volume data you use to prognisticate a rapid crash of Arctic sea ice does not show a rapid crash of summer volume and shows that winter volume maintains - in diametric opposition to your claims.

A couple of things annoy me with your approach, Chris:

  • You put words in my mouth and intentionally confuse future (scenarios) with past (historic data).
  • You intentionally confuse PIOMAS data and IPCC scenarios.
  • You rather annoyingly assume there must be physics in a statistical analysis.
  • You keep saying I'm not allowed to use PIOMAS' historic data because you disagree with me.
  • You get so fixated on proving me wrong that you start making loads of mistakes yourself.
  • You believe I will calm down if you act this way long enough.

Other than that, I think you're doing a splendid job on this forum, and I respect your position and your right to further it, even though I may disagree or (perhaps) not be wise enough yet to understand it.
[]

crandles

  • Young ice
  • Posts: 3379
    • View Profile
  • Liked: 239
  • Likes Given: 81
Re: Arctic Summer Sea Ice transition
« Reply #48 on: October 19, 2014, 01:54:43 PM »
Sorry Viddaloo, if you are feeling put upon with ad hom attacks.

Providing a hyperlink certainly isn't being vague.

I am glad you did put an explanation of your beliefs up at post 37 of this thread above.

It seems to boil down to

Will things continue in the same way? Well, the reason I said a curve-fitting trendline was conservative, in the context of climate change, is that we're aware of the very real risk of *abrupt* and/or runaway climate change. Sudden events, like el–niños, megafires, methane releases etc. Math tools expecting things to carry on as they have been are then suddenly conservative and drama–avoiding diplomats, much like the IPCC scientists and polluticians. In the very likely case of abrupt changes, the curve–fitting before those new data points (reflecting the abrupt changes) will of course have been too careful, erring on the side of least drama, if you will.

This does not seem to have much substance to me. Wipneus' exponential extrapolation after 2012 pointed to 2015 as the first year without ice. After 2013 it looked a bit later and after 2014 it now points to 2019. Do you need any more evidence that such curves can be too aggressive as well as too conservative?

You listed 3 examples. Firstly Sudden El Ninos well there are also La Ninas, maybe La Ninas will become less common. Secondly megafires. Is 2014 perhaps an example that has led to hazyness that has reflected more solar insolation away and caused little melt during this melt season? Thirdly methane releases. We haven't seen much impact on measured methane levels yet and the general opinion of experts isn't going to imminently hugely affect measured methane levels. Certainly this is a risk on the more aggressive side.

I wouldn't want to try to convince you that there aren't more risks on the aggressive side, I accept that there are but this is basically an adjustment to the probability density function with a fatter tail on the riskier side.

Unfortunately this just doesn't address riskier side of what?

Extrapolating straight lines outside the sample data range is risky if the reasons might change or change in strength of their effect.

Extrapolating curves therefore is inherently very risky as there are indications that strength of causes are varying. Will they continue to vary in the same way?

In the words of Bacon, Brandon and Schmidt:
https://drive.google.com/file/d/0BzOmEySKhRVOc1prYUNLQXhoa3c/view
Quote
The feature of such a fit is that it predicts a much faster than linear decline of ice volume in the future, and is the basis of Wadhams’ well-publicised claim that sea ice will disappear in summer in 2015 or thereabouts. There has been wide criticism of this methodology since no convincing physical basis for such behaviour has been presented.

If most climate models show signs of a leveling off in the rate of loss as the ice disappears then this is pretty strong evidence that the physics of the situation will change in the direction of it being harder to remove the last remnants of the ice.

The winter ice regrowth feedback effect has been explained.

IMO This situation puts the onus on you to argue convincingly why the slopes continue to get steeper rather than levelling off. 'Because it has in the past' simply isn't enough when we know the situation is changing with MYI coming down to about 2m thick.

You don't seem to have argued for this or against those reasons for levelling off (at least not in any way which I have found convincing).

AFAICS Your argument only argues for a fatter tail on the riskier side of an extrapolation that takes the shape that the climate models show.


viddaloo

  • Nilas ice
  • Posts: 1302
  • Hardanger Sometimes
    • View Profile
  • Liked: 1
  • Likes Given: 0
Re: Arctic Summer Sea Ice transition
« Reply #49 on: October 19, 2014, 02:07:40 PM »
IMO This situation puts the onus on you to argue convincingly why the slopes continue to get steeper rather than levelling off. 'Because it has in the past' simply isn't enough when we know the situation is changing with MYI coming down to about 2m thick.

Of course. And I provide my views backed up by analysis only in the hope to reach a better understanding of the sea ice decline, together with the rest of you.

In a nutshell, my argument is that «because it has in the past» isn't aggressive enough. That means not even curve fitting graphs are aggressive enough. But IPCC history shows they are better and closer to real–life than so–called IPCC climate models. (Frankly, it would be better if they gave us nothing.)
[]