I don't profess to be an expert on deep ocean currents either but it is worth looking at the reference period the anomaly refers to.
It seems for a long time now that the SSTs near Svalbard have been showing up quite frequently as anomalously warm. Quite often, as the ice retreats, those sea areas that are no longer near an ice edge will show up as way above normal. This has been happening near Svalbard as ice has retreated substantially in the Greenland and Barents Seas and Atlantic water moves north.
Compared to the pre 1980s this area has changed considerably regarding ice cover. No longer do we see the Odden Ice tongue forming to the SW of Svalbard. If you consider the SST anomalies are often referred to the 1971-2000 period, it is not hugely surprising to see big rises now w.r.t that time period.
I often use the NOAA/ESRL website to look at the SSTs (I think it is visually easier to see the anomalies because it treats +/- 0.5 C as being "normal" and colours it white and the seasonal/yearly loops are good).
https://www.esrl.noaa.gov/psd/map/clim/sst.shtmlIn this cropped image on daily SST anomaly, there is a similar area to the one in the nullschool image which shows SSTs as much as 3 C above normal south of Svalbard.
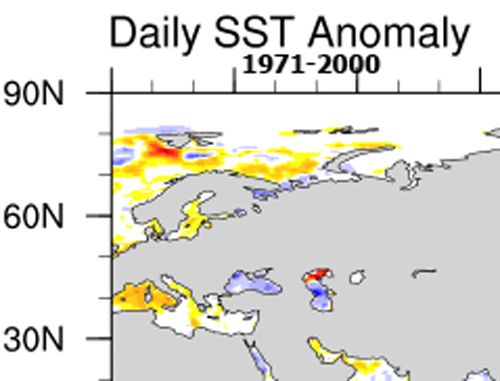
The reference period here is 1971-2000.
However when I looked at the weekly anomalies I notice they are way less in the same area. Barely 1C above normal. Reason : the reference period has changed. (I don't know why NOAA cannot keep the same ref period!). It is now referred to 1981-2010.
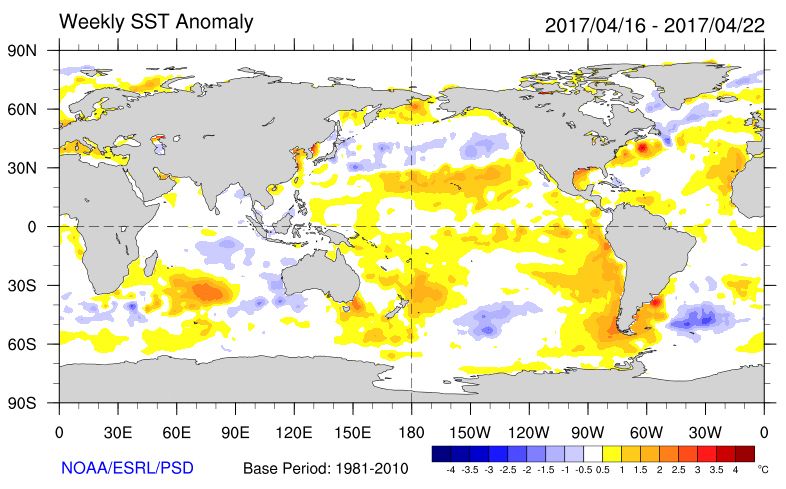
So it seems if you change the ref period and replace the 1970s with the 2000s, the SST anomaly near Svalbard decreases by about 2 C. The 1970s being that much colder than the 2000s.
Note also the big red anomaly in the north of the Caspian Sea in the first chart. I wonder does this again refer to an area that was once ice covered for a time in late winter/spring in the last 3 decades of the 20th century but now no longer affected by ice and hence the large anomaly?


