Evening all,
I've taken this detail from the CAD map:
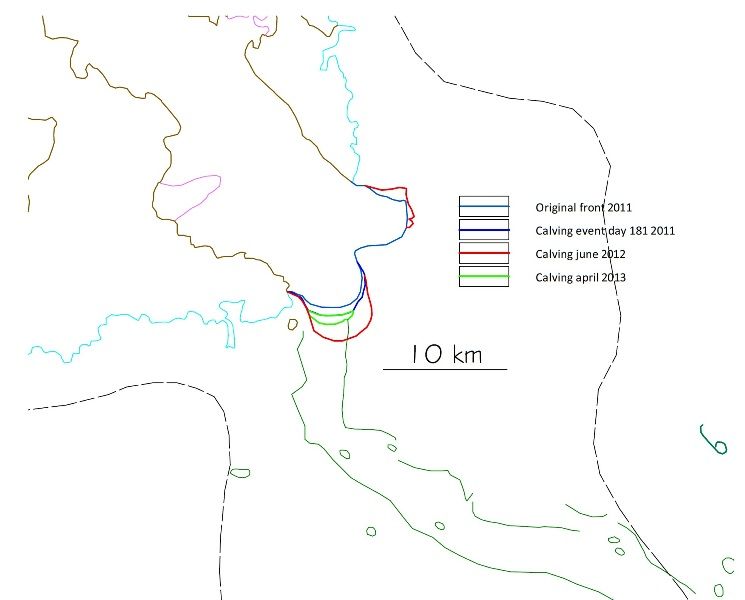
It shows the various stages around the calving front during '11, '12 and '13.
This is a very dynamic system, so the continuous retreats and advances are not special in themselves.
The whole picture through the last two years make these movements interesting in their context.
That's why I introduced lots of features in the feeding area higher up on the original map.
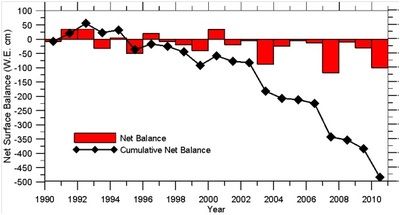
Last year the Steffen Research Group reported 5m sinking of the Swiss Camp surface, about 20 km to the NE of the glacier. This process is, IMHO, continuing and accelerating.
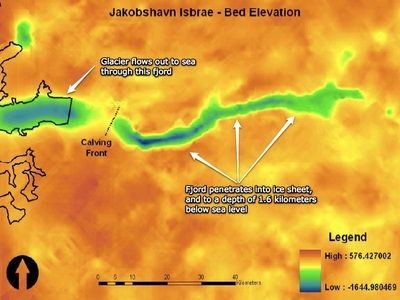
The calving front is now hovering over the western end of the 1600 m deep trough. As support from the fjord sill is now lacking, velocity and frontal collapses over the trough will become increasingly dynamic.
Terry, does this answer your question?
Jim, I'll try to put a large version on photobucket. All pics on my page are free to use.


