Question: I have used the PIOMAS volume and NSIDC area monthly averages to calculate thickness. Has anyone noted the shift in timing of when maximal Arcic ice thickness occurs? Or is this in some way an artifact that results from development of melt ponds early in the season?
I ask because there appears to be a dramatic shift from Sept/August to May/June.
I attribute this to a shift in the ratio of FYI to MYI with the first year ice rapidly melting off earlier.
First figure: Arctic Ice Thickness (m) reported as a stock with open, close, high, low. Black = loss, White = Gain.
Second figure: Month of maximal thickness of Arctic Ice.
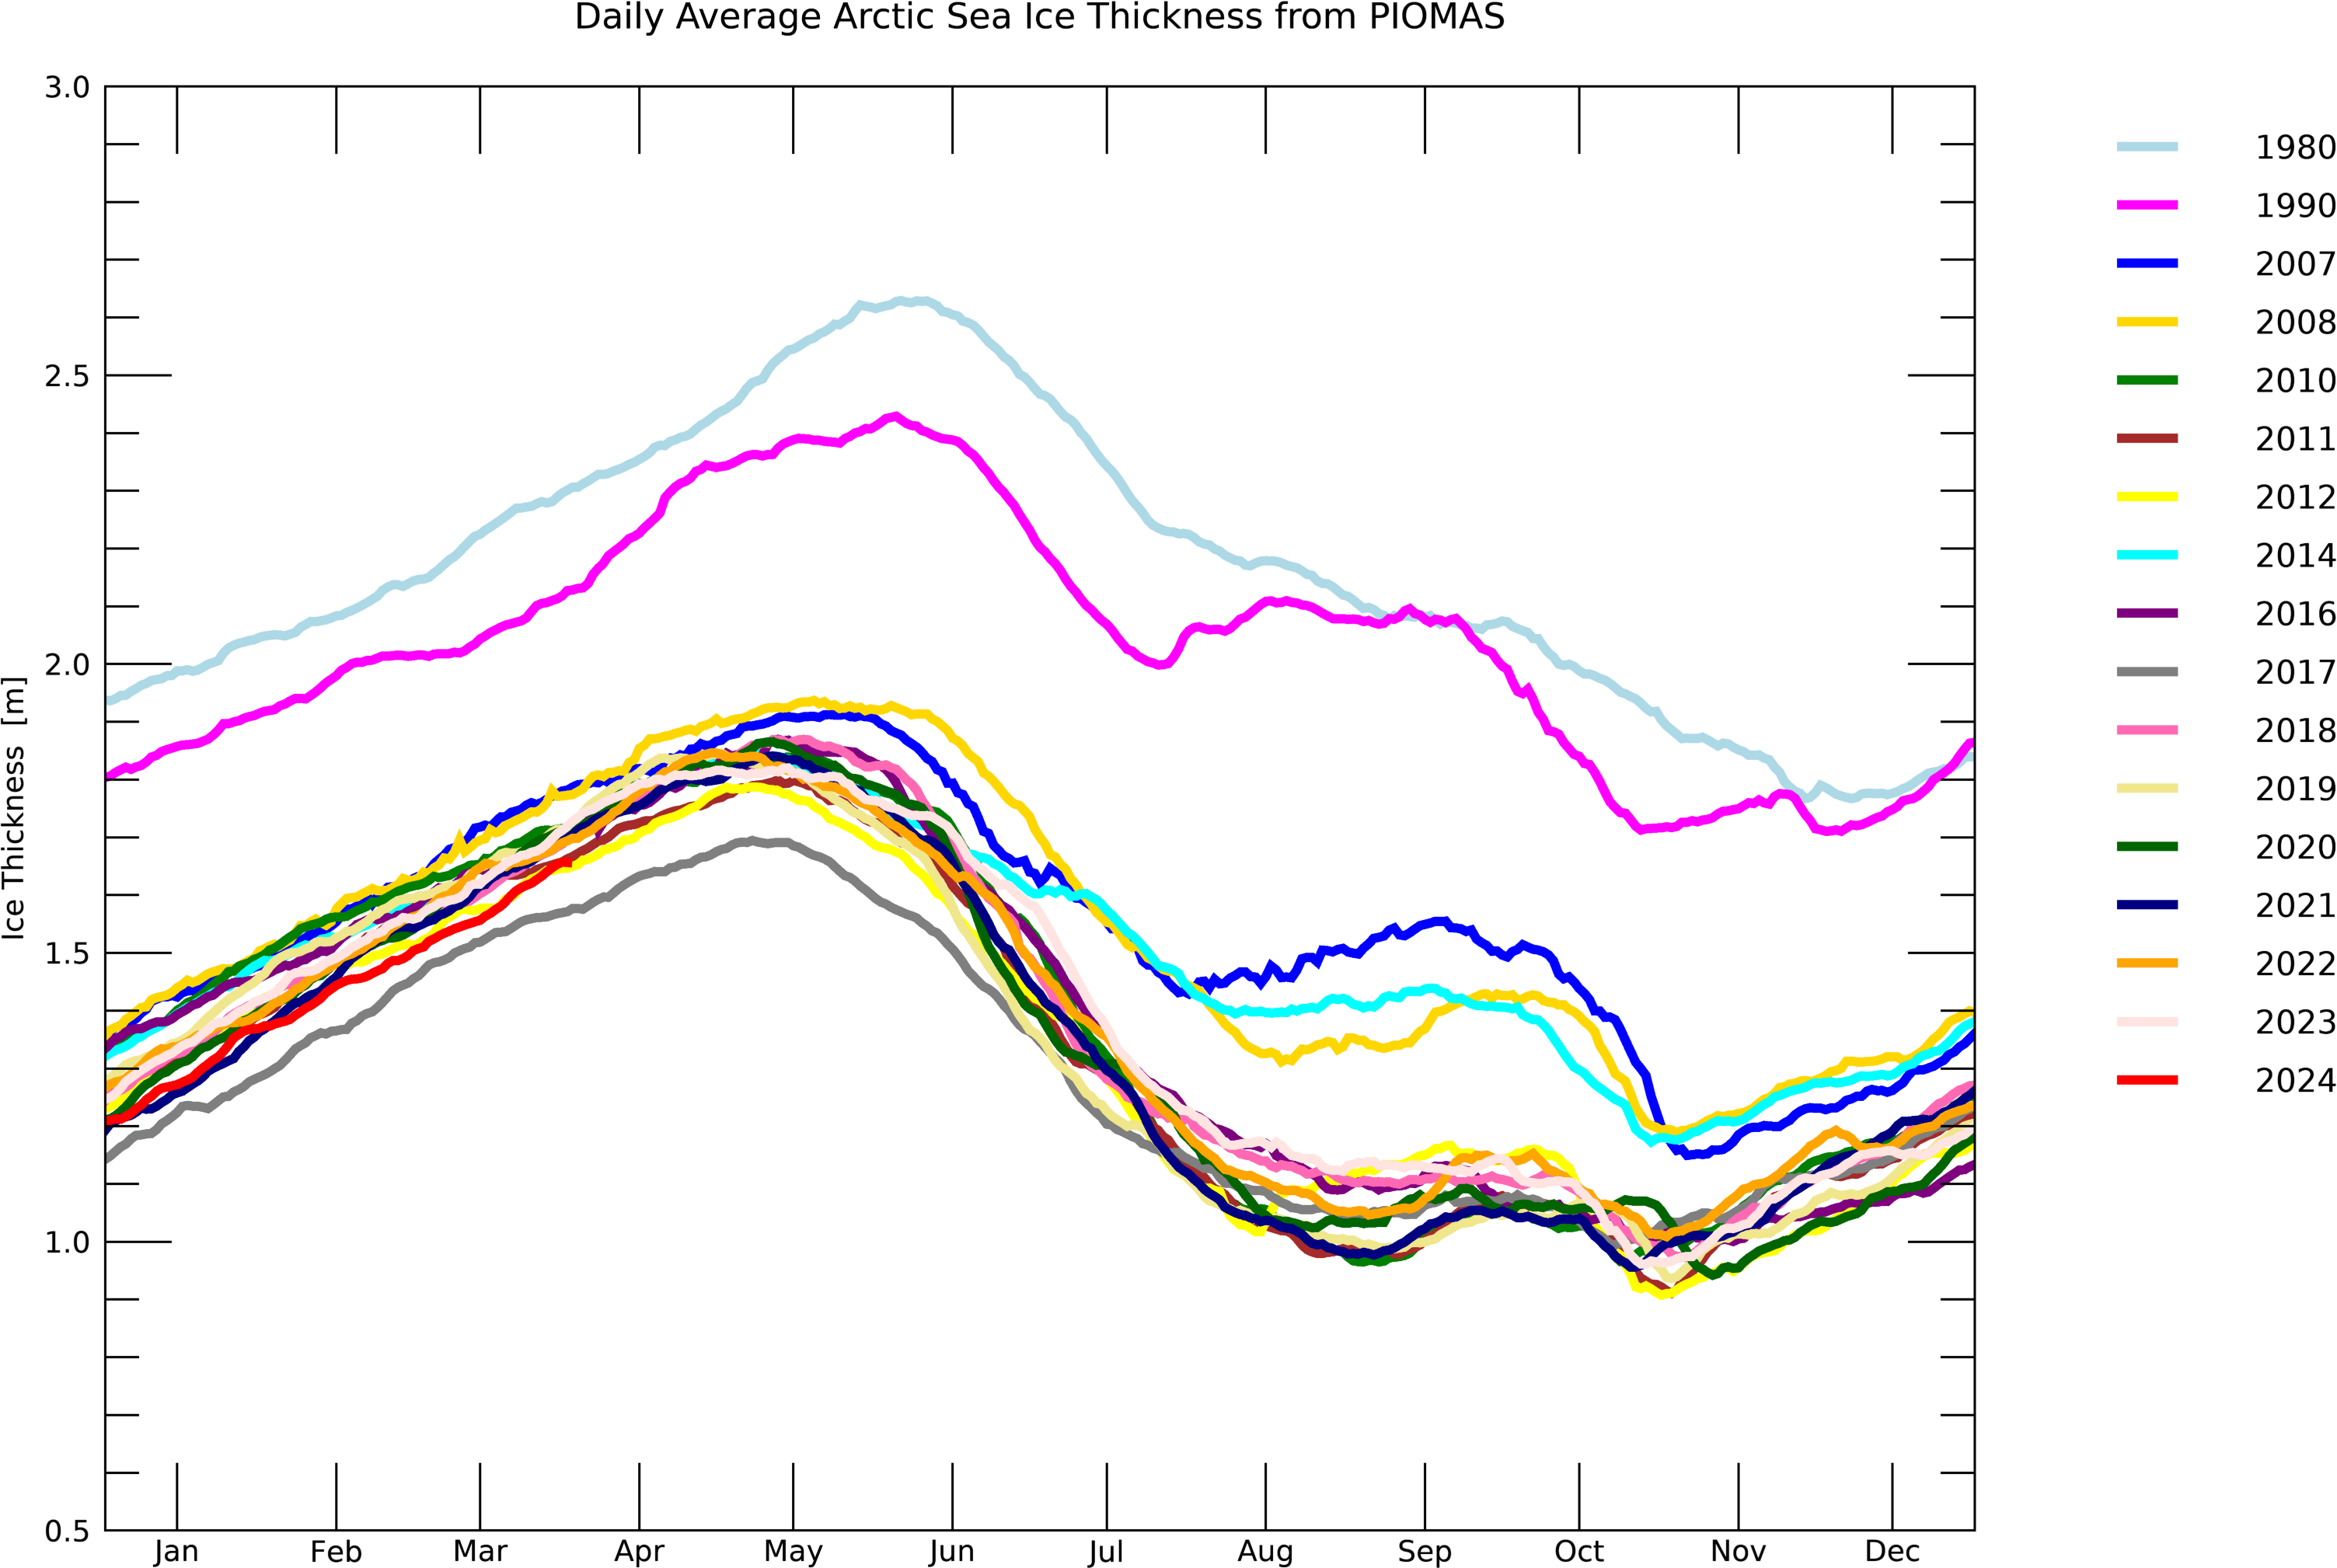
Monthly figures are not good averages of the whole month often equate to value around 21/22nd of month. Better to do it with daily values. Using NSIDC extent I get
Max thickness Year day no. PIOMAS volume
2.318364396 1988 154 28.859
2.289274106 1989 138 29.582
2.288970221 1990 264 13.759
2.261284793 1991 162 27.703
2.25912203 1992 157 28.047
2.261604054 1993 152 28.114
2.254532152 1994 160 27.733
2.160511824 1995 145 26.678
2.118136706 1996 152 26.464
2.257689178 1997 152 27.747
2.197949979 1998 159 26.804
2.151437466 1999 174 23.498
2.09246973 2000 157 25.231
2.105114887 2001 167 23.912
2.110257681 2002 154 25.551
2.044730392 2003 131 26.696
2.045465942 2004 152 24.474
2.006957997 2005 154 23.652
1.95871678 2006 155 22.774
1.826859136 2007 146 22.527
1.894886364 2008 140 24.012
1.842512479 2009 153 22.147
1.743161214 2010 138 22.112
1.686625805 2011 134 21.464
1.695425125 2012 121 23.051
1.694907372 2013 138 21.866
1.753696131 2014 133 22.300
1.859662816 2015 128 23.826
1.795368353 2016 128 22.250
One year 1990 seems to have day of max pushed into Sept day 264. There is a local peak at day 155. Apart from this strange 1990 year that latest day is 174 23rd June.
Yes there is a noticeable trend towards earlier dates but it looks to me to be more like day 160 back to day 130. Approx 30 days over 28 year period. That seems more in accordance with:
I started in 1988 due to every other day gaps prior to this in NSIDC extent.
Using area will probably make the September peak more prominent and hence your different results but it looks to be confusing 2 different peaks in the pattern like 1990 is messed up using extent.


