Support the Arctic Sea Ice Forum and Blog

Author Topic: Volume Predictions.  (Read 93812 times)

ChrisReynolds

  • Nilas ice
  • Posts: 1764
    • View Profile
    • Dosbat
  • Liked: 20
  • Likes Given: 9
Re: Volume Predictions.
« Reply #150 on: May 31, 2013, 08:09:48 PM »
I had been going to cover this in my May Status post, but I've decided to blog what I have over this weekend as a preamble due to the impacts of the current storm. Crandle's method gets more accurate since 2001.

crandles

  • Young ice
  • Posts: 3379
    • View Profile
  • Liked: 239
  • Likes Given: 81
Re: Volume Predictions.
« Reply #151 on: May 31, 2013, 10:53:01 PM »
Oops, I ran out of time to get my May poll votes in. Anyway, I will carry on regardless:

Averaging my 17.85 and Wipneus 17.75 gives 17.8 K Km^3 for day 151 volume.

Deducting a straight line extrapolation of day 151 to minimum volume reduction of 14.98 K Km^3 gives a minimum volume estimate of 2.82 K Km^3.

(Red line in first graph below reaches 14.98 for 2013.)

That is a simple estimate. But I think we can do better:


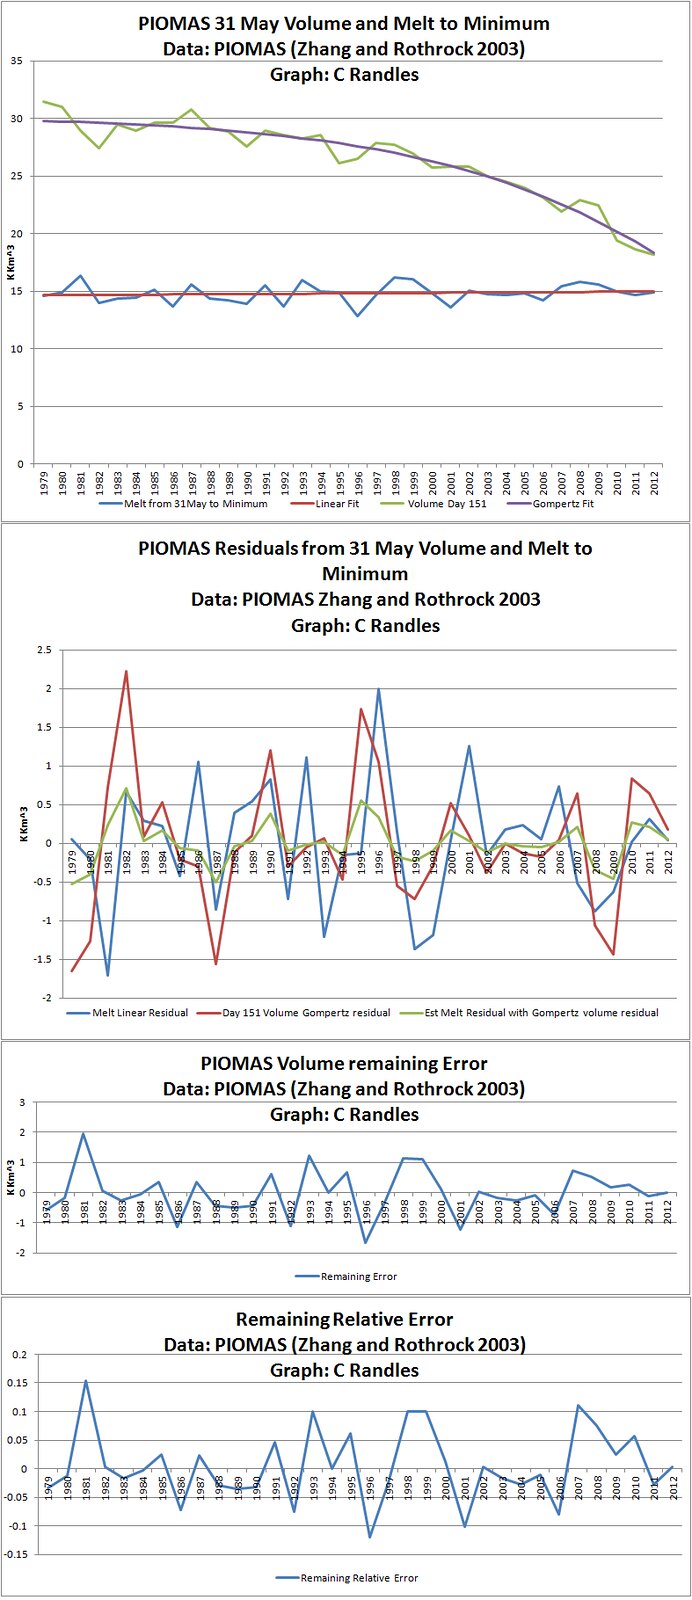
In the second graph I have plotted the residuals from trends shown in the first graph. In blue is the residual from trend of the melt from 31 May to minimum. If we could predict this, then we can get a better estimate of the melt from 31 May to minimum.

The other residual from trend in the first graph of volume at 31 May is plotted in red on the second graph. This shows some similarity of shape. So we can calculate a best linear scaling of the red line to make an estimate of the blue residual line we are trying to estimate. This is shown in green on the second graph.

When I do this I get a melt of 15.18 from the May 31 volume.
So using 17.8 as the estimate of May 31 volume gives a minimum volume estimate of 2.62 K Km^3

The standard deviation of the errors for the last 20 years using this method to forecast with only data to 31May of the year being estimated gives 0.85 K Km^3.

The third graph shows the errors rapidly declining. If I assume relative errors stay the same then the standard deviation of last 20 years relative errors is 0.08. 0.08*2.62 gives an error estimate of 0.21 K Km^3. The errors look more normally distributed like that - see 4th graph.

So a +/-2 sd range might be as low as 0.42 K Km^3, giving an estimate of 2.62 +/- 0.42 K Km^3.


ChrisReynolds

  • Nilas ice
  • Posts: 1764
    • View Profile
    • Dosbat
  • Liked: 20
  • Likes Given: 9
Re: Volume Predictions.
« Reply #152 on: May 31, 2013, 11:29:32 PM »
Setting a power function to origin of zero, and fitting to scatter plot of CT Area as a function of PIOMAS minimum volume, gives a function:

CTArea = 1.287*PIOMASVol^0.5066.

Essentially a logarthimic curve.

Using that function on your predicted volume, with +/-2sd gives:

PIOMAS   CT Area
3.46   2.4137
2.62   2.0965
1.78   1.7236

Volume for last year was 3.261k km^3 at min, CT Area was 2.234M km^2.

Wipneus

  • Citizen scientist
  • Young ice
  • Posts: 4220
    • View Profile
    • Arctische Pinguin
  • Liked: 1025
  • Likes Given: 0
Re: Volume Predictions.
« Reply #153 on: June 05, 2013, 08:14:44 AM »

My guess would be 17.5 --very low, 17.75 -- best guess and 18.0 -- very high.


Reality : 19.087. Way beyond my expectations.

Based on that my best estimate (based on a regression of May 31 volume and a quadratic fit of melt 31May_to_minimum) becomes about 3.6 [1000 km3]

ananthapriya

  • New ice
  • Posts: 10
    • View Profile
  • Liked: 0
  • Likes Given: 0
Re: Volume Predictions.
« Reply #154 on: July 30, 2013, 07:10:06 AM »
When will be out the big resolution? And what chapter are involved in this volume?

dan