Thank you Victoria, for checking in with the ASIF !
I find your WARM buoys extremely interesting and useful.
Since they have temperature and salinity sensors down the tether, they mimic the information normally obtained by ITP buoys.
And since the have in-ice and under-ice irradiance sensors, they provide and indirect measurement of bottom-melt, thus providing the information normally obtained by IMBs (like 2017A).
Thus, your WARM buoys are like two buoys at once, as long as we can obtain full-spectrum under-ice measurements (not just PAR). And it is in that regard that I have some questions :
You mentioned in an email to Jim :
However, I do have some sensors on the string that are measuring irradiance at three wavelengths, 412, 443 and 555 as well as PAR, depths, 5, 10 and 20 m. This does enable me to get an idea of the spread of the light through the spectrum, and I have used a modeled surface spectrum, propagated through sea ice (using Bonnie Light’s coefficients) and then normalized to my data to estimate spectral irradiance under the ice.
Couple of questions on that, with the purpose of finding out how we can determine full-spectrum irradiance from the sensors on your buoys :
1) Do your WARM buoys have 4 different sensors (412, 443, 555 nm and a separate PAR sensor) ? Or just 3 sensors (412, 443, 555 nm) and you calculate PAR from that ?
2) If PAR irradiance data is obtained from a separate sensor, then what is the wavelength sensitivity distribution of that sensor ?
3) To get from sensors to PAR in W/m^2, which algorithm did you use ? And would it be hard to adjust the algorithm so that it produces an estimate of full-spectrum irradiance ?
4) I've been looking for the irradiance raw data in your "level 1 data" in the WARM 6 data page
http://psc.apl.washington.edu/UpTempO/BuoyInfo.php?cbuoy=9080&bname1=UpTempO%202017However, that "level 1 data" does not include data from the irradiance sensors. Could you add that ?
Besides these questions about the irradiance sensors, I am a bit puzzled by the irradiance data from some of the WARM buoys. For example, the WARM 3 data (from 2015) :
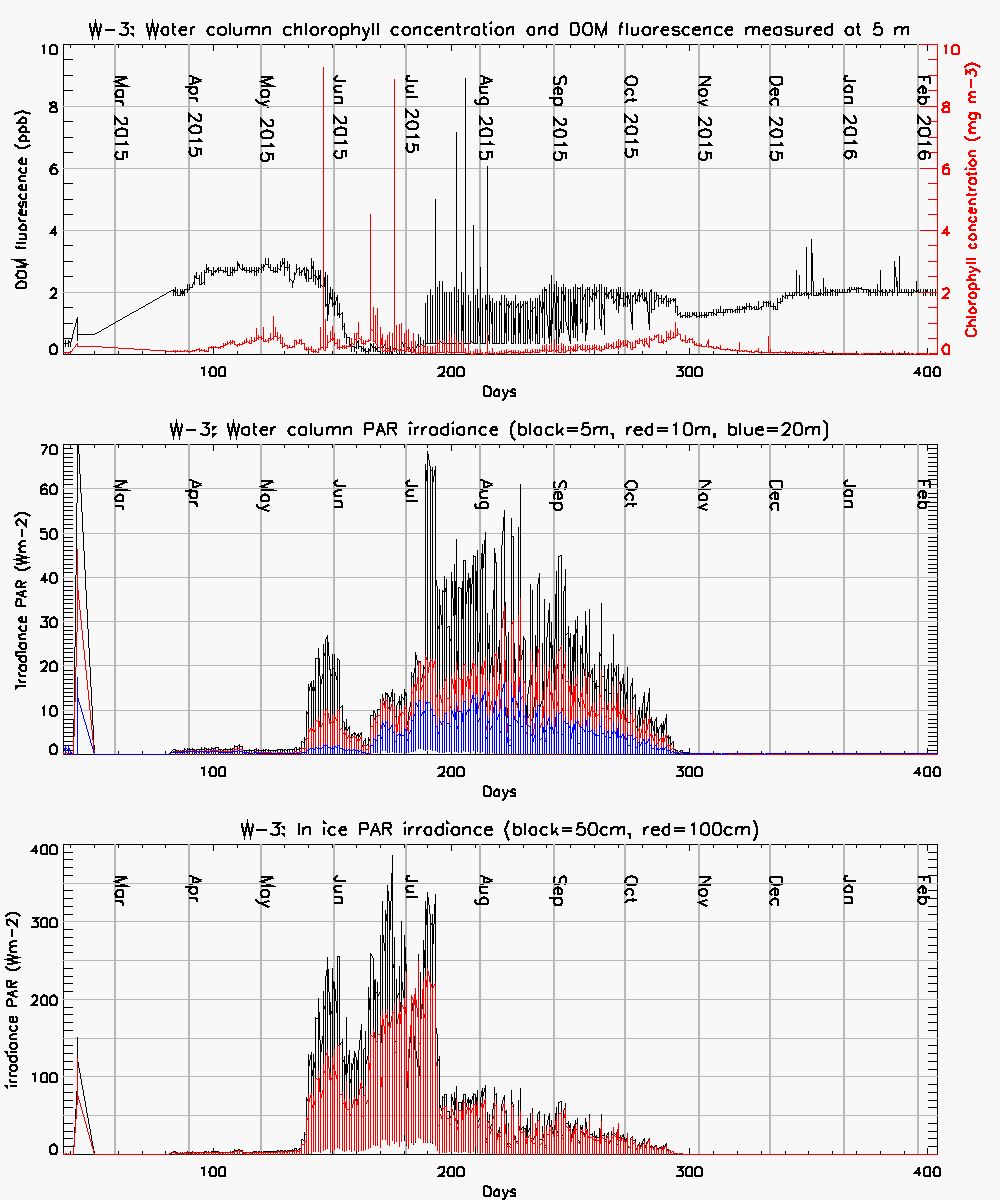
Here we see that during June, and part of July, in-ice PAR is very large (some 200 W/m^2 on average) but under-ice PAR is very small (mostly less than 10 W/m^2).
Starting from the second half of July things return to normal with in-ice PAR at some 50 W/m^2 and under-ice PAR is some 40 W/m^2.
What happened there in June ? Is there a logical explanation for the huge difference between in-ice and under-ice PAR ?


