Support the Arctic Sea Ice Forum and Blog

Author Topic: Home brew AMSR2 extent & area calculation  (Read 1982281 times)

Wipneus

  • Citizen scientist
  • Young ice
  • Posts: 4220
    • View Profile
    • Arctische Pinguin
  • Liked: 1025
  • Likes Given: 0
Re: Home brew AMSR2 extent & area calculation
« Reply #350 on: August 18, 2013, 08:20:21 AM »
Waiting for the sea ice concentration data from Uni Hamburg....

Nothing has changed so far, still waiting..

LarsBoelen

  • New ice
  • Posts: 25
    • View Profile
  • Liked: 0
  • Likes Given: 0
Re: Home brew AMSR2 extent & area calculation
« Reply #351 on: August 18, 2013, 06:13:15 PM »
...and so the question is, what are TPTB witholding? What do they know that they do not want us to see? Is the Bilderberg group meeting in secret to come up with an explanation.

Did Santa drown? If they don't show us the pictures, we will row there ourselves to check!

Jim Hunt

  • First-year ice
  • Posts: 6270
  • Don't Vote NatC or PopCon, Save Lives!
    • View Profile
    • The Arctic sea ice Great White Con
  • Liked: 894
  • Likes Given: 87
Re: Home brew AMSR2 extent & area calculation
« Reply #352 on: August 18, 2013, 06:38:31 PM »
What are TPTB witholding? Did Santa drown? If they don't show us the pictures, we will row there ourselves to check!

No need to row Lars. Nothing for the 16th still, but most of the 17th now seems to be available. Lots more blue than on the 15th it seems:

"The most revolutionary thing one can do always is to proclaim loudly what is happening" - Rosa Luxemburg

Wipneus

  • Citizen scientist
  • Young ice
  • Posts: 4220
    • View Profile
    • Arctische Pinguin
  • Liked: 1025
  • Likes Given: 0
Re: Home brew AMSR2 extent & area calculation
« Reply #353 on: August 18, 2013, 07:20:17 PM »
Update for 20130817.

As Jim showed, the data for 20130816 is missing completely and only some is there for 20130817. My program fills in the missing parts for 20130817, but the data should be looked upon with some caution.

The following changes are for TWO days:

Extent: -138k0 (+1090k vs 2012)
Area: -42k7 (+934k vs 2012)

You will find the updated graphs in the top post

The details (in 1000 km2):


Extent:
           Arctic Basin       East Siberian Sea              Laptev Sea
                  -67.3                   -19.8                     2.7
               Kara Sea             Barents Sea           Greenland Sea
                   -3.8                     0.0                     0.8
Baffin/Newfoundland Bay            St. Lawrence              Hudson Bay
                   -2.0                     0.0                    -7.3
   Canadian Archipelago            Beaufort Sea             Chukchi Sea
                  -49.2                     6.4                     1.5
             Bering Sea          Sea of Okhotsk            Total Extent
                    0.0                     0.0                  -138.0

Area:
           Arctic Basin       East Siberian Sea              Laptev Sea
                  -28.0                   -11.2                     6.9
               Kara Sea             Barents Sea           Greenland Sea
                    1.0                     0.0                    12.2
Baffin/Newfoundland Bay            St. Lawrence              Hudson Bay
                   -1.3                     0.0                    -3.7
   Canadian Archipelago            Beaufort Sea             Chukchi Sea
                  -20.7                     1.8                     0.4
             Bering Sea          Sea of Okhotsk              Total Area
                    0.0                     0.0                   -42.7

Wipneus

  • Citizen scientist
  • Young ice
  • Posts: 4220
    • View Profile
    • Arctische Pinguin
  • Liked: 1025
  • Likes Given: 0
Re: Home brew AMSR2 extent & area calculation
« Reply #354 on: August 18, 2013, 07:28:58 PM »
The Atlantic section of the CAB seems to be finally doing what was anticipated for weeks now and a huge polynya has formed.
NE passage is still not open.

(log in to see attached image)

Wipneus

  • Citizen scientist
  • Young ice
  • Posts: 4220
    • View Profile
    • Arctische Pinguin
  • Liked: 1025
  • Likes Given: 0
Re: Home brew AMSR2 extent & area calculation
« Reply #355 on: August 18, 2013, 07:30:36 PM »
And the color coded concentration map.

(log in to see)

Wipneus

  • Citizen scientist
  • Young ice
  • Posts: 4220
    • View Profile
    • Arctische Pinguin
  • Liked: 1025
  • Likes Given: 0
Re: Home brew AMSR2 extent & area calculation
« Reply #356 on: August 19, 2013, 08:21:19 AM »
Update 20130818.

Extent: +36k3 (+1245k vs 2012)
Area: +151k0 (+1186k vs 2012)

Big upticks, especially area. And it is mostly the CAB, Greenland sea has an uptick, hardly an indication that Fram transport is restarting.

 
You will find the updated graphs in the top post

The details (in 1000 km2):


Extent:
           Arctic Basin       East Siberian Sea              Laptev Sea
                   10.6                    -1.9                     2.1
               Kara Sea             Barents Sea           Greenland Sea
                   -0.7                     0.3                    15.4
Baffin/Newfoundland Bay            St. Lawrence              Hudson Bay
                   -1.7                     0.0                     0.0
   Canadian Archipelago            Beaufort Sea             Chukchi Sea
                    6.2                     2.1                     4.0
             Bering Sea          Sea of Okhotsk            Total Extent
                    0.0                     0.0                    36.3

Area:
           Arctic Basin       East Siberian Sea              Laptev Sea
                  120.1                   -17.3                     5.5
               Kara Sea             Barents Sea           Greenland Sea
                   -3.1                     0.2                    11.0
Baffin/Newfoundland Bay            St. Lawrence              Hudson Bay
                   -1.1                     0.0                    -0.2
   Canadian Archipelago            Beaufort Sea             Chukchi Sea
                   16.4                    17.8                     1.6
             Bering Sea          Sea of Okhotsk              Total Area
                    0.0                     0.0                   151.0


Frivolousz21

  • Nilas ice
  • Posts: 1915
  • Live in Belleville, IL..15 miles SE of St. Louis.
    • View Profile
  • Liked: 598
  • Likes Given: 7
Re: Home brew AMSR2 extent & area calculation
« Reply #357 on: August 19, 2013, 08:26:15 AM »
What level of the atmosphere is the most cloud contamination.

It clears out a bit and we see how bad it is.  It clouds up or fog or something and the concentration goes up a ton.


I got a nickname for all my guns
a Desert Eagle that I call Big Pun
a two shot that I call Tupac
and a dirty pistol that love to crew hop
my TEC 9 Imma call T-Pain
my 3-8 snub Imma call Lil Wayne
machine gun named Missy so loud
it go e-e-e-e-ow e-e-e-e-e-e-blaow

Wipneus

  • Citizen scientist
  • Young ice
  • Posts: 4220
    • View Profile
    • Arctische Pinguin
  • Liked: 1025
  • Likes Given: 0
Re: Home brew AMSR2 extent & area calculation
« Reply #358 on: August 19, 2013, 08:32:28 AM »
For thge region of the day, we go to the ESS and Laptev section. Activity is on the edges, a mixture of reds and blues giving only little nett change.

(log in to see attached image)

Wipneus

  • Citizen scientist
  • Young ice
  • Posts: 4220
    • View Profile
    • Arctische Pinguin
  • Liked: 1025
  • Likes Given: 0
Re: Home brew AMSR2 extent & area calculation
« Reply #359 on: August 19, 2013, 08:35:32 AM »
And the color coded concentration map.

(also attached etc)

Frivolousz21

  • Nilas ice
  • Posts: 1915
  • Live in Belleville, IL..15 miles SE of St. Louis.
    • View Profile
  • Liked: 598
  • Likes Given: 7
Re: Home brew AMSR2 extent & area calculation
« Reply #360 on: August 19, 2013, 08:39:12 AM »
According to the 6.25km Bremen AMSR2 we have seen no drop in extent and have gained extent.  Over the last 7-10 days.


Maybe it's the phantom ice in the SOO?  There is no way ice extent has gone up over the last week or even stayed even.  There is no where around the ice pack that would indicate that at all.


I got a nickname for all my guns
a Desert Eagle that I call Big Pun
a two shot that I call Tupac
and a dirty pistol that love to crew hop
my TEC 9 Imma call T-Pain
my 3-8 snub Imma call Lil Wayne
machine gun named Missy so loud
it go e-e-e-e-ow e-e-e-e-e-e-blaow

Wipneus

  • Citizen scientist
  • Young ice
  • Posts: 4220
    • View Profile
    • Arctische Pinguin
  • Liked: 1025
  • Likes Given: 0
Re: Home brew AMSR2 extent & area calculation
« Reply #361 on: August 19, 2013, 08:55:45 AM »
Quote
Maybe it's the phantom ice in the SOO?

There is an opposite phantom in the Atlantic, near st.Lawrence. Clearly their weather filters failed here.
Does it matter for extent/area? Maybe, maybe not. Depends on how they compute their extent and area.
In my AMSR2 calc these effects are filtered out.

Wipneus

  • Citizen scientist
  • Young ice
  • Posts: 4220
    • View Profile
    • Arctische Pinguin
  • Liked: 1025
  • Likes Given: 0
Re: Home brew AMSR2 extent & area calculation
« Reply #362 on: August 19, 2013, 09:01:21 AM »
As an extra, the section between the NP and Greenland/Ellesmere.
A-Team on the ASIB is asking question about the two small areas with low concentration.
And is there such a big crack at the north coast of Greenland???

Wipneus

  • Citizen scientist
  • Young ice
  • Posts: 4220
    • View Profile
    • Arctische Pinguin
  • Liked: 1025
  • Likes Given: 0
Re: Home brew AMSR2 extent & area calculation
« Reply #363 on: August 19, 2013, 09:04:26 AM »
BTW, I am off for a small vacation with probably no internet. There will be no updates in the coming two days. Next update on Thursday if all goes well.

Wipneus

  • Citizen scientist
  • Young ice
  • Posts: 4220
    • View Profile
    • Arctische Pinguin
  • Liked: 1025
  • Likes Given: 0
Re: Home brew AMSR2 extent & area calculation
« Reply #364 on: August 19, 2013, 12:58:40 PM »
I forgot to mention that all my source data for the 16th and 17th have been recovered and processed. Thank you guys for doing this in the weekend!

TerryM

  • First-year ice
  • Posts: 6002
    • View Profile
  • Liked: 893
  • Likes Given: 5
Re: Home brew AMSR2 extent & area calculation
« Reply #365 on: August 19, 2013, 08:04:48 PM »
Wipneus
Have a great couple of days away from the screen. I don't comment much on this thread but follow your graphs and calculations religiously.
If anyone deserves a little time off for good behavior it is you.
Terry

Artful Dodger

  • Frazil ice
  • Posts: 459
  • The traps have got him, and that's all about it!
    • View Profile
  • Liked: 24
  • Likes Given: 127
Re: Home brew AMSR2 extent & area calculation
« Reply #366 on: August 20, 2013, 12:10:46 AM »
If anyone deserves a little time off for good behavior it is you.
Ssh. Is he gone?  ::)
Cheers!
Lodger

Wipneus

  • Citizen scientist
  • Young ice
  • Posts: 4220
    • View Profile
    • Arctische Pinguin
  • Liked: 1025
  • Likes Given: 0
Re: Home brew AMSR2 extent & area calculation
« Reply #367 on: August 22, 2013, 08:30:25 AM »
Update 20130821  :)

Because there was no report all numbers in this post are over the last three day. Divide by three to get the mean differences.

Extent: -169k7 (+1274k vs 2012)
Area: -114k9 (+1210k vs 2012)

Activity is mostly in the CAB. Not enough to clear the backlog with 2012, but a 400k until minimum should be possible. The ESS has some melt, but it has plenty of ice left where in 2012 it was now ice-free. Likewise, laptev and Beaufort seem to have stopped declining. Kara has enough melt to expect opening of the NE passage.
 
You will find the updated graphs in the top post

The details (in 1000 km2):


Extent:
           Arctic Basin       East Siberian Sea              Laptev Sea
                  -76.3                   -26.3                    -9.7
               Kara Sea             Barents Sea           Greenland Sea
                  -15.5                    -0.4                   -18.3
Baffin/Newfoundland Bay            St. Lawrence              Hudson Bay
                    6.7                     0.0                    -0.3
   Canadian Archipelago            Beaufort Sea             Chukchi Sea
                  -20.1                     3.6                   -13.1
             Bering Sea          Sea of Okhotsk            Total Extent
                    0.0                     0.0                  -169.7

Area:
           Arctic Basin       East Siberian Sea              Laptev Sea
                  -12.5                   -34.5                   -16.2
               Kara Sea             Barents Sea           Greenland Sea
                  -16.7                    -0.3                   -22.8
Baffin/Newfoundland Bay            St. Lawrence              Hudson Bay
                    3.8                     0.0                    -0.2
   Canadian Archipelago            Beaufort Sea             Chukchi Sea
                  -21.8                    15.7                    -9.5
             Bering Sea          Sea of Okhotsk              Total Area
                    0.0                     0.0                  -114.9

Wipneus

  • Citizen scientist
  • Young ice
  • Posts: 4220
    • View Profile
    • Arctische Pinguin
  • Liked: 1025
  • Likes Given: 0
Re: Home brew AMSR2 extent & area calculation
« Reply #368 on: August 22, 2013, 08:51:02 AM »
Also the extent-delta maps are over three days, just today. Here is the Atlantic section with the large polynya still staying and even growing. There is melt, compaction from the edge of the ice pack. The NE passage could open in days, either around the islands or near the continental coast.

Wipneus

  • Citizen scientist
  • Young ice
  • Posts: 4220
    • View Profile
    • Arctische Pinguin
  • Liked: 1025
  • Likes Given: 0
Re: Home brew AMSR2 extent & area calculation
« Reply #369 on: August 22, 2013, 08:59:00 AM »
And the color coded concentration map (of 20130821). The pole hole is purple and quite invisible: no low concentration ice near the pole.

(attached image, log in to see)

Frivolousz21

  • Nilas ice
  • Posts: 1915
  • Live in Belleville, IL..15 miles SE of St. Louis.
    • View Profile
  • Liked: 598
  • Likes Given: 7
Re: Home brew AMSR2 extent & area calculation
« Reply #370 on: August 22, 2013, 09:39:28 AM »
The clouds have prevented the true extent of the damage. 

Lots of ice bout to become open water

I got a nickname for all my guns
a Desert Eagle that I call Big Pun
a two shot that I call Tupac
and a dirty pistol that love to crew hop
my TEC 9 Imma call T-Pain
my 3-8 snub Imma call Lil Wayne
machine gun named Missy so loud
it go e-e-e-e-ow e-e-e-e-e-e-blaow

danp

  • New ice
  • Posts: 66
    • View Profile
  • Liked: 0
  • Likes Given: 0
Re: Home brew AMSR2 extent & area calculation
« Reply #371 on: August 22, 2013, 05:16:59 PM »
I mentioned over at http://neven1.typepad.com/blog/2013/08/asi-2013-update-7-cold-and-cloudy.html?cid=6a0133f03a1e37970b0192acb0cff5970d#comment-6a0133f03a1e37970b0192acb0cff5970d
that I'm at a beta version on a new method for compositing any time length of MODIS images to select cloud-free scenes.  Here's a crop from the most recent 8 days, which have been cloudy enough to still challenge my algorithm:

(click to see full size, about 1700 pix across)

werther

  • Grease ice
  • Posts: 747
    • View Profile
  • Liked: 31
  • Likes Given: 0
Re: Home brew AMSR2 extent & area calculation
« Reply #372 on: August 23, 2013, 12:38:27 AM »
Dan P., hi,

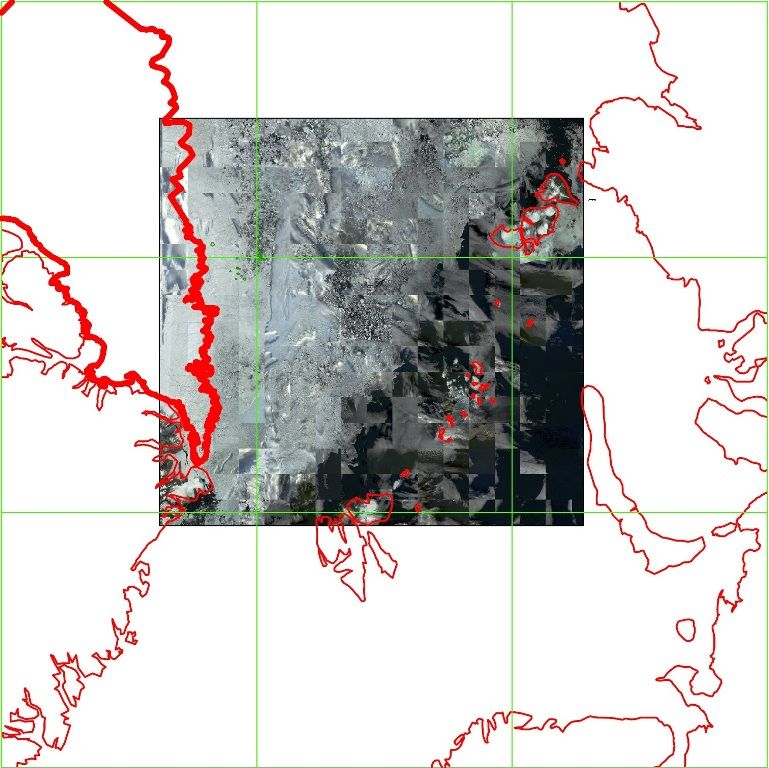
I took the liberty to fit your collage in my CAD grid:


I’m not sure yet what to do. Any digitized analysis consumes a lot of time. And I haven’t even finished my “grand” Greenland ice/snowline comparison 2009-2012 yet…

It seems best to wait until refreeze has started and begin analyzing what this season figures in October. It is tempting to start from your hard “cloud-clearing” work. At first glance, there are some limitations… like the ice boundary. As you chose cloudfree app. 100x100 km blocks from differing dates, the positions get “ jittered” (if I use that A-Team term in the right way?). Also, the resolution is less than the app. 4 Mb/16,8 Mpix MODIS tiles I copy.

Nevertheless, on this frame you’ll see my fat red line for the “uncompromized” 28 August mesh-pack on the left. The Pole is in a low concentration zone, tentatively positioned in a rather ‘wet’ inter-floe rubble pixel. Santa has his herd of reindeer scattered over a lot of small particles!

The high concentration zone lies about 40 km into the direction of Ellesmere Island. The “mesh-pack” boundary is way further, at 225 km from the Pole.
Last year, even at minimum, it stretched some 100 km from the Pole in the direction of Siberia…

The high concentration zone , about 180 km broad, is where the mesh-pack constantly disintegrates and feeds the debris in the immense, almost 2 mkm2 measuring splinter zone.
All that is left of the once majestic MYI summer ice pack is now a mere 500 km broad swath up to Ellesmere.

danp

  • New ice
  • Posts: 66
    • View Profile
  • Liked: 0
  • Likes Given: 0
Re: Home brew AMSR2 extent & area calculation
« Reply #373 on: August 23, 2013, 01:04:42 AM »
Hi Werther,

I was hoping a long-time ice-watcher like you would find this presentation useful.  I have considered processing all the way to the top MODIS resolutions (250m, compared with my 500m), so I will take that as a positive vote.  It would take a good deal longer and processing time is a bit long right now, but I haven't optimized much for that yet.  As far as my main constraint (download bandwidth) I already am downloading the appropriate data to do so; it is only channels 1 & 2 that have the top resolution, and the top resolution data (for all 37 channels!) is there in the swath downloads, so I could do what NASA does and resample the lower-resolution channels to match. 

I agree the blocked nature of the presentation means neighboring tiles can have discontinuities in ice position.  The typical dispersion between tiles in an 8-day composite might be about 4 days, and when I'm manually clear-image hunting I often wind up comparing MODIS images from that far apart anyway, so I'm already resigned to that resolving those kinds of time discontinuities when they are presented obviously.  In any case it is that is far less objectionable than the pixel-by-pixel smearing that NASA's composites have.  Of course I could easily go the other direction and process with larger tile sizes for a more coherent picture, but at a sacrifice of clearness, since I wouldn't be able to remove as many clouds.  NASA's ordinary rapid-response mosaics aren't trying to remove clouds, so they have a lot fewer objectionable seams (except at the pole) since their effective block size is usually pretty large.

It may well be that there are different optimal choices for different cloud conditions and compositing time lengths, but I do want to settle on something so I can start back-processing data from this year and previous years.

In any case this product is very much in an "alpha" or "beta" version, so any comments you have are appreciated! 

Mari

  • New ice
  • Posts: 1
    • View Profile
  • Liked: 0
  • Likes Given: 0
Re: Home brew AMSR2 extent & area calculation
« Reply #374 on: August 23, 2013, 05:53:46 AM »
danp,
I have been watching and studying for several months here and am venturing my first post to tell you that I am really excited about your composite project. I would love to see it at 250. I began studying sea ice last fall while enrolled as an undergrad painting major. I was getting a lot of flack for painting a landscape (boring, already been done...), so I decided for my next series I'd take my references from satellite and ariel images. My studio space was always open and it ended up that it was where most other students first learned anything about the arctic. I taped up a lot of print outs on what was happening then and it got a lot of interest. It is also pretty cool when the images are 4 feet across. When people see what the arctic looks like, they really are amazed. That's an opportunity then to begin to begin to educate them about it. I have since graduated and do not have studio space, but as soon as I can I will be back to painting sea ice again. Meanwhile I have gained such an education from reading the forum and following up with study. Many thanks to Espen and all of you.

Wipneus

  • Citizen scientist
  • Young ice
  • Posts: 4220
    • View Profile
    • Arctische Pinguin
  • Liked: 1025
  • Likes Given: 0
Re: Home brew AMSR2 extent & area calculation
« Reply #375 on: August 23, 2013, 08:28:43 AM »
Extent: -53k7 (+1284k vs 2012)
Area: -91k0 (+1136k vs 2012)

The melt is continuing mostly in the CAB and ESS. Area decline in the CAB is even bigger, probably a "rebound" from the slow last few days.

Added to the extent, area and compaction graphs are the calculated values from Jaxa's AMSR2 concentration data. These (level 3) data are available in a 10km polar stergraphic grid. Jaxa uses a modified Bootstrap sea ice concentration algorithm, so it is interesting to compare with the ASI algorithm used by Uni Hamburg.
 
You will find the updated graphs in the top post

The details (in 1000 km2):


Extent:
           Arctic Basin       East Siberian Sea              Laptev Sea
                  -23.6                   -14.8                    -8.3
               Kara Sea             Barents Sea           Greenland Sea
                   -2.9                     0.0                    -1.8
Baffin/Newfoundland Bay            St. Lawrence              Hudson Bay
                    1.3                     0.0                    -1.5
   Canadian Archipelago            Beaufort Sea             Chukchi Sea
                   -7.6                    -1.9                     7.3
             Bering Sea          Sea of Okhotsk            Total Extent
                    0.0                     0.0                   -53.7

Area:
           Arctic Basin       East Siberian Sea              Laptev Sea
                  -70.9                    -8.1                    -4.9
               Kara Sea             Barents Sea           Greenland Sea
                   -2.9                     0.0                    -3.9
Baffin/Newfoundland Bay            St. Lawrence              Hudson Bay
                    0.2                     0.0                    -1.6
   Canadian Archipelago            Beaufort Sea             Chukchi Sea
                   -9.1                     1.7                     8.3
             Bering Sea          Sea of Okhotsk              Total Area
                    0.0                     0.0                   -91.0


Wipneus

  • Citizen scientist
  • Young ice
  • Posts: 4220
    • View Profile
    • Arctische Pinguin
  • Liked: 1025
  • Likes Given: 0
Re: Home brew AMSR2 extent & area calculation
« Reply #376 on: August 23, 2013, 08:41:33 AM »
I keep looking at the Atlantic section. The polynya seems have moved to the east.

(image attached, log in to see)

Wipneus

  • Citizen scientist
  • Young ice
  • Posts: 4220
    • View Profile
    • Arctische Pinguin
  • Liked: 1025
  • Likes Given: 0
Re: Home brew AMSR2 extent & area calculation
« Reply #377 on: August 23, 2013, 08:42:46 AM »
And the color coded concentration map.

(log in to see)

Artful Dodger

  • Frazil ice
  • Posts: 459
  • The traps have got him, and that's all about it!
    • View Profile
  • Liked: 24
  • Likes Given: 127
Re: Home brew AMSR2 extent & area calculation
« Reply #378 on: August 23, 2013, 09:34:22 AM »
I have considered processing all the way to the top MODIS resolutions
<snip>
my main constraint (download bandwidth)
Hi Dan, great work!

Couldn't you use the 4 km 3-6-7 daily data to select the 250 m data to download? Then you'd only be downloading large files that you will actually use.

Thanks again for these outstanding derivatives.  :D
Cheers!
Lodger

danp

  • New ice
  • Posts: 66
    • View Profile
  • Liked: 0
  • Likes Given: 0
Re: Home brew AMSR2 extent & area calculation
« Reply #379 on: August 23, 2013, 04:58:20 PM »
Thanks Artful Dodger!

Couldn't you use the 4 km 3-6-7 daily data to select the 250 m data to download? Then you'd only be downloading large files that you will actually use.


I've thought of doing something like that, although my clear-swath algorithm requires a lot more data than just the 3-6-7.  In general the best data series for my purposes has turned out to be the level-2 MOD09 swaths.  These include *all* MODIS channels at their top resolutions, and there's no subsampled version.  The reason I chose this series was that the extra processing that the NASA land team does beyond the 1B files to remove haze, correct for sun angle and atmospheric reflection, and calculate absolute surface reflectance, was quite effective and beyond my ability to reproduce without tremendous work.  Even though those efforts aren't all well-optimized for the Arctic, they're a major help since the sun angle is always so low.

I've needed to use all of this good-quality data to assess my algorithm's selection abilities, as well for as a couple of other so-far unsuccessful projects.  Once everything about the method of producing this data is settled, I can reassess the ongoing downloads required, but for now it's an easy if inconvenient task.  I suppose I should have said the true bottleneck is my programming time :)

Wipneus

  • Citizen scientist
  • Young ice
  • Posts: 4220
    • View Profile
    • Arctische Pinguin
  • Liked: 1025
  • Likes Given: 0
Re: Home brew AMSR2 extent & area calculation
« Reply #380 on: August 24, 2013, 08:17:40 AM »
Update 20130823.

Extent: -28k0 (+1241k vs 2012)
Area: +18k3 (+1154k vs 2012)

Slowing down, most of the little activity is CAB.
As a reminder, on the graphs you can follow the Bootstrap Jaxa AMSR2 extent and area. The calculation (from Jaxa L3 data) now includes both ascending and descending swaths. Not unlike the Windsat data, but much much smoother, without any averaging (AFAIK).

 
You will find the updated graphs in the top post

The details (in 1000 km2):


Extent:
           Arctic Basin       East Siberian Sea              Laptev Sea
                  -14.1                    -9.1                    -5.2
               Kara Sea             Barents Sea           Greenland Sea
                   -4.5                     0.0                    10.1
Baffin/Newfoundland Bay            St. Lawrence              Hudson Bay
                   -9.4                     0.0                     0.5
   Canadian Archipelago            Beaufort Sea             Chukchi Sea
                   -0.8                     7.5                    -3.2
             Bering Sea          Sea of Okhotsk            Total Extent
                    0.0                     0.0                   -28.0

Area:
           Arctic Basin       East Siberian Sea              Laptev Sea
                    3.3                     3.8                    -2.8
               Kara Sea             Barents Sea           Greenland Sea
                   -3.5                     0.0                    13.8
Baffin/Newfoundland Bay            St. Lawrence              Hudson Bay
                   -6.3                     0.0                     1.1
   Canadian Archipelago            Beaufort Sea             Chukchi Sea
                    1.8                    12.7                    -5.5
             Bering Sea          Sea of Okhotsk              Total Area
                    0.0                     0.0                    18.3


Wipneus

  • Citizen scientist
  • Young ice
  • Posts: 4220
    • View Profile
    • Arctische Pinguin
  • Liked: 1025
  • Likes Given: 0
Re: Home brew AMSR2 extent & area calculation
« Reply #381 on: August 24, 2013, 08:26:27 AM »
Still looking at the polar polynya's and watching it grow.

(attached image, log in to see)

Wipneus

  • Citizen scientist
  • Young ice
  • Posts: 4220
    • View Profile
    • Arctische Pinguin
  • Liked: 1025
  • Likes Given: 0
Re: Home brew AMSR2 extent & area calculation
« Reply #382 on: August 24, 2013, 08:27:45 AM »
And the color coded concentration map.

(log in etc.)

Wipneus

  • Citizen scientist
  • Young ice
  • Posts: 4220
    • View Profile
    • Arctische Pinguin
  • Liked: 1025
  • Likes Given: 0
Re: Home brew AMSR2 extent & area calculation
« Reply #383 on: August 25, 2013, 08:21:56 AM »
Today's update from Uni Hamburg - three hours earlier than usual - contains no data.

Hopefully it gets fixed soon.

Wipneus

  • Citizen scientist
  • Young ice
  • Posts: 4220
    • View Profile
    • Arctische Pinguin
  • Liked: 1025
  • Likes Given: 0
Re: Home brew AMSR2 extent & area calculation
« Reply #384 on: August 26, 2013, 08:07:45 AM »
Update 20130825.

Extent: -29k3 (+1343k vs 2012)
Area: -64k7 (+1115k vs 2012)

An early update, data 20130824 was updated as well. The CAB is continuing its decline, today especially in area. The ice in the ESS is on the increase, other regions are relatively quit.
 
You will find the updated graphs in the top post

The details (in 1000 km2):


Extent:
           Arctic Basin       East Siberian Sea              Laptev Sea
                  -37.2                    12.7                   -11.1
               Kara Sea             Barents Sea           Greenland Sea
                    0.7                    -0.3                     7.8
Baffin/Newfoundland Bay            St. Lawrence              Hudson Bay
                    1.6                     0.0                    -0.7
   Canadian Archipelago            Beaufort Sea             Chukchi Sea
                    7.1                    -0.4                    -9.6
             Bering Sea          Sea of Okhotsk            Total Extent
                    0.0                     0.0                   -29.3

Area:
           Arctic Basin       East Siberian Sea              Laptev Sea
                  -89.6                    17.4                    -7.8
               Kara Sea             Barents Sea           Greenland Sea
                    0.7                    -0.2                    17.4
Baffin/Newfoundland Bay            St. Lawrence              Hudson Bay
                    1.2                     0.0                    -0.2
   Canadian Archipelago            Beaufort Sea             Chukchi Sea
                   14.5                   -13.2                    -5.0
             Bering Sea          Sea of Okhotsk              Total Area
                    0.0                     0.0                   -64.7


Wipneus

  • Citizen scientist
  • Young ice
  • Posts: 4220
    • View Profile
    • Arctische Pinguin
  • Liked: 1025
  • Likes Given: 0
Re: Home brew AMSR2 extent & area calculation
« Reply #385 on: August 26, 2013, 08:18:55 AM »
Today a large region of the day, the Siberian section of the CAB and large part of the Atlantic section. The polar polynya continues to grow. The ice edges are giving way on the Laptev/Kara side,  but grow on the ESS side. There is very little ice blocking the NE passage now.

(log in to see attached message)

Wipneus

  • Citizen scientist
  • Young ice
  • Posts: 4220
    • View Profile
    • Arctische Pinguin
  • Liked: 1025
  • Likes Given: 0
Re: Home brew AMSR2 extent & area calculation
« Reply #386 on: August 26, 2013, 08:20:43 AM »
And the color coded concentration map.

(attached as well, log in)

TerryM

  • First-year ice
  • Posts: 6002
    • View Profile
  • Liked: 893
  • Likes Given: 5
Re: Home brew AMSR2 extent & area calculation
« Reply #387 on: August 26, 2013, 09:03:00 AM »
Wipneus
I know this has been asked in the past, but do you think there is any chance that we'll see two separate ice packs this year. Winter is fast approaching so I suppose I'm relieved that this pattern wasn't in place 3 weeks ago when the sun was a little higher over the horizon.
At the moment it seems we're in a race with the inexorable chill that winter will bring.
Terry

jdallen

  • Young ice
  • Posts: 3412
    • View Profile
  • Liked: 651
  • Likes Given: 244
Re: Home brew AMSR2 extent & area calculation
« Reply #388 on: August 26, 2013, 09:19:38 AM »
I think for all intents and purposes, we have at least three, as even though the are no separated by obvious open water, they are physically disconnected in ways the Mesh pack isn't. I wonder what effect this may have on ridging, and possible circulation?
This space for Rent.

Wipneus

  • Citizen scientist
  • Young ice
  • Posts: 4220
    • View Profile
    • Arctische Pinguin
  • Liked: 1025
  • Likes Given: 0
Re: Home brew AMSR2 extent & area calculation
« Reply #389 on: August 26, 2013, 09:26:46 AM »
Terry, you are giving my own thoughts words. I can only add that CAB extent declined in 2012 until late in September, if repeated then some 400-500k loss is still in the pipe line. 400k is also the difference between CAB-area and CAB-extent.


paulklem

  • New ice
  • Posts: 14
    • View Profile
  • Liked: 0
  • Likes Given: 0
Can you generate a map showing the seven-day change?
« Reply #390 on: August 26, 2013, 05:50:21 PM »
The change over the last week in red/blue, could be interesting. The open areas are both growing and moving, so there should be a red rim, and on the other side of open water areas, a blue rim.

TIA.

Wipneus

  • Citizen scientist
  • Young ice
  • Posts: 4220
    • View Profile
    • Arctische Pinguin
  • Liked: 1025
  • Likes Given: 0
Re: Can you generate a map showing the seven-day change?
« Reply #391 on: August 26, 2013, 07:07:17 PM »
The change over the last week in red/blue, could be interesting. The open areas are both growing and moving, so there should be a red rim, and on the other side of open water areas, a blue rim.

TIA.

We have seen that pattern already this week. Here is the difference with a week ago.

(log in etc)

paulklem

  • New ice
  • Posts: 14
    • View Profile
  • Liked: 0
  • Likes Given: 0
Thanks. Very interesting image.
« Reply #392 on: August 26, 2013, 07:31:42 PM »
The big polynya grew significantly, and doesn't have much of blue edge, indicating that side of the polynya melted out as the pack moved.  Also Looks like 80-100 km of ice edge retreat on the Barents sea side. This next two weeks should be very interesting.

Shared Humanity

  • Guest
Re: Home brew AMSR2 extent & area calculation
« Reply #393 on: August 26, 2013, 07:55:39 PM »
Is the lack of blue in the low concentration areas in the CAB evidence of very little compaction?

Bob Wallace

  • Young ice
  • Posts: 3855
    • View Profile
  • Liked: 41
  • Likes Given: 5
Re: Home brew AMSR2 extent & area calculation
« Reply #394 on: August 26, 2013, 08:01:39 PM »
Seems like a one week comparison would be more useful than a one day comparison.  (Looking at your recent image post.)

Reserve the one day comparison for times at which something unusually strong might happen

jdallen

  • Young ice
  • Posts: 3412
    • View Profile
  • Liked: 651
  • Likes Given: 244
Re: Home brew AMSR2 extent & area calculation
« Reply #395 on: August 26, 2013, 08:39:45 PM »
Is the lack of blue in the low concentration areas in the CAB evidence of very little compaction?

More like the practical impossibility of sorting out the myriad of small changes manually, I think...
This space for Rent.

Wipneus

  • Citizen scientist
  • Young ice
  • Posts: 4220
    • View Profile
    • Arctische Pinguin
  • Liked: 1025
  • Likes Given: 0
Re: Home brew AMSR2 extent & area calculation
« Reply #396 on: August 27, 2013, 08:17:50 AM »
Update 20130826.

Extent: -10k9 (+1375k vs 2012)
Area: -21k5 (+1196k vs 2012)

CAB has a bit slower day, especially in extent. Most of the decline to day in CAA, folowed by Laptev and ESS.


You will find the updated graphs in the top post

The details (in 1000 km2):


Extent:
           Arctic Basin       East Siberian Sea              Laptev Sea
                   -7.3                    -7.7                    -9.0
               Kara Sea             Barents Sea           Greenland Sea
                    1.9                     0.1                    15.1
Baffin/Newfoundland Bay            St. Lawrence              Hudson Bay
                    5.4                     0.0                     0.3
   Canadian Archipelago            Beaufort Sea             Chukchi Sea
                  -14.6                     7.6                    -2.5
             Bering Sea          Sea of Okhotsk            Total Extent
                    0.0                     0.0                   -10.9

Area:
           Arctic Basin       East Siberian Sea              Laptev Sea
                  -18.2                    -8.5                    -7.6
               Kara Sea             Barents Sea           Greenland Sea
                   -0.4                     0.1                    10.9
Baffin/Newfoundland Bay            St. Lawrence              Hudson Bay
                    3.1                     0.0                     0.1
   Canadian Archipelago            Beaufort Sea             Chukchi Sea
                   -9.5                     8.9                    -0.2
             Bering Sea          Sea of Okhotsk              Total Area
                    0.0                     0.0                   -21.5


Wipneus

  • Citizen scientist
  • Young ice
  • Posts: 4220
    • View Profile
    • Arctische Pinguin
  • Liked: 1025
  • Likes Given: 0
Re: Home brew AMSR2 extent & area calculation
« Reply #397 on: August 27, 2013, 08:38:25 AM »
As this thread is partly following the day-to-day development of the arctic sea ice coverage during the 2013 melt season, here I zoom in on the daily change of the Polar Polynya: it is still growing.
It is now up to 50 pixels wide: more than 150km.

(log in to see attached image)


Wipneus

  • Citizen scientist
  • Young ice
  • Posts: 4220
    • View Profile
    • Arctische Pinguin
  • Liked: 1025
  • Likes Given: 0
Re: Home brew AMSR2 extent & area calculation
« Reply #398 on: August 27, 2013, 08:54:56 AM »
And because it is high time we look elsewhere as well, here is the situation in the east. Here it is more a mix of reds and blues->little net change. A large ice island, separated from the pack is about to disappear.

(images attached, log in to see them)

Wipneus

  • Citizen scientist
  • Young ice
  • Posts: 4220
    • View Profile
    • Arctische Pinguin
  • Liked: 1025
  • Likes Given: 0
Re: Home brew AMSR2 extent & area calculation
« Reply #399 on: August 27, 2013, 09:22:00 AM »
Seems like a one week comparison would be more useful than a one day comparison.  (Looking at your recent image post.)

Reserve the one day comparison for times at which something unusually strong might happen

Bob,
A two-week comparison is part of Neven's two weekly overview on ASIB.
The daily comparison are part of the daily numbers, I would not like to see that change.

Anyway, when the season is over (first October), I intend to stop for some reflection,  rehauls of  some algorithms and software rewrites. The goal for 2014 is some automated way of presenting near-real-time regional area and extent from as many sources as I can possibly find.
The best way to present them is part of that and suggestions are very welcome.