I think the argument that the decline in max volume will flatten is likely correct.
But that's the only part I agree with. If increases in melt are due to more open water, are you claiming that there will be less open water? Because it seems the opposite is what is happening and will continue to happen. More open water earlier in the season, as well as many other factors all pushing the system towards more melt.
It seems to me that the argument that increased melt is caused by declining max volumes is putting the cart before the horse.
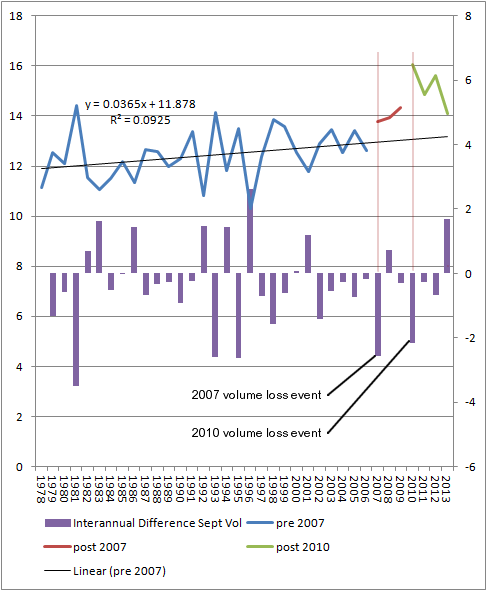
That graph shows melt season volume losses, i.e. from April max to September min. Those are the upper series of line plots in light blue, red and green. It also shows the interannual volume difference - difference of volume from year to year.
After the 2007 volume loss event the annual range of CT Area (and NSIDC Extent) goes up.
http://arctic.atmos.uiuc.edu/cryosphere/IMAGES/seaice.area.arctic.pngThis is because losses in the melt season have increased, and this has been compensated for by increased freeze season gains.
After the 2010 volume loss event spring volume loss has become more aggressive, up until weather intervened this year to mute the response, this pattern had even started this year.
You will note that in the first graph of this reply I have provided the trend line from 1978 to 2006, and have left 2007 to 2009, and 2010 to 2013's summer losses as seperate. This is to highlight what has been going on. Those two later periods are well above the earlier trend, and there is reason to expect that they are actually discrete increases in volume loss during the melt season.
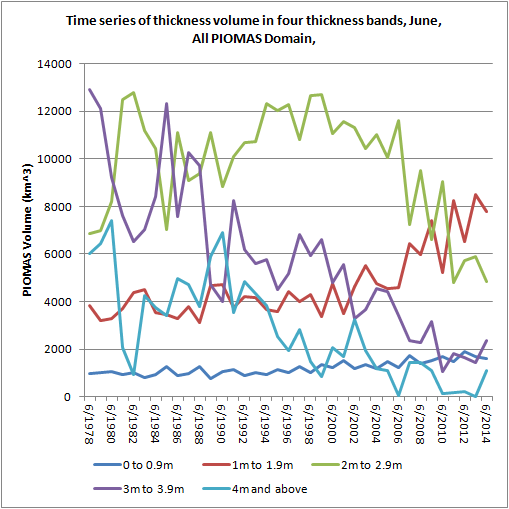
The 2007 volume loss event thinned ice massively causing a large net movement from ice volume in the 2 to 3m thickness band down to the 1 to 2m thickness band.
This has increased the ease with which open water can be produced and led to greater extent and area losses during the summer.
The 2010 volume loss event was followed in 2010 to 2013 by increased losses, notably in the Central Arctic. 2009 shows a similar increase, but it is far less marked than in 2010 to 2012 and was more like 2013.
What is causing the loss in spring is massive thinning of much of the Central Arctic.
This plot shows PIOMAS volumes in four thickness bands.
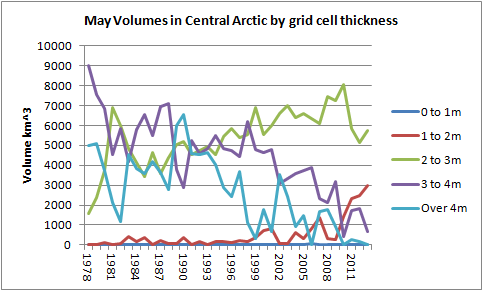
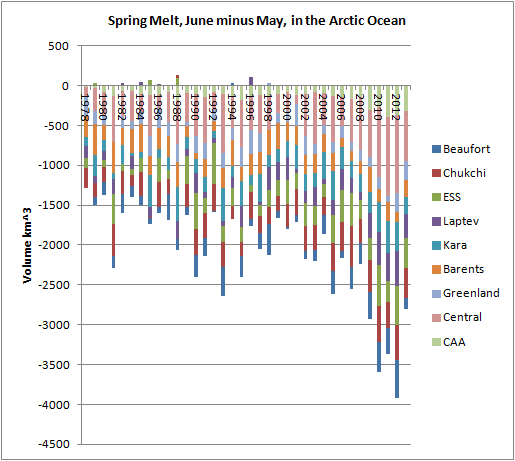
It can be seen that the 2m to 3m band loses substantial volume in 2010 and volume moves down into the 1 to 2m thickness band. As a result the Spring Melt (May to June losses) is markedly more in the 1 to 2m band, and less in the 2 to 3m thickness band after 2010.
Furthermore PIOMAS has been shown to exhibit very aggressive early melt season volume losses when April thickness is thinned by 1m, leading to only the thickest ice off the CAA surviving to the end of the melt season.
So rather than viewing the entire timeseries of melt season volume losses as a tale of increasing volume losses for one reason, I am seeing a general increase of melt with warming and overall loss of multi-year ice, with two step increases at the end of the series. Note here the behaviour of the 1978 to 2006 plot in the first graphic of this post against the linear trend. Is a linear trend an appropriate fit?
Attached below are the residuals from the linear trend and a quadratic fit to the residuals. The bowing with low in the middle and high at the start and end suggests a quadratic fit tending towards an exponential would be a slightly better fit. But it would only give a slightly better fit than linear, and the fact that the post 2007 period residuals are so high above the previous residuals and the quad fit to the 1978 to 2006 period residuals from the linear trend suggests to me that the interpretation of the recent increase in melt season volume loss as an extension of past process is not likely to be sound.
So the large increase of melt season losses after 2007 and then after 2010 are, I argue, due to thinning of the pack caused by specific volume loss episodes. If this contention is correct, and the contention that future April Arctic Ocean volume will be set by ice growing to thermodynamic equilibrium thickness (TET) from September to April, then further volume loss events leading to net thinning of the pack and enabling further increases of melt season losses of volume look unlikely. Because with a mainly first year ice pack further drops in volume in years like 2012 will be followed by rapid recoveries to the volume implied by the TET around the time of those drops within a few years at most (Tietsche et al).


