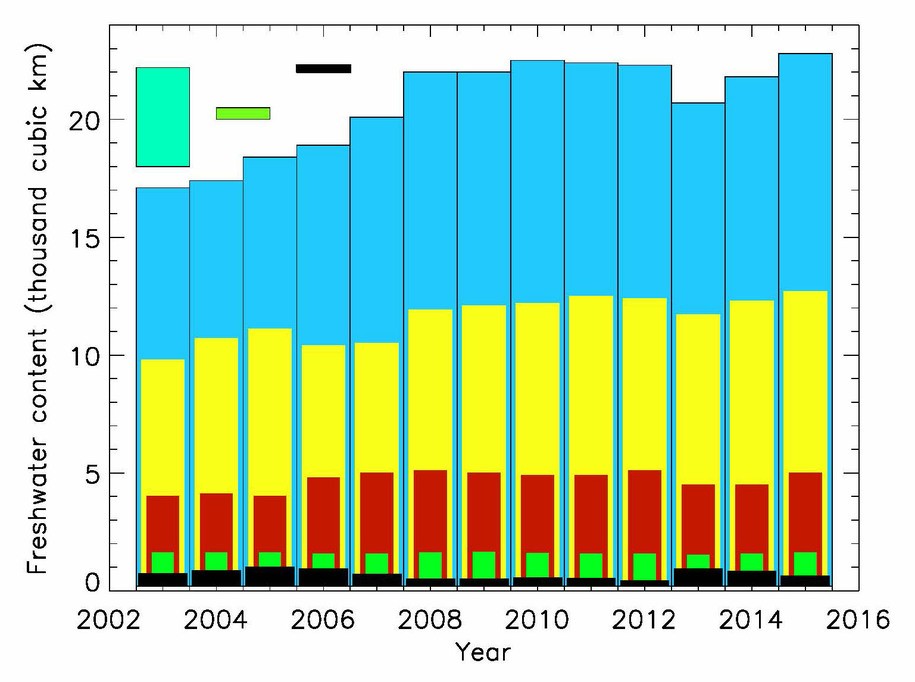
"Figure 3 Time series of freshwater content in different layers of the Beaufort Gyre region. Blue bars depict total liquid freshwater content. Black bars show freshwater content in sea ice. Yellow bars – freshwater content in the mixed layer, red bars – in the Pacific and green bars – in the Atlantic water layer. Freshwater content is shown in thousand cubic kilometers. Upper left bars shows total annual freshwater flux into the Arctic Ocean from all rivers; green and black small bars show errors in liquid and sea ice freshwater content estimates. All freshwater contents are calculated relative to 34.8 reference water salinity."
The build up in volume from 2002 to 2015 is about the volume of Lake Michigan which stores 4,918 cubic km of water.Huge volumes of fresh water have been building up over the past 20 years in the Arctic waters north of Alaska. A volume the size of Lake Michigan built up from 2003 through the end of 2015. Before the 1990’s there were regular cycles of fresh water build up and release within decades as periods of high pressure north of Alaska were followed by periods of stormy weather. Scientists suspect that over the past 20 years large amounts of melt water from Greenland’s glaciers have changed the dynamics of the North Atlantic ocean and the Arctic atmosphere. Since the 1990’s a dome of high pressure has persisted in the Beaufort sea and the anticyclonic winds have pumped fresh water towards the high’s center building up a mound of relatively fresh water over a huge area north of Alaska. The primary source of the fresh water is rivers that flow into the Arctic. Over the past several decades, sea ice melting has added about 20% to the increase of fresh water in the Beaufort sea.
The freshwater content of the Beaufort gyre increased by a volume the size of lake Michigan from the 1970s to 2008.
A major 2008 report by a team of scientists led by Wood’s Hole oceanographer Andrey Proshutinsky found an increase of 5000 km3 of fresh water from the 1970s to 2008.
www.whoi.edu/…
From 2008 to 2015 an additional 2000 km3 was added so the total increase in fresh water is 7,000km3. The total volume of the world’s second largest lake by volume, Lake Michigan, is just under 5,000km3.
 The freshwater content of the Beaufort gyre increased by a volume the size of lake Michigan from the 1970s to 2008. Preliminary data from the BGOS 2008 cruise indicate that the FWCL in the BG continued to rise in 2008 and reached 21,000 km3 – a historical maximum from all available years of observations. Compared to 1970s climatology (the pre-90s decade with the most extensive data coverage, (Figure 1) there has been a FWCL increase in the BG of approximately 5,000 km3. This is comparable with the volume of fresh water annually delivered to the Arctic Ocean by rivers and through Bering Strait (5700 km3 per year, Serreze et al., [2006]).
https://www.whoi.edu/beaufortgyre/pdfs/2008JC005104-pip.pdf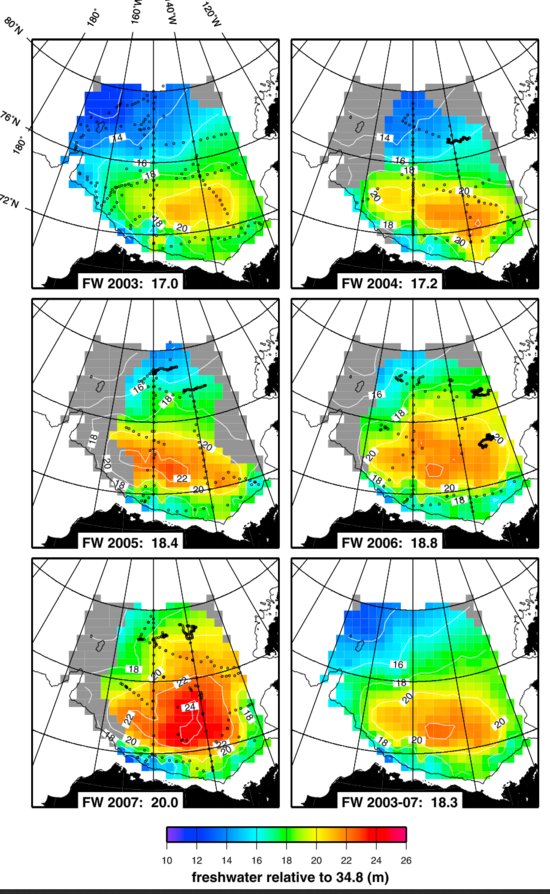 The freshwater layer in the Beaufort sea deepened by 3 meters - about 10 feet from 2003 to 2007. Because the Beaufort gyre covers a large area, this is a huge volume of fresh water. Anticyclonic winds associated with persistent high pressure in 2007 caused Siberian and North American river water and water from a record melt of sea ice in 2007 to flow into this Arctic sea north of Alaska.
The persistent anticyclonic Beaufort high pressure builds up a mound of water under it because the direction of a mass of water moves to the right of the wind direction in the northern hemisphere because the rotation of the earth gives the water spin. See this post at Neven’s sea ice blog by an Arctic oceanographer for details. neven1.typepad.com/...
On the other hand, cyclonic rotation associated with low pressure areas causes water to well up from below the center of the low. Thus years of high pressure followed by years of storminess cause moderate periodic surges of fresh water from the Arctic to the north Atlantic ocean. It was like the Arctic breathed in fresh water then breathed it out in a period of a decade or less. The largest observed freshwater surge called the “Great Salinity Anomaly” happened in the early 1970’s.
The Great Salinity anomaly was one of the likely causes of the brutal American winters of the 1970s. Fresh water tends to float over denser warm salty Gulf Stream water in sub-Arctic seas of the north Atlantic. This keeps the warm salty water from releasing its heat to the atmosphere and sinking thousands of feet into the deep Atlantic. This disruption of the thermohaline circulation is popularly called slowing down the Gulf Stream. The deep overturning circulation brings Gulf Stream water to the subarctic seas, warming Europe and north America. When deep water formation slows brutal winters tend to follow. This effect, combined with the reflective effects of growing levels of sulfuric acid pollution over the north Atlantic in the 1960s and 1970s caused cold north American and European winters in those decades. This cool period that broke up the trend of greenhouse gas caused global warming that has been ongoing since the turn of the twentieth century has been intentionally misinterpreted by climate change deniers to confuse politicians and the public about climate change.
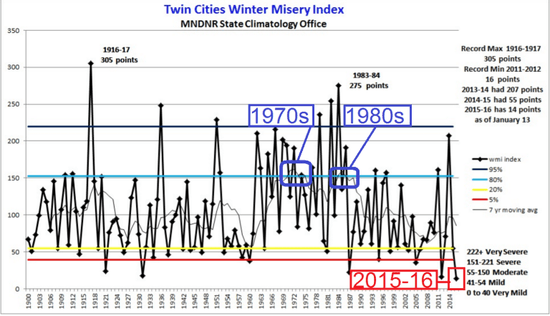 Winters were miserably cold in Minnesota and the central and eastern U.S. in the 1970s.
Last spring, following the extremely abrupt collapse of the winter polar vortex in a sudden stratospheric warming a very intense Beaufort high developed driving more fresh water into the gyre. The strong high pressure in the sunny spring months melted out the ice early. Midwinter high pressure under dark skies is favorable for ice growth but under the bright long sunny days of May the ice melted and the water took up enormous amounts of heat. That warm water then opened up the ice plugged channels between the islands of northernmost Canada. If high pressure breaks down now the thick plugs of multi-year ice that used to block the channels won’t be there to impede the fresh water from draining out to the north Atlantic. The largest channels have a thin ice cover.
Arctic scientists fear that a large volume of the stored fresh water could be rapidly released, drastically impacting the northern hemisphere’s weather.
http://earthobservatory.nasa.gov/blogs/fromthefield/category/beaufort-gyre-exploration/ As I said back in my first blog entry, one of the key objectives of the expedition was to produce an up-to-date assessment of the freshwater content of the Beaufort Gyre. Based on a preliminary analysis of the data collected on this cruise, my colleagues reckon the total freshwater content of the Gyre could be at a record high. A chemical analysis of the ocean surface suggests that sea ice melt contributed around 20 percent of the fresh water mixed up within the surface waters, compared to around 80 percent from Canadian and Russian rivers flowing into the Arctic. The sea ice contribution was thought to be neutral a few decades ago, but the ice is now melting more than it’s growing, as we clearly witnessed, causing an imbalance. The wind circulation is also important in driving the ocean circulation that sucks in fresher surface waters into the Gyre (see an earlier blog of mine for more details).
Why does this all matter? Well, some scientists posited that the Beaufort Gyre oscillates between periods of spinning up and sucking in freshwater, and spinning down and releasing fresh water. A kind of breathing, if you like. The Gyre has been spinning up and sucking in fresh water for a few decades now (2008 saw a big increase) and we keep waiting, with similarly bated breath, for this trend to reverse. If the Gyre does reverse (breathe out), the Arctic Ocean will likely dump a load of fresh water into the Atlantic Ocean (as we think it did in the 1970s), which could cause some big impacts on weather patterns across the Northern Hemisphere. We’re not expecting a scene out of The Day After Tomorrow, but we’re not entirely sure what could happen either.This dark half of the Arctic year has been by far the warmest to date on record and storms have repeatedly slammed the sea ice to record lows while pulling in heat from both the Atlantic and Pacific oceans. If this stormy weather continues, the fresh water dome will break down and the fresh water rapidly drain towards the north Atlantic through the channels of the Canadian archipelago and through the Fram strait east of northern Greenland.
The weather forecast for the next 10 days by the European model is insane. Deep lows will pull massive amounts of heat into the Arctic, which will keep sea ice extent and volume at record low levels for the date and will work to spin down the currents that keep the dome fresh water in the Beaufort sea.
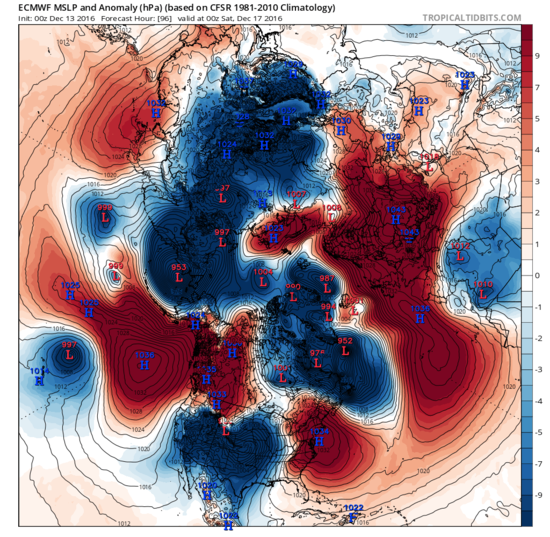 5 day ECMWF weather forecast shows storms entering the Arctic from both the Atlantic and Pacific. The winds will bring enormous amounts of atmospheric heat, taken from the Atlantic and Pacific oceans, into the Arctic.
The weather pattern developing in the Arctic is the pattern that has drained the fresh water form the Beaufort gyre in the past. Extremely deep lows are moving from the Atlantic into the Arctic. Low pressure is dominating the region from the Atlantic’s subarctic seas to the Arctic ocean. If this pattern continues through this winter, a volume of fresh water greater than lake Michigan could be set in motion towards the north Atlantic and the overturning circulation could stall when the light fresh water caps the Labrador sea. This could cause the Gulf Stream itself to slow while heat would build up in tropical oceans.
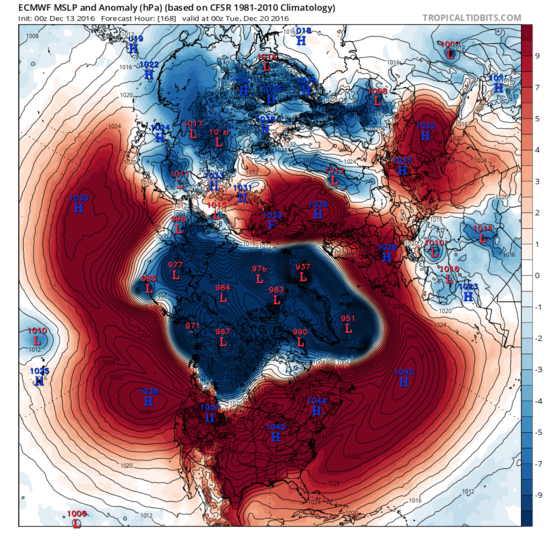 Extreme low pressure is forecast by the ECMWF model to cover the Arctic and north Atlantic in 7 days.
Scientists and Arctic observers are shocked by this year’s extraordinarily warm Arctic weather but the sudden release of fresh water to the Atlantic could cause a sudden shift to much colder winter weather towards the end of the decade. This is a very unpredictable situation, but Greenland ice cores show that rapid, extreme climate oscillations may be triggered by north Atlantic salinity cycles.
http://www.atmosp.physics.utoronto.ca/~peltier/pubs_recent/W.R.%20Peltier%20and%20G.%20Vettoretti,%20Dansgaard%20Oeschger%20oscillation%20in%20a%20comprehensive%20climate%20model,%202014.pdfWe may be entering a period of extreme climate chaos.
