It seems to me like the area numbers for the beginning of June are going to have to come down before we can reasonably expect ice-free Septembers. The peak sun needs some low albedo surface area to work on, and that will require lower June 1st sea ice area numbers.
I have found that the average arctic sea ice CT area ice decline from June 1st to September 1st was about 6.177 million km^2. Interestingly, if 2014 ends up at about 3.8 million km^2 by September 1st as I expect at this point, then it will fall right around this average with a decline of 6.184 million km^2. This has actually been an
average, not that bad melt season when comparing to the 1979-2014 baseline, although it of course has seemed way below average compared to the 2007-2014 baseline to which we have psychologically adjusted to expect nowadays. (The average decline between June 1st and September 1st for 2007-2014 has been 6.824 million km^2).
The highest decline from June 1st to September 1st in the record was, of course, 2014 at 7.434 million km^2.
The conclusion I draw from this is that, considering that the melt weather in 2012 was pretty much ideal, CT sea ice area has to be less than 8.5 million km^2 by June 1st to give any year a realistic shot at getting below 1 million km^2 by the September minimum. (This 1 million km^2 mark is, of course, what many people consider to be a fair definition of "practically ice-free").
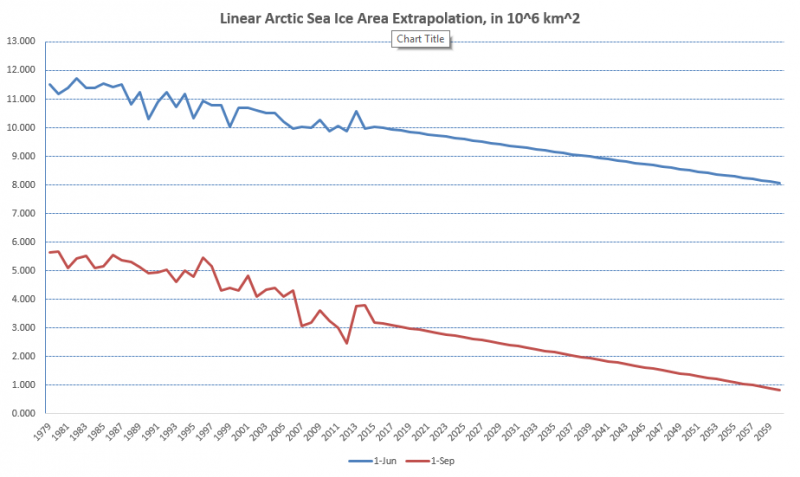
I have made a chart with some linear extrapolations of June 1st and Sept 1st CT areas:
What I have concluded from this is that:
A. To the naked eye, the linear extrapolations seem to fit with the existing data very well, especially after 2013 and 2014, and especially the June 1st data. It is looking more and more like 2012 was a fluke bad year, and the underlying trend really is linear rather than exponential.
B. According to this linear extrapolation, June 1st CT area will not be approaching that critical 8.5 million km^2 mark on a regular basis until about 2050, thus precluding September minima under 1 million km^2 even under subsequently ideal summer melt conditions. That said, there could be some years that dip down below this June 1st trend line, but the critical thing is that for a <1 million km^2 melt-out to occur significantly before 2050, BOTH the June 1st area reading would have to be below extrapolation (implying above-average melt weather before June 1st), AND the melt weather would have to continue to be optimal, or else, even if you get down to 8.5 million km^2 by June 1st, if you only have average melt weather after that and lose 6.1 million km^2 or even 6.8 million km^2 after that, you still only make it down to 2.4 million km^2 or 1.7 million km^2. To get a <1 million km^2 melt-out before 2050, BOTH the pre-June 1st and post-June 1st melt season would have to have above-average melt weather.
Therefore, I would place my bets on the earliest outlier <1 million km^2 September melt-out happening no earlier than 2035, with regular <1 million km^2 September melt-outs not occurring until at least 2045.


