Support the Arctic Sea Ice Forum and Blog

Author Topic: The 2014 Melting Season  (Read 1789928 times)

jai mitchell

  • Nilas ice
  • Posts: 2357
    • View Profile
  • Liked: 207
  • Likes Given: 60
Re: The 2014 Melting Season
« Reply #1100 on: June 09, 2014, 03:48:27 PM »
Specific Humidity Inversions:

http://www.hindawi.com/journals/amete/2011/486807/

Characteristics of Temperature and Humidity Inversions and Low-Level Jets over Svalbard Fjords in Spring

Quote
the mechanisms generating humidity inversions have received much less attention than those generating temperature inversions. Condensation, gravitational fallout of the condensate, deposition of hoar frost at the surface, turbulent transport of moisture, and subsidence are processes in vertical dimension that contribute to the generation of humidity inversions [13]. In addition, horizontal advection of moist air masses from lower latitudes is an essential large-scale process; the advection peaks above the atmospheric boundary layer (ABL) but there is still significant uncertainty on its vertical distribution
Haiku of Futures Passed
My "burning embers"
are not tri-color bar graphs
+3C today

Bob Wallace

  • Young ice
  • Posts: 3855
    • View Profile
  • Liked: 41
  • Likes Given: 5
Re: The 2014 Melting Season
« Reply #1101 on: June 09, 2014, 05:14:15 PM »
How about a "Science of the 2014 Melting Season" thread and a "Speculation about the 2014 Melting Season" thread?

I'd like that.  I'd like to see a discussion more like what we used to have when there was detailed discussion of the current melting season. 

I'm just not that interested in what might happen sometime out beyond our ability to forecast.  (I don't participate in the polls because that, to me, seems like guessing about the future weather.

The two threads would not need be called "Science" and "Speculation".  Something along the lines of "Current Ice Conditions" and "Peering into the Melt Season" might be a bit less "loaded".

Buddy

  • Young ice
  • Posts: 3379
  • Go DUCKS!!
    • View Profile
  • Liked: 49
  • Likes Given: 34
Re: The 2014 Melting Season
« Reply #1102 on: June 09, 2014, 05:37:39 PM »
"I'm just not that interested in what might happen sometime out beyond our ability to forecast.  (I don't participate in the polls because that, to me, seems like guessing about the future weather."

Although....as an "aside".........it is the direction of the short term that is much harder to forecast.....than the direction of the long term.

Just a thought......
FOX (RT) News....."The Trump Channel.....where truth and journalism are dead."

F.Tnioli

  • Grease ice
  • Posts: 772
    • View Profile
  • Liked: 147
  • Likes Given: 38
Re: The 2014 Melting Season
« Reply #1103 on: June 09, 2014, 05:51:12 PM »
...
Although....as an "aside".........it is the direction of the short term that is much harder to forecast.....than the direction of the long term.

Just a thought......
Worthy thought. I'd expand it. Seems to me that it's quite more complicated curve if we'd consider wider range of time periods. I'd say, direction of extremely short term (~1 hour or so) is easier to deal with than "just" short term (few days), in most cases at least; on the other hand, "very long term" (more than ~5 decades) seems to be easier to predict than "just" long term (several motnhs or years), since we definitely know that "very long term", there will just be open water - but we are not so sure how much open water there will be in "just" long term. So it's kinda 4th-order-polinomial graph for "how easy it is to predict" vs "time", eh? And that's without going geological and quantum time scales yet, which i bet have their own tendencies. If the God made this world, then he certainly didn't care to make forecasters' job too easy... :D
To everyone: before posting in a melting season topic, please be sure to know contents of this moderator's post: https://forum.arctic-sea-ice.net/index.php/topic,3017.msg261893.html#msg261893 . Thanks!

Frivolousz21

  • Nilas ice
  • Posts: 1915
  • Live in Belleville, IL..15 miles SE of St. Louis.
    • View Profile
  • Liked: 598
  • Likes Given: 7
Re: The 2014 Melting Season
« Reply #1104 on: June 09, 2014, 07:18:09 PM »
12z gfs is bad again.

00zOP models good for ice.

ensemble means bad for ice.

12z op gfs again bad.
I got a nickname for all my guns
a Desert Eagle that I call Big Pun
a two shot that I call Tupac
and a dirty pistol that love to crew hop
my TEC 9 Imma call T-Pain
my 3-8 snub Imma call Lil Wayne
machine gun named Missy so loud
it go e-e-e-e-ow e-e-e-e-e-e-blaow

crandles

  • Young ice
  • Posts: 3379
    • View Profile
  • Liked: 239
  • Likes Given: 81
Re: The 2014 Melting Season
« Reply #1105 on: June 09, 2014, 07:45:12 PM »
Worthy thought. I'd expand it. Seems to me that it's quite more complicated curve if we'd consider wider range of time periods. I'd say, direction of extremely short term (~1 hour or so) is easier to deal with than "just" short term (few days), in most cases at least; on the other hand, "very long term" (more than ~5 decades) seems to be easier to predict than "just" long term (several motnhs or years), since we definitely know that "very long term", there will just be open water - but we are not so sure how much open water there will be in "just" long term. So it's kinda 4th-order-polinomial graph for "how easy it is to predict" vs "time", eh? And that's without going geological and quantum time scales yet, which i bet have their own tendencies. If the God made this world, then he certainly didn't care to make forecasters' job too easy... :D

SIPN showed that different models disagreed about whether prediction would be easier or harder with less ice. (see day 1 morning 1 57min onwards)
http://www.arcus.org/sipn/meetings/workshops/april-2014

BTW
I only got to 2nd order unless you consider geologic time when 3rd order seemed necessary.

ChrisReynolds

  • Nilas ice
  • Posts: 1764
    • View Profile
    • Dosbat
  • Liked: 20
  • Likes Given: 9
Re: The 2014 Melting Season
« Reply #1106 on: June 09, 2014, 09:04:39 PM »
So far June 2014 is colder than any other post 2007 year, apart from 2013, and it takes some examination of the plots to show that 2014 is slightly warmer than 2013. However GFS shows warming over the coming week with temperatures pegging out at 0degC - a state that will then persist as warming cannot happen over ice above zero deg C - melting ice takes up the energy that would go into warming.

So I think it is too early to write off prospects for melt ponding spread and the CT Area anomaly cliff this June.

Furthermore the anomalous PIOMAS spring volume loss has clearly started with May's data.

Thie event still happened in 2013, and as with 2013 it led to unusually large losses for NSIDC Extent in June.


It is worth pointing out that for NSIDC Extent we are only ~0.4 million kmsq behind 2012, for CT Area we are only about 0.1 million sq km behind 2012 - that can be lost in just a few days. Catch up with 2012 will be harder over the next two weeks as 2012 raced ahead with massive June losses (see first graph).

BUT....

There is no precedent for the large tract of open water seen in Laptev so early in June.

Let's say ice reflects 80% of incident light, while water only reflects 20%, that means that for a region of open water that was ice there is a 60% gain in absorbed solar radiation. Concerned that cloud/fog is cutting out some sunlight? Lets say it cuts out half the sunlight, that's still a 30% gain in absorbed solar, and if it's cloud then the cloud is back radiating infra-red, which is absorbed by water and reflected by ice like sunlight.

This tract of open water is open in early June. Using the ten day losses of volume from PIOMAS as showing how much solar radiation is being absorbed and used to melt ice*, you can see that we've some way to go before we hit peak energy absorption.
http://farm8.staticflickr.com/7446/9703421624_eb542d20ee_o.png
*this curve of loss rate tracks insolation closely.

What will that open water have evolved into by July? It might be worth checking AMSR-2 SSTs from JAXA periodically, their AMSR-E page used to be really useful.
http://suzaku.eorc.jaxa.jp/GCOM_W/JASMES_daily/
AMSR-E Archived data (system not fully operational now) here:
http://sharaku.eorc.jaxa.jp/cgi-bin/amsr/polar_sst/polar_sst.cgi?lang=e&mode=main&date=new

Anyone know of another observational SST source that covers the Arctic Ocean?

ChrisReynolds

  • Nilas ice
  • Posts: 1764
    • View Profile
    • Dosbat
  • Liked: 20
  • Likes Given: 9
Re: The 2014 Melting Season
« Reply #1107 on: June 09, 2014, 09:38:06 PM »
Back to lurking after this, but first....

I've attached NCEP/NCAR plots of temperature, the first is a map plot, you can see the warming over land adjacent to the Laptev fast ice and open water.

The second is a cross section through the atmosphere. It shows a low level warming of over 5deg C (278K), zero deg C is 273K (Kelvin scale). The ocean starts at around 75 degN, and here the most intense warming ceases, but further into the ocean, northwards, there is a surface hugging tail of air temperatures above 273K especially around 78degN - I read this as the warming due to the patch of open water in Laptev. The ocean should be around zero without external heating, so why else would that surface hugging warming be happening if it wasn't due to solar heating of the open water.

Neven

  • Administrator
  • First-year ice
  • Posts: 9471
    • View Profile
    • Arctic Sea Ice Blog
  • Liked: 1333
  • Likes Given: 617
Re: The 2014 Melting Season
« Reply #1108 on: June 09, 2014, 09:41:54 PM »
Thanks a lot for your short analysis, Chris. I agree with what you say. Low temps, cloudy weather during most of May  and current SIE/SIA slowdown point to 2014 not making the top 3 this year. On the other hand, there's the unprecedented retreat on the Siberian side of the Arctic, where the ice is generally weaker this year, just like in 2012. On top of that 2014's piggy bank with fringe ice is pretty full, which creates an artificially high (just slightly) SIE/SIA, but despite that 2014 was right there battling it out with other lower years on the SIE/SIA charts until a couple of days ago.

Quote
Anyone know of another observational SST source that covers the Arctic Ocean?
Well, you probably know it, but I really like DMI's SST anomaly map (and there are other maps on the ASIG):


First red and orange showing up in the Siberian heat absorber.
The enemy is within
Don't confuse me with him

E. Smith

Lord M Vader

  • Nilas ice
  • Posts: 1406
    • View Profile
  • Liked: 60
  • Likes Given: 39
Re: The 2014 Melting Season
« Reply #1109 on: June 09, 2014, 10:17:40 PM »
I've seen that there are some discussions about the forecasts. My opinion is that the ECMWF usually is more reliable than the GFS. Yes, there have been a cold and cloudy start of the melt season but the models seems to hint a more meltfriendly weather pattern the next 10 days..

Right now I would say "Game Over" to this melt season even before it really started.. BUT, if the models are correct there is still a minor chance to a rapid melt, especially if the cyclones moves through those areas where the ice is most vulnerable and then are replaced by warmer and clearer skies...

The last two days (7-8 June) were extremely icefriendly with virtually no apparent melting. Of course, the resolution of JAXA should have problems to handle all those polynyas that have popped up now in Kara, Laptev, Hudson Bay and Labrador Sea. Once those areas becomes more "clean" the numbers will pop down quickly.

Neven, I agree with you about the idea that the SIE/SIA numbers are somewhat too high right now..

//LMV

Bob Wallace

  • Young ice
  • Posts: 3855
    • View Profile
  • Liked: 41
  • Likes Given: 5
Re: The 2014 Melting Season
« Reply #1110 on: June 09, 2014, 11:46:01 PM »
 SIE/SIA numbers are two dimensional measurements.  Thickness is missing.  Along with a "quality of ice" metric.  And we aren't able to predict weather more than a few days ahead.

I don't think much should be made of the numbers at this point.

It's "Watch and Wonder" time.  The details of how the ice is melting or not melting I find interesting. 

But that might just be me....

Nightvid Cole

  • Frazil ice
  • Posts: 438
    • View Profile
  • Liked: 5
  • Likes Given: 0
Re: The 2014 Melting Season
« Reply #1111 on: June 10, 2014, 12:35:03 AM »
SIE/SIA numbers are two dimensional measurements.  Thickness is missing.  Along with a "quality of ice" metric.  And we aren't able to predict weather more than a few days ahead.

I don't think much should be made of the numbers at this point.

It's "Watch and Wonder" time.  The details of how the ice is melting or not melting I find interesting. 

But that might just be me....

Yes. Bottom melt in the Beaufort started in May this year as indicated by multiple buoys, unlike last year. If it continues to accelerate ahead of last year, that ice is toast up to at least ~80 degrees north, excluding ice very near the CAA. Once this happens, the amount of 3+ year old ice (Which will become 4+ after the September minimum)  on the Fowler/Maslanik/Tschudi map will crash quite dramatically.

JayW

  • Grease ice
  • Posts: 607
    • View Profile
  • Liked: 226
  • Likes Given: 292
Re: The 2014 Melting Season
« Reply #1112 on: June 10, 2014, 12:46:04 AM »
Anyone know of another observational SST source that covers the Arctic Ocean?

You can plot your own at the physical sciences division at ESRL.  They have a couple data sets you can use I believe.

Image provided by Physical Sciences Division, Earth System Research Laboratory, NOAA, Boulder, Colorado, from their Web site at http://www.esrl.noaa.gov/psd/data/gridded/data.noaa.oisst.v2.highres.html
"To defy the laws of tradition, is a crusade only of the brave" - Les Claypool

Frivolousz21

  • Nilas ice
  • Posts: 1915
  • Live in Belleville, IL..15 miles SE of St. Louis.
    • View Profile
  • Liked: 598
  • Likes Given: 7
Re: The 2014 Melting Season
« Reply #1113 on: June 10, 2014, 12:47:49 AM »
Remember when you say area or extent showing melt.

They are proxies for sea ice not actual indicators of melting.


The Russian side fast ice is taking a beating.  Most of which CT will show in area drops the next 3-4 updates.


I got a nickname for all my guns
a Desert Eagle that I call Big Pun
a two shot that I call Tupac
and a dirty pistol that love to crew hop
my TEC 9 Imma call T-Pain
my 3-8 snub Imma call Lil Wayne
machine gun named Missy so loud
it go e-e-e-e-ow e-e-e-e-e-e-blaow

Frivolousz21

  • Nilas ice
  • Posts: 1915
  • Live in Belleville, IL..15 miles SE of St. Louis.
    • View Profile
  • Liked: 598
  • Likes Given: 7
Re: The 2014 Melting Season
« Reply #1114 on: June 10, 2014, 01:24:38 AM »

Melting has started well into the CAB at the surface.  So it's snow melt so far, most of it.


The real warmth and torching starts in 2-3 days
I got a nickname for all my guns
a Desert Eagle that I call Big Pun
a two shot that I call Tupac
and a dirty pistol that love to crew hop
my TEC 9 Imma call T-Pain
my 3-8 snub Imma call Lil Wayne
machine gun named Missy so loud
it go e-e-e-e-ow e-e-e-e-e-e-blaow

Andreas T

  • Nilas ice
  • Posts: 1149
    • View Profile
  • Liked: 18
  • Likes Given: 4
Re: The 2014 Melting Season
« Reply #1115 on: June 10, 2014, 01:31:46 AM »
...... Concerned that cloud/fog is cutting out some sunlight? Lets say it cuts out half the sunlight, that's still a 30% gain in absorbed solar, and if it's cloud then the cloud is back radiating infra-red, which is absorbed by water and reflected by ice like sunlight.
....
Ice, like water is not transparent at longwave IR wavelengths, it is a good absorber and emitter although less so than fresh snow. Albedo difference between ice and water must play a much smaller role in LW IR than sunlight.
I think the temperature profile from buoy data give some clue to radiation input into ice. I notice that the upper ice shows higher temps  than air and middle of the ice. I.e. it is cooled by ice below and air above, only heat source would be radiation, I think sunlight, clouds won't be warmer than ice (and therefore can only reduce cooling, not act as heat source) The crucial question is what is the difference to other years. I would like to see cloudiness anomalies plots the way there are temperature anomalies plots, does somebody know whether they exist?

Frivolousz21

  • Nilas ice
  • Posts: 1915
  • Live in Belleville, IL..15 miles SE of St. Louis.
    • View Profile
  • Liked: 598
  • Likes Given: 7
Re: The 2014 Melting Season
« Reply #1116 on: June 10, 2014, 02:20:09 AM »
The Beaufort side really gets smoked with a stout off shore flow right into the SW CAB.

The destruction gets worse as we have gone along outside of a couple OP runs.

By the time we get to medium range the cold air has been shunted to no mans land where it serves no help.

What is the most ominous is the ensemble means are pushing this big time.  Both go straight up dipole which is a huge sign it's gonna happen.

Both have wall to wall NA side ridges classic style.

Day 4-5 there will be big time heat blowing Off shore right over the Mackenzie Delta region with 20C+ high temps reaching the coast/fast ice left if there is none then.  Next that air will cause a rapid increase in SSTS.  Probably gains of like 2-6C+ in the relatively small open water region.  Whatever heating is retained when it reaches the ice will be highly determined of how far the air travels from land to the ice over the water.  And how warm that water is.

If the water is 3-5C the air obviously won't cool a ton or below that.  Having air in the order of 5C+ reaching the edge of the pack ice will cause rapid melt along the edge combine that with the Southerly to Easterly flow I think a pretty decently sized area of open water will emerge over the Western CAB/Beaufort.


I got a nickname for all my guns
a Desert Eagle that I call Big Pun
a two shot that I call Tupac
and a dirty pistol that love to crew hop
my TEC 9 Imma call T-Pain
my 3-8 snub Imma call Lil Wayne
machine gun named Missy so loud
it go e-e-e-e-ow e-e-e-e-e-e-blaow

Frivolousz21

  • Nilas ice
  • Posts: 1915
  • Live in Belleville, IL..15 miles SE of St. Louis.
    • View Profile
  • Liked: 598
  • Likes Given: 7
Re: The 2014 Melting Season
« Reply #1117 on: June 10, 2014, 07:46:43 AM »
00z GFS smokes the ESS the next two days and starts up melt on the Pacific side in general.

Between day 2 and 3 the big warm push into the CAB starts as the pattern switches to a more traditional dipole.  While also developing the thing that crushed the CAB in 2012.  It's been showing this a lot but not this mature.

An SLP over the NW Rockies/Alaska and an HP in the CA area.


As a teaser treat for all of my fellow medium range model fantasy lovers.

A massive heatwave forms over East Central Siberia.  With an SLP co-located to the West pressing a massive dome of heat into the arctic basin.  If anything like this came together

well.


I got a nickname for all my guns
a Desert Eagle that I call Big Pun
a two shot that I call Tupac
and a dirty pistol that love to crew hop
my TEC 9 Imma call T-Pain
my 3-8 snub Imma call Lil Wayne
machine gun named Missy so loud
it go e-e-e-e-ow e-e-e-e-e-e-blaow

jdallen

  • Young ice
  • Posts: 3410
    • View Profile
  • Liked: 650
  • Likes Given: 244
Re: The 2014 Melting Season
« Reply #1118 on: June 10, 2014, 08:05:33 AM »
Thanks a lot for your short analysis, Chris. I agree with what you say. Low temps, cloudy weather during most of May  and current SIE/SIA slowdown point to 2014 not making the top 3 this year. On the other hand, there's the unprecedented retreat on the Siberian side of the Arctic, where the ice is generally weaker this year, just like in 2012. On top of that 2014's piggy bank with fringe ice is pretty full, which creates an artificially high (just slightly) SIE/SIA, but despite that 2014 was right there battling it out with other lower years on the SIE/SIA charts until a couple of days ago.

Quote
Anyone know of another observational SST source that covers the Arctic Ocean?
Well, you probably know it, but I really like DMI's SST anomaly map (and there are other maps on the ASIG):


First red and orange showing up in the Siberian heat absorber.

You'll have to explain sometime why you dislike DMI - but another time.

I have problems wrapping my brain around the temperature plots which imply we are having a "cooler" melt season, when I keep stumbling across stuff like this:
(NOAA, June 9, 2014)
This space for Rent.

CraigsIsland

  • Frazil ice
  • Posts: 206
    • View Profile
  • Liked: 4
  • Likes Given: 25
Re: The 2014 Melting Season
« Reply #1119 on: June 10, 2014, 08:42:26 AM »
Thanks a lot for your short analysis, Chris. I agree with what you say. Low temps, cloudy weather during most of May  and current SIE/SIA slowdown point to 2014 not making the top 3 this year. On the other hand, there's the unprecedented retreat on the Siberian side of the Arctic, where the ice is generally weaker this year, just like in 2012. On top of that 2014's piggy bank with fringe ice is pretty full, which creates an artificially high (just slightly) SIE/SIA, but despite that 2014 was right there battling it out with other lower years on the SIE/SIA charts until a couple of days ago.

Quote
Anyone know of another observational SST source that covers the Arctic Ocean?
Well, you probably know it, but I really like DMI's SST anomaly map (and there are other maps on the ASIG):


First red and orange showing up in the Siberian heat absorber.

You'll have to explain sometime why you dislike DMI - but another time.

I have problems wrapping my brain around the temperature plots which imply we are having a "cooler" melt season, when I keep stumbling across stuff like this:
(NOAA, June 9, 2014)


Which is pretty amazing to see in light of "cooler" melt season thus far. Those reds aren't as surprising to me as the state of the ice (extent at least). A lot of interesting and abnormal weather that gives more data for those looking for that drunken stream effect to solidify their research.

Don't put away the popcorn yet; September/October have yet to emerge and nothing points to a "recovery" year at all.

Neven

  • Administrator
  • First-year ice
  • Posts: 9471
    • View Profile
    • Arctic Sea Ice Blog
  • Liked: 1333
  • Likes Given: 617
Re: The 2014 Melting Season
« Reply #1120 on: June 10, 2014, 09:06:29 AM »
You'll have to explain sometime why you dislike DMI - but another time.
I said 'like', and I like because visually appealing. I like the DMI SLP map and other maps as well. Only thing I don't like about DMI, is that they don't have an archive.
The enemy is within
Don't confuse me with him

E. Smith

Frivolousz21

  • Nilas ice
  • Posts: 1915
  • Live in Belleville, IL..15 miles SE of St. Louis.
    • View Profile
  • Liked: 598
  • Likes Given: 7
Re: The 2014 Melting Season
« Reply #1121 on: June 10, 2014, 09:20:38 AM »
Is this a surface skin temp?

How can there be anomalous water temps where there is full ice coverage?
I got a nickname for all my guns
a Desert Eagle that I call Big Pun
a two shot that I call Tupac
and a dirty pistol that love to crew hop
my TEC 9 Imma call T-Pain
my 3-8 snub Imma call Lil Wayne
machine gun named Missy so loud
it go e-e-e-e-ow e-e-e-e-e-e-blaow

Frivolousz21

  • Nilas ice
  • Posts: 1915
  • Live in Belleville, IL..15 miles SE of St. Louis.
    • View Profile
  • Liked: 598
  • Likes Given: 7
Re: The 2014 Melting Season
« Reply #1122 on: June 10, 2014, 11:35:13 AM »
Finally an explosion in Laptev regions SSTs Open water pool.

The next region to see an explosion in SSTs is the Beaufort side. 

And the Baffin.  It's going to be on fire in about a week.  We are going to see those huge sst anomalies off the West coast of GIS.  GFS is currently forecasting 10C 850mb temps there in 6 days which is a while but a massive signal of major -NAO torching.

And now the models are trending and quickly moving to a major mid June dipole anomaly. 


I got a nickname for all my guns
a Desert Eagle that I call Big Pun
a two shot that I call Tupac
and a dirty pistol that love to crew hop
my TEC 9 Imma call T-Pain
my 3-8 snub Imma call Lil Wayne
machine gun named Missy so loud
it go e-e-e-e-ow e-e-e-e-e-e-blaow

Frivolousz21

  • Nilas ice
  • Posts: 1915
  • Live in Belleville, IL..15 miles SE of St. Louis.
    • View Profile
  • Liked: 598
  • Likes Given: 7
Re: The 2014 Melting Season
« Reply #1123 on: June 10, 2014, 11:44:36 AM »
Environment Canada shows a legit 4C reading in the Southern Laptev.  So at least for a few days the Laptev water will be holding a lot more heat then it has up to now.

The ESS is getting totally baked today.


I got a nickname for all my guns
a Desert Eagle that I call Big Pun
a two shot that I call Tupac
and a dirty pistol that love to crew hop
my TEC 9 Imma call T-Pain
my 3-8 snub Imma call Lil Wayne
machine gun named Missy so loud
it go e-e-e-e-ow e-e-e-e-e-e-blaow

F.Tnioli

  • Grease ice
  • Posts: 772
    • View Profile
  • Liked: 147
  • Likes Given: 38
Re: The 2014 Melting Season
« Reply #1124 on: June 10, 2014, 12:52:12 PM »
...
The ESS is getting totally baked today.
Is there any near-sea-floor temperature recording stations in the ESS? If yes, can we see the data?
To everyone: before posting in a melting season topic, please be sure to know contents of this moderator's post: https://forum.arctic-sea-ice.net/index.php/topic,3017.msg261893.html#msg261893 . Thanks!

Frivolousz21

  • Nilas ice
  • Posts: 1915
  • Live in Belleville, IL..15 miles SE of St. Louis.
    • View Profile
  • Liked: 598
  • Likes Given: 7
Re: The 2014 Melting Season
« Reply #1125 on: June 10, 2014, 01:25:04 PM »
I wish there was. 

None recently that I know of.

I just meant there is a warm Southerly flow and modis shows a lot of clear skies over the ESS for the first time in a while.


We may have to batten down the hatches later on and hide the children.

I got a nickname for all my guns
a Desert Eagle that I call Big Pun
a two shot that I call Tupac
and a dirty pistol that love to crew hop
my TEC 9 Imma call T-Pain
my 3-8 snub Imma call Lil Wayne
machine gun named Missy so loud
it go e-e-e-e-ow e-e-e-e-e-e-blaow

jdallen

  • Young ice
  • Posts: 3410
    • View Profile
  • Liked: 650
  • Likes Given: 244
Re: The 2014 Melting Season
« Reply #1126 on: June 10, 2014, 05:18:35 PM »
You'll have to explain sometime why you dislike DMI - but another time.
I said 'like', and I like because visually appealing. I like the DMI SLP map and other maps as well. Only thing I don't like about DMI, is that they don't have an archive.
Ah, just so. I am corrected, thank you.
This space for Rent.

Neven

  • Administrator
  • First-year ice
  • Posts: 9471
    • View Profile
    • Arctic Sea Ice Blog
  • Liked: 1333
  • Likes Given: 617
Re: The 2014 Melting Season
« Reply #1127 on: June 10, 2014, 06:02:19 PM »
Ah, just so. I am corrected, thank you.

You're welcome. :-)

And with regards to that archive: luckily I started using those maps for every ASI update in 2012, so I still can somewhat compare.

For instance here's the DMI SST anomaly map from June 15th 2012:


And June 21st 2013:


And again, today, June 10th 2014:


Definitely not as 'hot' as 2012, but perhaps on a par with 2013. Except that there's still 5 days to go for a fair comparison with 2012, and 11 days for a fair comparison with 2013.
The enemy is within
Don't confuse me with him

E. Smith

helorime

  • Frazil ice
  • Posts: 129
    • View Profile
  • Liked: 3
  • Likes Given: 18
Re: The 2014 Melting Season
« Reply #1128 on: June 10, 2014, 06:09:03 PM »
57 F and raining in Tiksi. The forecast is not to get below freezing for the next 10 days. Average high for the month is 45 F.  The forecast lows for later in the week are above that.
Any sufficiently advanced technology is indistinguishable from magic.

Bob Wallace

  • Young ice
  • Posts: 3855
    • View Profile
  • Liked: 41
  • Likes Given: 5
Re: The 2014 Melting Season
« Reply #1129 on: June 10, 2014, 06:27:39 PM »
Just an observation -

Side by side image comparisons are easier (at least for me) than are top/bottom.


It might have something to do with poor memory.  But I also remember something from an experimental psychology class a half century or so ago about simultaneous vs. sequential difference detection....

ChrisReynolds

  • Nilas ice
  • Posts: 1764
    • View Profile
    • Dosbat
  • Liked: 20
  • Likes Given: 9
Re: The 2014 Melting Season
« Reply #1130 on: June 10, 2014, 06:31:52 PM »
...... Concerned that cloud/fog is cutting out some sunlight? Lets say it cuts out half the sunlight, that's still a 30% gain in absorbed solar, and if it's cloud then the cloud is back radiating infra-red, which is absorbed by water and reflected by ice like sunlight.
....
Ice, like water is not transparent at longwave IR wavelengths, it is a good absorber and emitter although less so than fresh snow. Albedo difference between ice and water must play a much smaller role in LW IR than sunlight.
I think the temperature profile from buoy data give some clue to radiation input into ice. I notice that the upper ice shows higher temps  than air and middle of the ice. I.e. it is cooled by ice below and air above, only heat source would be radiation, I think sunlight, clouds won't be warmer than ice (and therefore can only reduce cooling, not act as heat source) The crucial question is what is the difference to other years. I would like to see cloudiness anomalies plots the way there are temperature anomalies plots, does somebody know whether they exist?

Thanks Andreas, I did pause before posting that part (about albedo). I find I've misremembered Eisenman "On the reliability of simulated Arctic sea ice in global climate models" in which tuning of albedo is discussed in relation to downwelling longwave, but it's tuning of the shortwave albedo to compensate for unrealistic downwelling longwave.

I disagree that clouds cannot warm. They are effectively blackbody emitters as the droplets of water in them tend to be of similar size to the emitted wavelength, the longwave flux doesn't 'know' that the temperature of the body it hits is warmer or colder than the body emitting it. See Francis & Hunter New Insight Into the Disappearing Arctic Sea Ice.
http://marine.rutgers.edu/~francis/pres/Eos_11-14-2006EO460001.pdf
For a discussion of the importance of downwelling longwave in sea ice melt.

jdallen

  • Young ice
  • Posts: 3410
    • View Profile
  • Liked: 650
  • Likes Given: 244
Re: The 2014 Melting Season
« Reply #1131 on: June 10, 2014, 06:48:02 PM »
57 F and raining in Tiksi. The forecast is not to get below freezing for the next 10 days. Average high for the month is 45 F.  The forecast lows for later in the week are above that.

The rain is trouble. I was following precipitation forecasts via Climate Reanalyzer, and the next few days suggest rain may fall across fairly large extents of the ESS and Beaufort.  There appears to me a separate disturbance which will bring rain to the Weatern Kara.  I think it warrants following.
This space for Rent.

ChrisReynolds

  • Nilas ice
  • Posts: 1764
    • View Profile
    • Dosbat
  • Liked: 20
  • Likes Given: 9
Re: The 2014 Melting Season
« Reply #1132 on: June 10, 2014, 06:57:42 PM »
Thanks Neven, I had forgotten about DMI, I'll be using that.

forkyfork

  • New ice
  • Posts: 43
    • View Profile
  • Liked: 5
  • Likes Given: 0
Re: The 2014 Melting Season
« Reply #1133 on: June 10, 2014, 07:42:48 PM »
i don't think the fog is good for the ice. dewpoints above freezing will quickly melt ice due to latent heat release when condensation occurs

Neven

  • Administrator
  • First-year ice
  • Posts: 9471
    • View Profile
    • Arctic Sea Ice Blog
  • Liked: 1333
  • Likes Given: 617
Re: The 2014 Melting Season
« Reply #1134 on: June 10, 2014, 07:45:12 PM »
Voting for the NSIDC SIE poll and CT SIA poll closes in about 12 hours, so there's still some time left to vote or change your vote.
The enemy is within
Don't confuse me with him

E. Smith

ChrisReynolds

  • Nilas ice
  • Posts: 1764
    • View Profile
    • Dosbat
  • Liked: 20
  • Likes Given: 9
Re: The 2014 Melting Season
« Reply #1135 on: June 10, 2014, 08:12:17 PM »
Neven,

With regards the 2012 patch of warm open water. It's worth stepping back a few days on the DMI site.
http://ocean.dmi.dk/arctic/satellite/index.uk.php

If the relatively clear skies persist over the polynya, and winds don't move ice back into it, given the rate of warming over the last five days I wouldn't be surprised if it's as warm as your 15th June image in five days time.

****

GFS surface temperature has zeroes across the board from tomorrow onwards, I'm going to stick my neck out and state that I'm expecting that the June CT Area anomaly cliff will start this week.  It's worth noting that 2010 had a strong June cliff, but by this date was dominated by low pressure.

However GFS shows a blocking high over the UK developing - the same thing happened last year and was not typical of the 2007 to 2012 years.
« Last Edit: June 10, 2014, 08:37:28 PM by ChrisReynolds »

Lord M Vader

  • Nilas ice
  • Posts: 1406
    • View Profile
  • Liked: 60
  • Likes Given: 39
Re: The 2014 Melting Season
« Reply #1136 on: June 10, 2014, 09:24:30 PM »
One thing that I don't think we've discussed much here is the precipitation anomalies in the Arctic. Given that there still are low temps in the Arctic it would be interesting to know if there is more snow on the ice than usual. Anyone who have some data to show us?

Latest EURO 12z run is both icefriendly and extremely interesting!! about +168h a BAC seems to show up. Latest GFS 12z run is quite meltfriendly.

I put my money on the EURO. It uses to be KING over GFS. This meltseason may be over now already. The DMI still has temps about 3 degs below normal which actually is even colder than compared to last year at this time...

Let's see if 2015 gives us something more spectacular if El NiƱo shows up later this year in a strong version...

Neven

  • Administrator
  • First-year ice
  • Posts: 9471
    • View Profile
    • Arctic Sea Ice Blog
  • Liked: 1333
  • Likes Given: 617
Re: The 2014 Melting Season
« Reply #1137 on: June 10, 2014, 09:32:31 PM »
This meltseason may be over now already.

Maybe we should wait and see what the coming 4-5 dipole days with extensive highs over the entire American side of the Arctic will do to the ice. Beaufort and Baffin should be getting a solar beating. And there's that gaping hole on the other side too.   :)
The enemy is within
Don't confuse me with him

E. Smith

Neven

  • Administrator
  • First-year ice
  • Posts: 9471
    • View Profile
    • Arctic Sea Ice Blog
  • Liked: 1333
  • Likes Given: 617
Re: The 2014 Melting Season
« Reply #1138 on: June 10, 2014, 10:07:04 PM »
I've been fiddling around with images from ClimateReanalyzer to come up with a good GFS 10-day air temperature forecast. Here's the first result:


Kind of sucks right now, but I found some automatic batch processing stuff that should make this easier next time.

Anyway, is the Pacific side now finally going to heat up?
The enemy is within
Don't confuse me with him

E. Smith

forkyfork

  • New ice
  • Posts: 43
    • View Profile
  • Liked: 5
  • Likes Given: 0
Re: The 2014 Melting Season
« Reply #1139 on: June 10, 2014, 11:13:39 PM »
a nasty fram export pattern develops tomorrow and lasts for the next week+ on the euro/euro ens mean. cyclones develop and run into the greenland block, causing strong westerly flow on the NA side of the arctic basin


Blizzard_of_Oz

  • New ice
  • Posts: 21
    • View Profile
    • 50-Day melt season forecast
  • Liked: 0
  • Likes Given: 0
Re: The 2014 Melting Season
« Reply #1140 on: June 10, 2014, 11:29:57 PM »
Perhaps of interest or amusement: Persistence Forecasting

Persistence can be computed in several ways and I have looked out to Sept. for the sake of comparison.

1) Daily anomaly persistence at 115 days lead time (so that I can go all the way to Sep 30th), then compute mean for Sept = 5.8

2) Persist the absolute anomaly from May to Sept (using NSIDC monthly value, not mean of daily). Sept = 5.8 (semi-coincidence that it's the same)

3) Persist the standard normal deviate from May to Sept (using NSIDC monthly). Labeled as "Variance Persistence". Sept = 4.9

All three methods have a skill value of less than -1.0 i.e. absolutely no skill!
Skill = as per Schroder et al. 2014 (for +18yrs of data)
Shading on 1980-2010 Average is 1 Std. Dev.


« Last Edit: June 11, 2014, 12:23:59 AM by Blizzard_of_Oz »

Frivolousz21

  • Nilas ice
  • Posts: 1915
  • Live in Belleville, IL..15 miles SE of St. Louis.
    • View Profile
  • Liked: 598
  • Likes Given: 7
Re: The 2014 Melting Season
« Reply #1141 on: June 11, 2014, 05:55:14 AM »
I don't like how there are large concentrations of poor ice on the Atlantic side like last year.


The Atlantic side was hit a bit in late May


it's in the same place it seems year to year now.  The ice may have been weakened  by that late May warmth.  Whatever it is. Once again it's showing up on Jaxa channel 89.  And it's not only that scanning channel.  The lowcentrationcontinues to show up in lower res channels.  That are less effected by clouds but also less effected by ice thickness like bremen is using channel 89.


Channel 89 and 91GHZ.  CT and NSIDC use 91GHZ from SSMIS for their daily output.  NSDIC also uses the lower SSMI channels for their long term data set.


CT area is not only effected by melt ponds and real concentration being low.  But it's also effected by the ice being very thin.  Well once again using the most recent decently clear shot in the region.


This is the channel 89 GHZ Jaxa scan from yesterday.  We have a relatively clear view over the Atlantic side without cloud obstruction.


You can see the area where the ice is thinner over the Atlantic side.  This same thing showed up last year as well between late May and mid June.  The pattern was different then tho.


Evidence of this appeared around the end of May into early June right after the HP period and foggy days.  June 9th had the least amount of interference.  Remember even tho the bremen image says June 10th. A lot of the data for Bremens June 10th is data from the 9th from an American point of view.


It's pretty obvious looking at the bremen image that also uses channel 89 GHZ that the low concentration coincides with the thinner ice spot on the graphic below.


I think the base state beneath the ice in that region has had to have changed potentially during the 2011 and 2012 season when very warm salty water was allowed to push so far into the basin above and below the surface.


2013 only let it come further North. Now we have had months of flushing in this direction and around the same time as 2013 is shows up again.


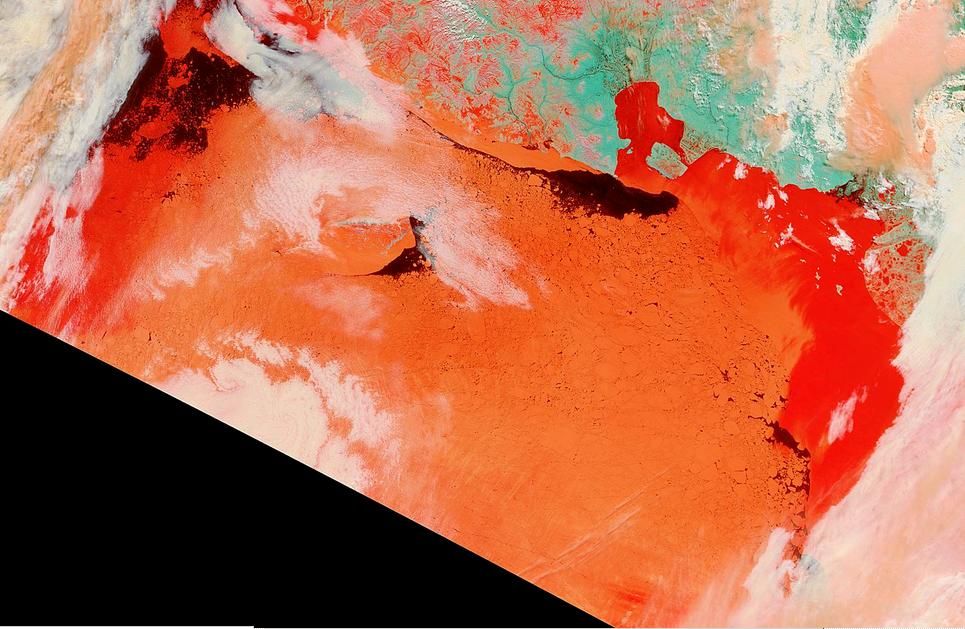
Today on the Pacific side. Skies are clear and max insolation got around today.  We can see the red areas easy but there is dis coloring all over the RUssian side into thecentral basin.  There is the area of higher snow on the ice along the Chukchi to the Northern CAB and central arctic.


By tomorrow a large part of the ESS region will see a substantial drop.  The Chukchi side will follow too.


I got a nickname for all my guns
a Desert Eagle that I call Big Pun
a two shot that I call Tupac
and a dirty pistol that love to crew hop
my TEC 9 Imma call T-Pain
my 3-8 snub Imma call Lil Wayne
machine gun named Missy so loud
it go e-e-e-e-ow e-e-e-e-e-e-blaow

ChrisReynolds

  • Nilas ice
  • Posts: 1764
    • View Profile
    • Dosbat
  • Liked: 20
  • Likes Given: 9
Re: The 2014 Melting Season
« Reply #1142 on: June 11, 2014, 07:58:17 AM »
Dr Slater's prediction for 29/7/14. Note this uses the NASA Team algorithm, it is not NSIDC Extent.
http://cires.colorado.edu/~aslater/SEAICE/

From the timeseries plot I estimate 29/7/14 extent to be just below 6.75M km^2. Here are the years from 2007 to 2012 (NTA data only to 2012) for 29/7/14 extent, with Dr Slater's prediction for 2014 inserted where it fits....

2012, 6.60
2007, 6.71
2011, 6.72
2014, 6.75 Slater prediction
2010, 7.04
2009, 7.07
2008, 7.57

ChrisReynolds

  • Nilas ice
  • Posts: 1764
    • View Profile
    • Dosbat
  • Liked: 20
  • Likes Given: 9
Re: The 2014 Melting Season
« Reply #1143 on: June 11, 2014, 08:03:55 AM »
And I scroll up and find that Blizzard of Oz has posted - Dr Slater if I recall correctly?

Blizzard of Oz,
Can you explain the difference between anomaly persistence and forecast? It doesn't seem to be explained in your poster.

On your page, would it be much trouble to provide a figure for your latest prediction, possibly with confidence interval?

Neven

  • Administrator
  • First-year ice
  • Posts: 9471
    • View Profile
    • Arctic Sea Ice Blog
  • Liked: 1333
  • Likes Given: 617
Re: The 2014 Melting Season
« Reply #1144 on: June 11, 2014, 09:32:54 AM »
ClimateReanalyzer now has forecast maps for just the Arctic. How awesome is that?!? *cheers*

I'll be using those for animations soon, I think.

Quote
We can see the red areas easy but there is dis coloring all over the RUssian side into thecentral basin.
My impression looking at LANCE-MODIS satellite images yesterday was that the blue is now spreading.
The enemy is within
Don't confuse me with him

E. Smith

lanevn

  • New ice
  • Posts: 91
    • View Profile
  • Liked: 0
  • Likes Given: 0
Re: The 2014 Melting Season
« Reply #1145 on: June 11, 2014, 10:29:53 AM »
ClimateReanalyzer now has forecast maps for just the Arctic. How awesome is that?!? *cheers*

And it shows +30C at Laptev,s shore June, 18,  xD

Frivolousz21

  • Nilas ice
  • Posts: 1915
  • Live in Belleville, IL..15 miles SE of St. Louis.
    • View Profile
  • Liked: 598
  • Likes Given: 7
Re: The 2014 Melting Season
« Reply #1146 on: June 11, 2014, 11:06:59 AM »
Looking at Jaxa it's amazing how much almost transparent by satellite looking ice is still barely holding on.

We are now moving anywhere from 250-500K above some of the years in the last decade between the Baffin and Hudson.

I don't see record melt unless there is an endless torch thru Mid June on.  Then of course.

With a wall to wall dipole torch now we could probably get around 2 mil km2 extent wise.

If you loo closely you will see there is also one of these darker areas in the Beaufort region.  As melting takes off in earnest over the next few days I think we will see enough surface melt and sunny skies to see a large region in the beaufort area drop in concentration.

The bottom image shows the low concentration when it's not shrouded in clouds.

It appears we may finally get a total clear shot of the Beaufort region over the next few days.


I got a nickname for all my guns
a Desert Eagle that I call Big Pun
a two shot that I call Tupac
and a dirty pistol that love to crew hop
my TEC 9 Imma call T-Pain
my 3-8 snub Imma call Lil Wayne
machine gun named Missy so loud
it go e-e-e-e-ow e-e-e-e-e-e-blaow

Jim Hunt

  • First-year ice
  • Posts: 6268
  • Don't Vote NatC or PopCon, Save Lives!
    • View Profile
    • The Arctic sea ice Great White Con
  • Liked: 893
  • Likes Given: 87
Re: The 2014 Melting Season
« Reply #1147 on: June 11, 2014, 01:18:40 PM »
The clouds over the Beaufort Sea have parted this morning, to reveal this:

http://GreatWhiteCon.info/resources/arctic-sea-ice-images/summer-2014-images/#Beaufort
"The most revolutionary thing one can do always is to proclaim loudly what is happening" - Rosa Luxemburg

Jim Hunt

  • First-year ice
  • Posts: 6268
  • Don't Vote NatC or PopCon, Save Lives!
    • View Profile
    • The Arctic sea ice Great White Con
  • Liked: 893
  • Likes Given: 87
Re: The 2014 Melting Season
« Reply #1148 on: June 11, 2014, 05:31:17 PM »
The air temperature sensor on IMB 2013B north of Barrow is still reading below zero, but the thermistors tell a different story:

http://GreatWhiteCon.info/resources/ice-mass-balance-buoys/summer-2014-imbs/#2014B

There's still 9 cm of snow on top of the ice, but bottom melt started on May 20th.
« Last Edit: June 11, 2014, 06:06:53 PM by Jim Hunt »
"The most revolutionary thing one can do always is to proclaim loudly what is happening" - Rosa Luxemburg

ChrisReynolds

  • Nilas ice
  • Posts: 1764
    • View Profile
    • Dosbat
  • Liked: 20
  • Likes Given: 9
Re: The 2014 Melting Season
« Reply #1149 on: June 11, 2014, 06:18:16 PM »
Jim,

I'd hazard a guess - the air temperature is inside a miniature Stevenson Screen, shielded from direct sunlight, the thermistor string almost certainly isn't.